Financial statement analysis (FSA) of vinamilk
Bạn đang xem bản rút gọn của tài liệu. Xem và tải ngay bản đầy đủ của tài liệu tại đây (164.64 KB, 17 trang )
GROUP ASSIGNMENT
---------- GROUP 1 ---------Course : Business Finance.
Class : International Business K56 (High-Quality Educational
Program)
Topic: Financial statement analysis (FSA) of Vinamilk
(Vietnam Dairy Product Joint-stock Company)
Group Members:
1.
2.
3.
4.
5.
Đặng Hương Giang
Phạm Thị Hoàng Diệu
Nguyễn Cẩm Tú
Nguyễn Thị Dịu
1.
Overview of Vietnam Dairy Product Joint-stock Company
(Vinamilk) :
1.1.
Introduction
In recent years, dairy has become one of the fastest growing sectors in the food
industry of Vietnam. Along with the common trend of developing countries,
Vietnam dairy's demand is significantly increasing as a crucial supplementary
nutrition source. One of the most leading dairy companies in Vietnam, Vietnam
Dairy Product Joint-stock Company (Vinamilk), has operated over 30 years and
gained noticeable successes in the Vietnamese fresh milk market.
1.2.
Company profile:
Vietnam Dairy Product Joint-stock Company (Vinamilk) is a manufacturer and
trading of milk and dairy products as well as related equipment in Vietnam. Based
on the UNDP 2007 Top 200 largest firms in Vietnam report, it is also the 15th
largest company in Vietnam. In 2010, it is the first company in Vietnam to be
included in the Forbes Asia's 200 Best Under A Billion list that highlights 200 topperforming small- and mid-sized companies with annual revenue under US$1
billion.
The company was established in 1976 as the state-owned Southern Coffee-Dairy
Company, to nationalize and take over the operations of three previously private
dairy factories in South Vietnam: Thống Nhất, Trường Thọ, and Dielac. In 2003,
follows its IPO to the Ho Chi Minh Stock Exchange, the company legally changed
its name to Vietnam Dairy Products Joint Stock Company (Vinamilk).
1.3.
Products:
The principal activities of the Vinamilk are produce and distribute condensed milk,
powdered milk, fresh milk, soya milk, yogurts, ice-cream, cheese, fruit juice,
coffee and other products derived from milk.
1.4.
Market:
VNM has been maintaining the leading role on the domestic market and
competting effectively with foreign milk brands. VNM occupies about 30-80%
market share in the domestic product. Over 90% of the export turnover of VNM is
the Middle East market. To reduce risk, VNM is expanding to other markets such
as Australia, the USA, Canada, Thailand. In addition, VNM are making an efforts
to break intothe cafe and beer market.
-
The domestic market :Vinamilk is the leading enterprises in Vietnam
which specializes in production of dairy products. At present, Vinamilk
accounts for about 39% of the market. Their product are sold through all the
-
supermarkets nationwide.
Overseas market : VNK focus mainly on Vietnamese market which
accounts for about 80% of the revenue in the past fiscal years. The products
of VNM are exported to many country such as: Australia, Cambodia, Iraq,
Kuwait, The Maldives, The Philippines, Suriname, the UNITED ARAB
EMIRATES and United States of America.
1.5.
The opponents
The milk market in Vietnam has a high level of competition. Beside other milk
producers in countries such as Longthanhmilk, Hanoimilk, TH Truemilk ...
Vinamilk has to compete with the very famous imported products such as Abbott,
Mead Johnson, Nestle, Dutch Lady ... Even so, last year, Vinamilk continued to
hold the lead with the market share properties for all dairy products to about 37%.
2.
Analysis of Vinamilk financial statements :
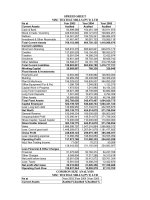
Balance Sheet:
Assets
Cash
A/R
Inventories
Total CA
Gross FA
Less: Deprec.
Net FA
Total Assets
2012
852120160804
2,246,362,984,001
3,472,845,352,518
2013
1,394,534,283,673
2,728,421,414,532
3,217,483,048,888
11,110,610,188,964
13,018,930,127,438
10,465,296,772,945
2,422,996,224,452
8,042,300,548,493
12,375,882,086,100
3,457,465,550,721
8,918,416,535,379
19,697,868,420,379
22,875,414,056,636
27,101,683,739,278
17,484,830,247,188
540,109,559,314
EBITDA 9,076,743,932,776
2,143,961,077,724
6,932,782,855,052
EBIT
3,114,837,973
6,929,668,017,079
1,110,213,299,996
31,586,007,133,622
19,765,793,680,474
637,405,006,316
11,182,808,446,832
3,172,447,563,065
8,010,360,883,767
104,027,048
8,010,256,856,719
1,476,149,541,092
Income statement
Sales
COGS
Other expenses
Deprec. & amort.
Interest exp.
EBT
Taxes
Net income
5,819,454,717,083
6,534,107,315,627
Liabilities and Equity
Accts payable
Notes payable
Accruals
Total CL 4,144,990,303,291
4,956,397,594,108
Long-term debt
Common stock
Retained earnings
Total
Equity
Total L & E
2.1.
15,493,096,595,858
17,545,489,315,423
4,204,771,824,521
5,307,060,807,329
Finance ratios (Using Horizontal analysis methods) :
Data table( 2012 – 2015)
2012
2013
2014
2015
27,101,683,739,278
31,586,007,133,622
35,703,776,176,355
40,222,599,525,948
-
4,484,323,394,344
4,117,769,042,733
4,518,823,349,593
-
17%
13%
13%
20,406,987,987,824
23,744,271,632,880
28,241,656,668,012
31,471,038,874,623
-
3,337,283,645,056
4,497,385,035,132
3,229,382,206,611
Total revenue
(VND)
∆ Revenue
(VND)
∆ Revenue(%)
(VND)
Total Expense
(VND)
∆ Expense
(VND)
∆ Expense (%)
-
16.4%
18.9%
11.4%
tax (VND)
5,819,454,717,083
6,534,107,315,627
6,068,202,966,308
7,769,558,751,697
∆ EAT(VND)
-
714,652,598,544
-465,904,349,319
1,701,355,785,389
∆EAT(%)
-
12.3%
-7.1%
28%
Earning after
The bar chart and the table above illustrate the number of total revenue, total cost
and earnings after tax of Vinamilk in three years’ time starting 2012. In general, it
is of apparent that the number of total revenue, total expense together with net
profit have an increase.
More particularly, the revenue of Vinamilk upsurge by thirteen thousand billion
dong from 2012 to 2013. Although Vinamilk’s revenue has achieved an impressive
increased, approximately 15% per year on average, its growth rates has a
descending trend. In details, the growth percentages of the total revenue 2013,
2014 and 2015 are 16.5%, 13% and 12.6% respectively.
At the same time, total expense witnessed a rise of eleven thousand billion dong.
In two years 2013 and 2014, total expenses has go up by 15% and 20% each year.
Nevertheless, in 2015, it has plummet by 10% which was less than a half that
number of 2014. Therefore, it can be seen that Vinamilk has get the best out of
resources.
In addition, in the last four years, the number of earnings after tax of Vinamilk is
also amazing. Generally speaking, net profit has an upward trend and reaches a
peak almost 7.7 thousand billion in 2015. In 2014, despite what Vinamilk ‘s aftertax profit fell down 6 thousand billion dong which was less 500 billion than 2013,
it had an excellent recovery after one year. More specifically, net profit has risen
28% in 2015.
On the whole, Vinamilk has achieved great growth rates every year.
2.2.
Finance ratios (Using Vertical methods)
2012
2013
2014
2015
27,101,683,739,278
31,586,007,133,622
35,703,776,176,355
40,222,599,525,948
Operating income/ Total
revenue(%)
98%
98%
98%
99.6%
Financial income/ Total
Revenue (%)
1.8%
1.6%
1.6%
1.6%
Other income/Total revenue
(%)
1.3%
1%
1%
0.5%
COGS/ Net Revenue(%)
64%
64%
65%
59%
20,406,987,987,824
23,744,271,632,880
28,241,656,668,012
31,471,038,874,623
85.7%
83.2%
80.3%
75.7%
Selling,administrative & general
expense/Total Expense (%)
14%
16.4%
19.4%
23.8%
Financial expenses/ Total
expense(%)
0.3%
0.4%
0.3%
0.5%
5,819,454,717,083
6,534,107,315,627
6,068,202,966,308
7,769,558,751,697
21.5%
20,7%
17%
19.3%
Total Assets)(VND)
19,697,868,420,379
22,875,414,056,636
25,770,138,060,957
27,478,175,944,352
Tài sản cố định ( Fixed Assets)
(VND)
8,042,300,548,493
8,918,416,535,379
8,890,084,022,717
8,214,134,749,497
41%
40%
34%
30%
6,554,260,196,767
5,969,901,577,449
5,307,060,807,329
4,204,771,824,521
33%
26%
21%
15%
59,781,521,230
350,663,213,221
516,638,646,418
549,943,361,554
15,493,096,595,858
17,545,489,315,423
19,680,282,615,855
20,923,915,747,585
0.4%
2%
3%
3%
Total REVENUE(VND)
Total Expense(VND)
COGS/Total Expense(%)
Earning after tax(VND)
EAT/TR (%)
FA/TA(%)
LIABILITIES (VND)
LIABILITIES/TA
Long-term liabilities (VND)
Equity (VNĐ)
Long-term liabilities/Equity (%)
As can be seen, Vinamilk has a significant rise in total revenue by 13 thousand
billion VND from 2012 to 2015. Nevertheless, growth rates of Vinamilk remained
constant of 13% in the last two years.
Operating income of Vinamilk is always excellent. More particularly, in 2015
operating income of Vinamilk is almost 39.8 thousand billion VND which was
uplifted by 25.6% than that number in 2013. During last 4 years, the percentage of
operating income divided total revenue is unfailingly more than 98%. In addition,
financial income and other income made up 1.6% and 1% respectively, especially
the percentage of other income fell down 0.5% in 2015. These numbers shows that
Vinamilk’s revenue is mostly on dairy industry.
The table data also gives information on the percentage of COGS-cost of goods
sold divided net revenue from 2012 to 2015. This percentage remains the same
nearly 64% in the first three years but it has plummeted at 59% in 2015. Vinamilk
has invested its money in new automatic systems which applied on manufacture is
one of the most reasons made ratio of COGS reduce. In addition, the percentage of
COGS dropped also made the net profit of Vinamilk climb. More particularly, the
EAT (earning after tax) has soared approximately 7.7 thousand billion VND in
2015.
Although total expense of Vinamilk rises every year, the growth rates of expense
has a reduction from by 7.5% from 2014 to 2015. Furthermore, the percentage of
COGS divided total expense has a downward trend throughout the period. This
percentage in 2012, 2013, 2014 and 2015 is 85.7%, 83.2%, 80.3% and 75.7%
respectively. These figures showed that COGS is mainly on total expenses. On the
other hand, the percentage of selling and administrative expense divided total
expense has a ceiling trend nearly 9.8% from 2012 to 2015. Financial expense is
the lowest and the percentage of it divided total expense just about 0.4% each year.
Structure of assets
According the data table, total asset of Vinamilk has significant increased
approximately 8 thousand billion VND in four years’ time starting 2012. More
particularly, Vinamilk’s fixed assets fluctuated throughout the last five years. They
hit the bottom at about 8 thousand billion VND in 2012 and reached the peak at
nearly 8.9 thousand billion VND after two years. Otherwise, the percentage of
fixed assets divided total assets has a downward tendency. In two first years, fixed
assets made up more 40% and they are largest in total assets. However, after two
years, they declined just about 30%.
During the last five years, liabilities of Vinamilk and the percentage of liabilities
divided total assets reduced sharply roughly 2.3 thousand billion VND and 18%
respectively. In addition, long-term liabilities rose dramatically by 487% in 2012,
for Vinamilk has an international bank loan. Vinamlik’s long-term liabilities
culminated approximately 550 thousand billion VND in 2015. Nevertheless,
Vinamilk ‘s equity rocketed about 19.6 thousand billion VND in 2014 and
increased slow by 1.3 thousand billion VND after one year. More specitically, the
percentage of long-term liabilities divided equity soared by 2.6% from 2012 to
2014.
2.3.
Financial ratios analysis
2.3.1. Current ratio & Quick ratio
2012
2013
2014
2015
Industry
Current ratio
2,68
2,63
2,85
2,79
1,64
Quick ratio
1,84
1,98
2,18
2,15
1,26
Current ratio
The current ratio illustrates the ability to pay for the short-term liabilities
from the company's short-term assets. In account analysis from 2012 to 2015, the
ratio which expresscurrent liquidity of the company are very high, at a level of
almost 3 times. Specifically, this ratio had increased from 2.68 times in 2012 to
2.85 times in 2014. Though it decreased in 2015, about 2.79 times, the current
liquidity ratios of the company is always high. When compared with the average
food production industry in 2015 which is 1.64 times, Vinamilk also expressed
their superior in ability to pay short-term liability.
Quick ratio
Quick ratio expresses theability to pay for the short-term liability of the
company from the short term assets with high liquidity. Quick ratio of Vinamilk in
late 2012 is 1.84 times, so even if the inventory is removed , the ability to pay
short-term liability of Vinamilk is still very good. This ratios of the company are
above 1 throughout the period analysed from 2012 to 2015, and the lowest ratio is
in 2012 which hit 1.84 times. Quick ratio of Vinamilk has remarkably increased. If
compared with theaverage of the industry, liquidity of Vinamilk is also in the top
of Vietnam and tend to be a long-term stability.
Conclusion:
Overall, compared with the market, the ratios of VNM are very good and
with the company's current liability(current liquidity ratios are always above 2,
quick liquidity ratios are always above 1) so that the liquidity of the company is
guaranteed well. The company's financial situation is quite good.
2.3.2. Inventory turnover&Total asset turnover
2012
2013
2014
2015
Ind.
Inventory turnover
780%
982%
986%
1056%
602%
TA
13,8
13,8
13,9
14,6
8,2
Inventory turnover
Inventory turnover of Vinamilk 2015 increased than that of 2012. The ratio
shows that commodity consumption rate of Vinamilk higher than the production
rate. This shows the rising business efficiency and capital, the market conditions
and consumer product are favorable. The frequent changes of inventory turnover
over the years also shows goodsales management.
Total asset turnover
Total asset turnover system used to evaluate the effectiveness of the usage of
the assets in the company. Through the analysisresults, we see that vinamilk use
the assets of the company in the production and business operation is very
efficient. This shows that Vinamilk manage and invest their fixed assets very
closely, they can calculate the benefits that brought to the company when making
investments. Compared with the industry average is 8.2, Vinamilk expresses the
efficiency of investment which are very good compared to other companies.
2.3.3. Debt/ Asset
2012
Debt/ Asset
21%
2013
23%
2014
23%
2015
24%
This ratio indicates how many percentage of the company’s assetsfrom borrowers
is. The ratio from 2012-2015 is around 21% to 24%.Vinamilk's liability ratio over
the years tend to stabilize at a level below 30%. This represents that the company
has advocatedto use the debt in a reasonable and stable level over time. This ratio
is lower than the industry average. This shows the ability of the financial autonomy
of the company is very good.
Conclusion:
Vinamilk strategically used its own capital in the investment rather than borrowing
from banks. The short-term debt of the company is mainly theaccounts payable.
Vinamilk's financial ability is very good and their risk of debt distress is low. But
by using too much stockholder’s equity will affect the ability to increase the
company profits and dividends for shareholders. Granting credit to Vinamilk is
very safe.
2.3.4. Profit margin, ROA, ROE& TIE
Earning ratios
Profit margin
ROA
ROE
TIE
2012
21%
30%
38%
2225,7
2013
21%
29%
37%
77002,7
2014
17%
24%
31%
193,3
2015 Ind.
19%
28%
14%
37%
27%
300,5
Profit margin
The profit margin of vinamilk's shows that they managed their resources
effectively. Profit margin reduced because the profit was lower than revenue
growth; this was due to the rise in the cost of recent years. However the higher coefficientnet profit margins shows that vinamilk is an enterprise that has
potentialityin the period of inflation.
ROA
ROA of Vinamilk from 2012-2015 are above 14% and 30% in the year
2012. This is avery impressive number not only in Vietnam but also around the
world. In addition , this also shows the ability to maintain the company. Compared
with many businesses in the same field of dairy in Vietnam, the profitability ratios
of VNM are very impressive. This shows that the company has used its assets
effeciently in making profits for the company.
ROE
ROE of Vinamilk also increased sharply in recent years. In compared with
the number of the whole industry and the businesses listed on Vietnam's stock,
profitability of Vinamilk is very good and tend to sustainably grow.
TIE
Times interest earned expresses the level of profits that guarantee the ability
to pay interest. To be able to pay interest for the credit providers, companies need
to use the loan effectively, this indicator shows that the profit guarantee forthe
company’s ability to pay interest . Due to the small loan of Vinamilk and its very
good profitability, the ratio of profit before tax and interest is higher than the
interest ratio of Vinamilk in the period of 2012-2015. The company's repayment
ability is very good and safe .
Conclusion
Profitability that the company Vinamilk has performed in the period 20122015 is very good on all index and demonstrate the sustainable growth trends over
the years.
In the years from 2012-2015, the financial ratio in 2014 of vinamilk had a
slight drop. It was due to the decreased in purchasing, and the policy of imposing
aceiling price for milk powder products from June 2014. The Revenue is nearly 36
billion USD due to the contribution of foreign companies that have invested in
Vinamilk such as factories Driftwood (USA) and Miraka Limited (New Zealand).
Thanks to the new lines of products that helped the company to compete in a
higher product segment. The Dielac products Grow for children at the age of 1-10
has offset the revenue.
2.3.5. P/E
2012
P/E
8,4
2013
16,05
2014
13,89
2015
17,54
Ind.
10,6
In compared with the P/E index of the industry which is 10,6, P/E of Vinamilk
currently are at very high levels. This is because the investors are expected in the
development of the company in the future due to the excellent profitability and
investment projects of VNM.
Conclusion
Due to the market's expectations of the development of the company, the stock of
Vinamilk is priced at a high level compared with other companies.Investing in
Vinamilk’s stock is quite safety but their profit from dividends to investors is not
high.
3.
Conclusion :
-
The financial analysis of the company Vinamilk in the 2012-2015 period
showed that Vinamilk is in good financial health, their financial ratios are
also very excellent : they has high liquidity and ability to develop in the
future.
-
The increase in revenues and profits of the company has met the need of
-
investors.
VNM has ability togrant credit facility.
Their risk of debt distress is low.
-----The End-----