Project management chapter 8
Bạn đang xem bản rút gọn của tài liệu. Xem và tải ngay bản đầy đủ của tài liệu tại đây (2.52 MB, 32 trang )
Cost Estimation and Budgeting
Chapter Outline
PROJECT PROFILE
Boston's Central Artery/Tunnel Project: Updated and Complete
8.1 COST MANAGEMENT
Direct vs. Indirect Costs
Recurring vs. Nonrecurring Costs
Fixed vs. Variable Costs
Normal vs. Expedited Costs
8.2 COST ESTIMATION
Learning Curves in Cost Estimation
Problems with Cost Estimation
PROJECT MANAGEMENT RESEARCH IN BRIEF
Software Cost Estimation
PROJECT PROFILE
Heathrow Airport's Terminal Five Development
8.3 CREATING A PROJECT BUDGET
Top-Down Budgeting
Bottom-Up Budgeting
Activity-Based Costing
8.4 DEVELOPING BUDGET CONTINGENCIES
Summary
Key Terms
Solved Problems
Discussion Questions
Problems
Case Study 8.1 The Dulhasti Power Plant
Case Study 8.2 London's Millennium Dome
Internet Exercises
PMP Certification Sample Questions
Integrated Project—Developing the Cost Estimates and Budget
Notes
247
248
Chapter 8 • Cost Estimation and Budgeting
Chapter Objectives
After completing this chapter, you should be able to:
1. Understand the various types of common project costs.
2. Recognize the difference between various forms of project costs.
3. Apply common forms of cost estimation for project work, including ballpark estimates and definitive
estimates.
4. Understand the advantages of parametric cost estimation and the application of learning curve models
in cost estimation.
5. Discern the various reasons why project cost estimation is often done poorly.
6. Apply both top-down and bottom-up budgeting procedures for cost management.
7. Understand the uses of activity-based budgeting and time-phased budgets for cost estimation
and control.
8. Recognize the appropriateness of applying contingency funds for cost estimation.
PROJECT MANAGEMENT BODY OF KNOWLEDGE CORE CONCEPTS COVERED
IN THIS CHAPTER
1. Resource Planning (PMBoK sec. 7.1)
2. Cost Estimating (PMBoK sec. 7.2)
3. Cost Budgeting (PMBoK sec. 7.3)
4. Cost Control (PMBoK sec. 7.4)
PROJECT PROFILE
Case—Boston's Central Artery/Tunnel Project: Updated and Complete
Since the "Big Dig" project was first introduced in the previous edition of this textbook, a number of additional
events have occurred that make it important for us to revisit the original story and update the current status of this
monumental project. When Boston opened its Central Artery highway in 1959, it was hailed as a marvel of engineering and forward-thinking urban planning. Designed as an elevated six-lane highway through the middle of the city,
the highway was intended to carry a traffic volume of 75,000 vehicles a day. Unfortunately, by the early 1980s, the
Central Artery was burdened by a daily volume of more than 200,000 vehicles, a nearly threefold increase over the
anticipated maximum traffic levels. The result was some of the worst urban congestion in the country, with traffic
locked bumper to bumper for over 10 hours each day. At over four times the national average, the accident rate for
the Central Artery added to commuters' misery. Clearly, the Central Artery, a crumbling, overused, and increasingly
dangerous stretch of highway, had outlived its usefulness.
The solution to the problem was the advent of the Central Artery/Tunnel (CAIT) project, commonly known to
people from the Boston area as the "Big Dig." Under the supervision of the Massachusetts Turnpike Authority and
using federal and state funding, the CA/T project comprises two main elements: (1) replacing the aging elevated
roadway with an 8- to 10-lane underground expressway directly beneath the existing road, with a 14-lane,
two-bridge crossing of the Charles River, and (2) extending Interstate 90 through a tunnel beneath South Boston
and the harbor to Logan Airport. Originally conceived and initiated in the early 1980s, the project has been a
continuous activity (some would say "headache") in the city for over 20 years.
The technical challenges in the Big Dig have been enormous. Employing at its peak about 5,000 workers, the
project includes the construction of eight miles of highway, 161 lane miles in all, almost half below ground. It has
required the excavation of 16 million cubic yards of soil, enough to fill the New England Patriots' football stadium
16 times, and has used 3.8 million cubic yards of concrete. The second major challenge was to perform these activities without disrupting existing traffic patterns or having a deleterious effect on the current highway system and its
traffic flows. Thus, while miles of tunnels were being excavated underneath the old Central Artery, traffic volume
could not be slowed on the elevated highway.
The project has been a source of controversy for several years, most notably due to its soaring costs and
constantly revised budget. At the time of the project's kickoff in 1983, the original projections for the project's scope
assumed a completion date of 1998 and one-time funding from the federal government to cover 60% of the
Project Profile
249
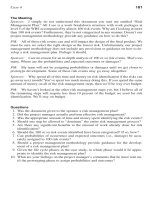
FIGURE 8.1 Boston's "Big Dig"
project's original $2.5 billion budget. In fact, the budget and schedule have been revised upward nearly constantly
since the project kicked off. Consider the following budget levels:
Year
Budget (in billions)
1983
2.56
1989
4.44
1992
6.44
1996
10.84
2000
14.08
2003
14.63
Final cost projections soared to over $14.5 billion and the project officially wrapped up in late 2004, or seven
years late. Cost estimates and subsequent expenditures were so bad that by 2000, a federal audit of the project
concluded that the Big Dig was officially bankrupt. One component of the federal audit concluded that a major
cause for runaway project costs was due to poor project management oversight. Specifically, it was found that
project management routinely failed to hold contractors to their bids or to penalize them for mistakes, resulting in
huge cost increases for the Big Dig. Because of the intense public scrutiny and sensitive nature of the project, managers also stopped tracking or publicly acknowledging escalating costs, fearing that the political backlash could
cripple the project. In fact, Taxpayers for Common Sense, a nonpartisan watchdog group, charged that the project's economics became so bad that managers delayed budgeting for contracts worth $260 million to a consulting
firm because they could not offset such a large cost in the short term. In response to public outcry over the delays
and rising costs, the project manager submitted his resignation.
Not surprisingly, the citizens of Boston have viewed the opening of the Big Dig with a genuine sense of
ambivalence. Though a technological marvel that will undoubtedly improve the lives of its users, while reducing
carbon monoxide emissions and improving the "green" reputation of the city, the project has proven to be such a
financial morass that public officials quietly canceled a planned celebration of a major section's opening. Finger
pointing and a search for the causes of the Big Dig's poor cost estimation and control have been vigorous. For its
part, the Massachusetts Turnpike Authority is planning a $150 million lawsuit against the firms that managed the
project, arguing that many of the cost overruns can be attributed to poor project management and oversight.
Increasingly, the question is being asked: were original cost estimates for the CANT given in good faith or
were they "tuned" to meet political realities. That is, did officials deliberately underestimate true project costs,
(continued)
250
Chapter 8 • Cost Estimation and Budgeting
fearing that the project would not have been approved in the beginning if the public was aware of its likely cost
and scope? If so, the result has been to leave a sour taste in the mouths of the taxpaying public, convinced that the
CANT project represents a combination of brilliant technical achievement coupled with poor estimation and lax
control. Former Massachusetts House Speaker Thomas Finnerman put the matter directly: "You'd be much, much
better off saying up front, factually, 'Hey, it's going to take umpteen years likely and umpteen billions dollars'
rather than selling it as a kind of smoke and mirrors thing about, 'Oh, it's two billion and a couple of years' work."
Aftermath: The Big Dig Four Years Later
Since the completion of the Big Dig, you would expect that the commotion had died down, the complaints had been
resolved, and the people of Boston were becoming used to the advantages of this enormous project. Unfortunately,
that has not been the case. Since its "completion" in early 2004, bad press, disasters, and accountability continue to
dog the Central Tunnel/Artery system.
In 2001, prior to the completion of the project, thousands of leaks began appearing in the ceiling of sections
of the tunnel system. The cause? Records suggest that the primary contractor for the concrete pouring, Modern
Continental, failed to remove debris prior to pouring concrete, resulting in flaws, cavities, and pockets of weakness
in the ceiling and walls of the tunnels. In May 2006, six employees of the main supplier of concrete were arrested
for falsifying records.
In fact, 2006 would be a very bad year for the Big Dig for a variety of reasons. On July 10, 2006, the bolt and
epoxy system holding four sections (12 tons) of concrete ceiling panels failed, causing a section to collapse onto the
tunnel roadway and killing a passenger in a car passing beneath the section at the time. That month, a detailed inspection of the ceiling panels throughout the tunnel system identified an additional 242 bolts that were already
showing signs of stress! The tunnel system was shut down for the month of August for inspection and repairs. Also
in August, the state assumed control of the Central Tunnel/Artery from the Turnpike Authority, citing the TA's poor
record of supervision and effective project control.
The tragedy became something close to farce when the Turnpike Authority and Federal Highway
Administration refused to release critical documents to the state, including:
•
•
•
Deficiency reports flagging initial substandard work
Construction change orders and contract revisions
Inspection reports on workmanship and building material quality
Until the court system orders the release of all project documents, we may never know the extent of mismanagement and poor decision making that have dogged the development of the CT/A. From a public relations perspective,
however, the fighting between state and federal authorities over oversight and control of the troubled project is
a continued black eye.
In early 2008, the contractors for the Big Dig, including primary contractors Bechtel and Parson Brinckerhoff,
were ordered to pay $450 million to settle the state's lawsuit over the 2006 tunnel collapse. Though this settlement
does not absolve the contractors from future lawsuits, it does settle some of the more egregious failures that
occurred while they led the project. U.S. Attorney Michael Sullivan, who led the lawsuit, noted that the contractors
had originally made a profit of about $150 million from the Big Dig; however, "They lost money as a result of the
failures that occurred under their watch." 1
8.1 COST MANAGEMENT
Cost management is extremely important for running successful projects. The management of costs, in many
ways, reflects the project organization's strategic goals, mission statement, and business plan. Cost management
has been defined to encompass data collection, cost accounting, and cost control,' and it involves taking
financial-report information and applying it to projects at finite levels of accountability in order to maintain a
clear sense of money management for the project. 3 Cost accounting and cost control serve as the chief mechanisms for identifying and maintaining control over project costs.
Cost estimation is a natural first step in determining whether or not a project is viable; that is, can the
project be done profitably? Cost estimation processes create a reasonable budget baseline for the project and
identify project resources (human and material) as well, creating a time-phased budget for their involvement
in the project. In this way, we can begin to see that cost estimation and project budgeting are linked hand in
hand: The estimate of costs for various components of the project are developed into a comprehensive project
budgeting document that allows for ongoing project tracking and cost control.
During the development stage of the proposal the project contractor begins cost estimation by identifying all possible costs associated with the project and building them into the initial proposal. While a simplified
8.1
Cost Management
251
model of cost estimation might only require a bottom-line final figure, most customers will wish to see a
higher level of detail in how the project was priced out, an itemization of all relevant costs. For example, a
builder could simply submit to a potential home buyer a price sheet that lists only the total cost of building the
house, but it is likely that the buyer will ask for some breakdown of the price to identify what costs will be
incurred where. Some of the more common sources of project costs include:
1. Labor—Labor costs are those associated with hiring and paying the various personnel involved in
developing the project. These costs can become complex, as a project requires the services of various
classifications of workers (skilled, semiskilled, laborers) over time. At a minimum, a project cost estimation must consider the personnel to be employed, salary and hourly rates, and any overhead issues such
as pension or health benefits. A preliminary estimate of workers' exposure to the project in terms of
hours committed is also needed for a reasonable initial estimate of personnel costs.
2. Materials—Materials costs apply to the specific equipment and supplies the project team will require in
order to complete project tasks. For building projects, materials costs are quite large and run the gamut
from wood, siding, insulation, and paint to shrubbery and paving. For many other projects, the actual
materials costs may be relatively small; for example, purchasing a software package that allows rapid compiling of computer code. Likewise, many projects in the service industries may involve little or no materials
costs whatsoever. Some materials costs can be charged against general company overhead; for example, the
use of the firm's mainframe computer may be charged to the project on an "as used" basis.
3. Subcontractors—When subcontractors provide resources (and in the case of consultants, expertise) for
the project, their costs must be factored into the preliminary cost estimate for the project and be reflected
in its budget. One subcontractor cost, for example, could be a charge to hire a marketing communications
professional to design the project's promotional material; another might be costs for an industrial
designer to create attractive product packaging.
4. Equipment and facilities—Projects may be developed away from the firm's home office, requiring
members of the project team to work "off site." Firms commonly include rental of equipment or office
facilities as a charge against the cost of the project. For example, oil companies routinely send four- or
five-person site teams to work at the headquarters of major subcontractors for extended periods. The
rental of any equipment or facility space becomes a cost against the project.
5. Travel—If necessary, expenses that are related to business travel (car rentals, airfare, hotels, and meals)
can be applied to the project as an up-front charge.
Another way to examine project costs is to investigate the nature of the costs themselves. Among the
various forms of project costs are those related to type (direct or indirect); frequency of occurrence (recurring
or nonrecurring); opportunity to be adjusted (fixed or variable); and schedule (normal or expedited). We will
examine each of these types of project costs in turn in this chapter.
Direct vs. Indirect Costs
Direct costs are those clearly assigned to the aspect of the project that generated the cost: Labor and materials
may be the best examples. All labor costs associated with the workers who actually built a house are considered
direct costs. Some labor costs, however, might not be viewed as direct costs for the project. For example, the
costs of support personnel, such as the project's cost accountant or other project management resources, may
not be allocated directly, particularly when their duties consist of servicing or overseeing multiple, simultaneous projects.
In a nonproject setting such as manufacturing, it is common for workers to be assigned to specific
machinery that operates on certain aspects of the fabrication or production process. In this case labor costs
are directly charged against work orders for specific parts or activities. The formula for determining total
direct labor costs for a project is straightforward:
(Direct labor rate) X (total labor hours) = Total direct labor costs
The direct costs of materials are likewise relatively easy to calculate, as long as there is a clear understanding
of what materials are necessary to complete the project. For example, the direct costs of building a bridge or
hosting a conference dinner for 300 guests can be estimated with fair accuracy. These costs can be applied
directly to the project in a systematic way; for example, all project purchase orders (POs) can be recorded
upon receipt of bills of materials or sales and applied to the project as a direct cost.
252
Chapter 8 Cost Estimation and Budgeting
Indirect costs, on the other hand, generally are linked to two features: overhead and selling and general
administration. Overhead costs are perhaps the most common form of indirect cost and can be one of the
more complex in estimating. Overhead costs include all sources of indirect materials, utilities, taxes, insurance,
property and repairs, depreciation on equipment, and health and retirement benefits for the labor force.
Common costs that fall into the selling and general administration category include advertising, shipping,
salaries, sales and secretarial support, sales commissions, and similar costs. Tracing and linking these costs to
projects is not nearly as straightforward as applying direct costs, and the procedures used vary by organization.
Some organizations charge a flat rate for all overhead costs, relative to the direct costs of the project. For example, some universities that conduct research projects for the federal government use a percentage multiplier to
add administrative and overhead indirect costs to the proposal. The most common range for such indirect
multiplier rates is from 20% to over 50% on top of direct costs. Other firms allocate indirect costs project by
project, based on individual analysis. Whichever approach is preferred, it is important to emphasize that all
project cost estimates include both direct and indirect cost allocations.
EXAMPLE 8.1
Developing Direct Labor Costs
Suppose that we are attempting to develop reasonable cost estimation for the use of a senior programmer for
a software project. The programmer is paid an annual salary of $75,000, which translates to an hourly rate of
approximately $37.50/hour. The programmer's involvement in the new project is expected to be 80 hours
over the project's life. Remember, however, that we also need to consider overhead charges. For example, the
company pays comprehensive health benefits and retirement, charges the use of plant and equipment against
the project, and so forth. In order to cover these indirect costs, the firm uses an overhead multiplier of 65%.
Employing an overhead multiplier is sometimes referred to as the fully loaded rate for direct labor costs. Thus,
the most accurate calculation of the programmer's charge against the project would look like this:
Hourly rate
($37.50)
Hours needed
X
Overhead charge
Total direct labor cost
(1.65)
$4,950
X
(80)
Some have argued that a more realistic estimate of total direct labor costs for each person assigned to the
project should reflect the fact that no one truly works a full 8-hour day as part of the job. An allowance for a
reasonable degree of personal time during the workday is simply recognition of the need to make personal
calls, have coffee breaks, walk the hallways to the restroom, and so forth. Meredith and Mantel (2003) argue
that if personal time were not included in the original total labor cost estimate, a multiplier of 1.12 should be
used to reflect this charge, increasing the direct labor cost of our senior programmer to: 4
Hourly rate
($37.50)
Hours
needed
X
(80)
Overhead
charge
X
(1.65)
X
Personal
Time
Total direct
labor cost
(1.12)
$5,544
One other point to consider regarding the use of overhead (indirect costs) involves the manner in which it
may be differentially applied across job categories. In some firms, for example, a distinction is made between
salaried and nonsalaried employees. Thus, two or more levels of overhead percentage may be used, depending
upon the category of personnel to which they are applied. Suppose that a company applied a lower overhead
rate (35%) to hourly workers, reflecting the lesser need for contributions to retirement or health insurance.
The calculated direct labor cost for these personnel (even assuming a charge for personal time) would resemble the following:
Hourly rate
($12.00)
Hours
needed
X
(80)
Overhead
charge
X
(1.35)
X
Personal
Time
Total direct
labor cost
(1.12)
$1,451.52
The decision to include personal time requires input from the project's client. Whichever approach is
taken, a preliminary total labor cost budget table can be constructed when the process is completed, as shown
in Table 8.1. This table assumes a small project with only five project team personnel, whose direct labor costs
are to be charged against it without a personal time charge included.
8.1 Cost Management
253
TABLE 8.1 Preliminary Cost Estimation for Direct Labor
Personnel
Salary
(Hourly)
Title
Hours
Needed
Overhead
Rate Applied
250
100
1.60
1.60
Total Direct
Labor Cost
$14,000
3,200
Linda
Alex
Lead Architect
Drafter—Junior
$35/hr
$20/hr
Jessica
Designer—Intern
$8.50/hr
80
1.30
884
Todd
Engineer—Senior
$27.50/hr
160
1.60
7,040
Thomas
Foreman
$18.50/hr
150
1.30
3,607.50
$28,731.50
Totals
Recurring vs. Nonrecurring Costs
also be examined in terms of the frequency with which they occur; they can be recurring or nonrecurring. Nonrecurring costs might be those associated with charges applied once at the beginning or end of
the project, such as preliminary marketing analysis, personnel training, or outplacement services. Recurring
costs are those that typically continue to operate over the project's life cycle. Most labor, material, logistics,
and sales costs are considered recurring because some budgetary charge is applied against them throughout
significant portions of the project development cycle. In budget management and cost estimation, it is necessary to highlight recurring vs. nonrecurring charges. As we will see, this becomes particularly important as we
begin to develop time-phased budgets—those budgets that apply the project's baseline schedule to projected
project expenditures.
Costs can
Fixed vs. Variable Costs
An alternative designation for applying project costs is to identify fixed and variable costs in the project budget.
Fixed costs, as their title suggests, do not vary with respect to their usage. 5 For example, when leasing capital
equipment or other project hardware, the leasing price is likely not to go up or down with the amount of usage
the equipment receives. Whether a machine is used for 5 hours or 50, the cost of its rental is the same. When
entering fixed rate contracts for equipment, a common decision point for managers is whether the equipment
will be used sufficiently to justify its cost. Variable costs are those that accelerate or increase through usage; that
is, the cost is in direct proportion to the usage level. Suppose, for example, we used an expensive piece of drilling
equipment for a mining operation. The equipment degrades significantly as a result of use in a particularly
difficult geographical location. In this case, the variable costs of the machinery are in direct proportion to its use.
It is common, in many cases, for projects to have a number of costs that are based on fixed rates and others that
are variable and subject to significant fluctuations either upward or downward.
Normal vs. Expedited Costs
Normal costs refer to those incurred in the routine process of working to complete the project according to the
www. d i lbert. co m
I'M TRYING SOMETHING NEW. IT'S
CALLED HONESTY.
OKAY.
STOP
DOING BRILLIANT
THAT. SUGGESTION.
. c 2007Scott A
EXPLAIN WHY YOU
CHARGE LESS OF YOUR
TIME TO PROJECTS
THAN ALL THE OTHER
ENGINEERS.
Inc. / D ist. by U FS, Inc.
original, planned schedule agreed to by all project stakeholders at the beginning of the project. Certainly, this
planned schedule may be very aggressive, involving extensive overtime charges in order to meet the accelerated
Source: DILBERT: © Scott Adams. Distributed by United Features Syndicate, Inc.
254
Chapter 8 • Cost Estimation and Budgeting
TABLE 8.2 Cost Classifications
Type
Costs
Direct Labor
Direct
Frequency
Indirect
Recurring
Adjustment
Nonrecurring
Fixed
Schedule
Variable
Normal
Expedited
X
Building Lease
X
Expedite Costs
X
Material
X
X
X
schedule; nevertheless, these costs are based on the baseline project plan. Expedited costs are unplanned costs
incurred when steps are taken to speed up the project's completion. For example, suppose the project has
fallen behind schedule and the decision is made to "crash" certain project activities in the hopes of regaining
lost time. Among the crashing costs could be expanded use of overtime, hiring additional temporary workers,
contracting with external resources or organizations for support, and incurring higher costs for transportation
or logistics in speeding up materials deliveries.
All of the above methods for classifying costs are linked together in Table 8.2. 6 Across the top rows are the
various classification schemes, based on cost type, frequency, adjustment, and schedule. The left-side column
indicates some examples of costs incurred in developing a project. Here we see how costs typically relate to multiple classification schemes; for example, direct labor is seen as a direct cost, which is also recurring, fixed, and
normal. A building lease, on the other hand, may be classified as an indirect (or overhead) cost, which is recurring,
fixed, and normal. In this way, we note that it is possible to apply most project costs to multiple classifications.
8.2 COST ESTIMATION
Estimating project costs is a challenging process that can resemble an art form as much as a science. Two
important project principles that can almost be called laws are at work in cost estimation. First, the more
clearly you define the project's various costs in the beginning, the less chance there is of making estimating
errors. Second, the more accurate your initial cost estimations, the greater the likelihood of preparing a project
budget that accurately reflects reality for the project and the greater your chances of completing the project
within budget estimates. One key for developing project cost estimates is to first recognize the need to cost out
the project on a disaggregated basis; that is, to break the project down by deliverable and work package as a
method for estimating task-level costs. For example, rather than attempt to create a cost estimate for completing a deliverable of four work packages, it is typically more accurate to first identify the costs for completing
each work package individually and then create a deliverable cost estimate, as Table 8.3 illustrates.
Companies use a number of methods to estimate project costs, ranging from the highly technical and
quantitative to the more qualitative approaches. Among the more common cost estimation methods are the
following:'
1. Ballpark estimates—Sometimes referred to as an order of magnitude estimate, the ballpark estimate is
typically used when either information or time is scarce. Companies often use them as preliminary
estimates for resource requirements or to determine if a competitive bid can be attempted for a project
contract. For example, a client may file an RFQ (request for quote) for competitive bids on a project,
TABLE 8.3 Disaggregating Project Activities to Create
Reasonable Cost Estimates
Project Activities
Estimated Cost
Deliverable 1040—Site Preparation
Work Package 1041—Surveying
Work Package 1042—Utility line installation
$ 3,000
15,000
Work Package 1043—Site clearing
8,000
Work Package 1044—Debris removal
3,500
Total cost for Deliverable 1040
$29,500
8.2 Cost Estimation
255
stating a very short deadline. Managers would have little time to make a completely accurate assessment
of the firm's qualifications or requirements, but they could still request ballpark estimates from their
personnel to determine if they should even attempt to bid the proposal through a more detailed analysis. The unofficial rule of thumb for ballpark estimates is to aim for an accuracy of ±30%. With such a
wide variance plus or minus, it should be clear that ballpark estimates are not intended to substitute for
more informed and detailed cost estimation.
2. Comparative estimates Comparative estimates are based on the assumption that historical data
can be used as a frame of reference for current estimates on similar projects. For example, Boeing
Corporation routinely employs a process known as parametric estimation, in which managers
develop detailed estimates of current projects by taking older work and inserting a multiplier to
account for the impact of inflation, labor and materials increases, and other reasonable direct costs.
This parametric estimate, when carefully performed, allows Boeing to create highly accurate
estimates when costing out the work and preparing detailed budgets for new aircraft development
projects. Even in cases where the technology is new or represents a significant upgrade over old technologies, it is often possible to gain valuable insight into the probable costs of development, based on
historical examples.
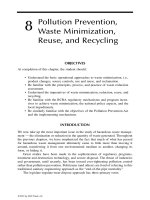
Boeing is not the only firm that has successfully employed parametric cost estimation. Figure 8.2
shows a data graph of the parametric estimation relating to development of the Concorde aircraft in
the 1960s. The Concorde represented such a unique and innovative airframe design that it was difficult
to estimate the amount of design time required to complete the schematics for the airplane. However,
using parametric estimation and based on experiences with other recently developed aircraft, a linear
relationship was discovered between the number of fully staffed weeks (Concorde referred to this time
—
Design mun\veeks 11) first s( rvice nhousni1( is) per passel liger
20
R.\ :-SNIAS Cot worde
10
8
(>
4
Boeing 747
Dot iglus DC-0
•
0.8
A
Boeing 707
0.0
0.4
0.2
Dough s D( 3
O. 1
0.0$
0.00
n
1
• Junkers in72/3
l'ok :er VII
A
0. 04
de I luvilland 1)1 1 4
0.02
().()1
1()
40 (30 80 100 200 400 (300 1000 2000
Cruising speed (k1s)
FIGURE 8.2 Parametric Estimate for Design Costs for Concorde
Note: Plot of design effort versus cruising speed for significant commercial aircraft types.
256
Chapter 8 • Cost Estimation and Budgeting
as "manweeks") needed to design the aircraft and its projected cruising speed. That is, the figure
demonstrates a direct relationship between the cruising speed of the aircraft and the amount of design
time necessary to complete the schematics. Using these values, it was possible to make a reasonably
accurate cost projection of the expected budget for design, demonstrating that in spite of significant
changes in airplane design over the past decades, the relationship between cruising speed and design
effort has held remarkably steady.
Effective comparative estimates depend upon some important supplementary sources including
a history of similar projects and a detailed archive of project data that includes the technical, budgetary,
and other cost information. Adjusting costs to account for inflation simply becomes a necessary step in
the process. The key to making comparative estimates meaningful lies in the comparability to previous
project work. It makes little sense to compare direct labor costs for two projects when the original was
done in a foreign country with different wage rates, overhead requirements, and so forth. While some
argue that comparative cost estimation cannot achieve a degree of accuracy closer than ± 15%, in other
circumstances, the estimate may be much more accurate and useful.
3. Feasibility estimates—These estimates are based as a guideline on real numbers, or figures derived
after the completion of the preliminary project design work. Following initial scope development, it
is possible to request quotes from suppliers and other subcontractors with a greater degree of confidence, particularly as it is common to engage in some general scheduling processes to begin to determine the working project baseline. Feasibility estimates are routinely used for construction projects,
where there are published materials cost tables that can give reasonably accurate cost estimates for a
wide range of project activities based on an estimate of the quantities involved. Because they are
developed further down the life cycle, feasibility estimates are often expressed in terms of a degree of
accuracy of +10%.
4. Definitive estimates—These estimates can be given only upon the completion of most design work, at
a point when the scope and capabilities of the project are quite well understood. At this point all major
purchase orders have been submitted based on known prices and availabilities, there is little or no wiggle room in the project's specifications, and the steps to project completion have been identified and a
comprehensive project plan is in place. Because it is understood that cost estimation should naturally
improve with time, as more information becomes available and fewer project unknowns are still unresolved, definitive estimates should accurately reflect the expected cost of the project, barring unforeseen
circumstances, at completion. Hence, definitive estimates can be expected to have an accuracy of ±5%.
We saw in previous chapters that some projects may offer very thin profit margins; for example, in the
case of fixed cost contracts, the project organization assumes almost all risk for completing the project
according to originally agreed contract terms. As a result, the better the job we do in estimating costs,
the more likely we will be to maintain the profit margin contracted.
Which cost estimation approach should a project organization employ? The answer to this question presupposes knowledge of the firm's industry (e.g., software development vs. construction), ability to account for and
manage most project cost variables, the history of successful project management a firm possesses, the number
of similar projects it has completed in the past, the knowledge and resourcefulness of project managers, and the
company's budgeting requirements. In some instances (for example, extremely innovative research and development projects), it may be impossible to create cost estimates with more than a ±20% degree of accuracy. On
the other hand, in events management projects (for example, managing a conference and banquet), it could be
reasonable to prepare definitive budgets quite early in the project. The key lies in a realistic appraisal of the type
of project one is undertaking, the speed with which various cost estimates must be created, and the comfort
level top management has with cost estimation error. If the information is available, it is reasonable to expect
the project team to provide as accurate a cost estimate as possible, as early in the project as possible. Figure 8.3
shows a sample project cost estimation form.
Learning Curves in Cost Estimation
Cost estimation, particularly for labor hours, often takes as its assumption a steady or uniform rate at which
work is done. In the case of having to perform multiple activities, the amount of time necessary to complete the
first activity is not significantly different from the time necessary to complete the nth activity. For example, in
software development, it may be considered standard practice to estimate each activity cost independently of
other, related activities with which the programmer is involved. Therefore, in the case of a programmer
8.2 Cost Estimation
257
ESTIMATE AND QUOTATION SHEET
Project No.
Description:
Type No.
Work Package No.
Task No.
Estimate No.
Task
Description
Work Package
Description
Internal Labor
Category
Rate
Hours
Cost
Senior Test Engineer
TE4
18.50
40
$740.00
Test Engineer
TE3
14.00
80
1120.00
399.00
225.00
Skill
Fitter
PF4
13.30
30
Drafter
DR2
15.00
15
Drawing Checker
DR3
16.50
3
Subtotal, Hours and Costs
168
Labor Contingency (10)%
17
Total Labor, Hours, and Costs
185
49.50
2533.50
254.00
2787.50
Overhead (80)%
2230.00
Gross Labor Cost
5017.50
Bought-Out Costs
20.00
Materials (Specify): Bolts plus cleating material
Finished Goods (Specify): N/A
12300.00
Services and Facilities: Hire test house;
Instrumentation plus Report
250.00
Subcontract Manufacture (Specify): Fixture and Bolt Modification
12570.00
Subtotal
1885.50
Contingency (15)%
14455.50
Total Bought-Out Costs
Expenses
340.00
Specify: On-site accommodation plus traveling
14795.50
Total Bought-Out Costs and Expenses
Profit (N/A)%
14795.50
Total Quoted Sum
Compiled by:
Date
Approved:
FIGURE 8.3 Sample Project Activity Cost Estimating Sheet
required to complete four work assignments, each involving similar but different coding activities, many cost
estimators will simply apply a direct, multiplicative rule of thumb estimate:
Number of times
activity is repeated
Cost of activity
($8,000)
X
(4)
Total cost estimate
$32,000
When we calculate that each actual coding sequence is likely to take approximately 40 hours of work, we
can create the more formal direct cost budget line for this resource. Assuming an overhead rate of .60 and a
cost per hour for the programmer's services of $35/hour, we can come up with a direct billing charge of:
Wage
($35/hr)
O.H. Rate
Units
X
(4 iterations)
X
(1.60)
X
Hours/Unit
(40 hours)
=
$8,960
While this rule of thumb is simple, it may also be simplistic. For example, is it reasonable to suppose that in
performing similar activities, the time necessary to do a coding routine the fourth time will take as long as it
258
Chapter 8 Cost Estimation and Budgeting
took to do it the first time? Is it more reasonable to suppose that the time needed (and hence, cost) of the
fourth iteration should be somewhat shorter than the earlier times? These questions go to the heart of a discussion of how learning curves affect project cost estimation. 8 In short, experience and common sense teach
us that repetition of activities often leads to reduction in the time necessary to complete the activity over
time. Some research, in fact, supports the idea that performance improves by a fixed percentage each time
production doubles. 9
Let us assume, for example, that the time necessary to code a particular software routine is estimated at
20 hours of work for the first iteration. Doing the coding work a second time requires only 15 hours. The
difference between the first and second iteration suggests a learning rate of .75 (15/20). We can now apply that
figure to estimates of cost for additional coding iterations. When output is doubled from the first two
routines to the required four, the time needed to complete the exercise is now estimated to take:
15 hrs. (.75) = 11.25 hours
These time and cost estimates follow a well-defined formula,' ° which is the time required to produce a
unit of output, and is represented as:
YX = aX1'
Where:
YX = the time required for the x unit of output
a = the time required for the initial unit of output
X = the number of units to be produced, and
b = the slope of the learning curve, represented as: log decimal learning rate/log 2
Assume the need to conduct a project cost estimation in the case of construction, where one resource
will be tasked to perform multiple iterations of a similar nature (for example, fitting, riveting, and squaring).
The worker must do a total of 15 of these activities. Also assume that the time estimated to perform the last
iteration (the steady state) is 1 hour, and we know from past experience the learning rate for this highly repetitive activity is .60. In calculating the time necessary to complete the first activity, we would apply the above
values to the formula to determine the value of a, the time needed to complete the task the first time:
b = log 0.60/log 2
= —0.2219/0.301
= —0.737
1 hr. = a (15) —°. " 7
a = 7.358 hours
Note that the difference between the first and fifteenth iteration of an activity represents a change in duration
estimation (and therefore, cost) from over 7 hours for the first time the task is performed to 1 hour for the
steady state. The difference in project cost estimates can be significant, particularly when a project involves
many instances of repetitive work or large "production runs" of similar activities.
EXAMPLE 8.2
Learning Curve Estimates
Let's return to the earlier example where we are trying to determine the true cost for the senior programmer's
time. Recall that the first, linear estimate, in which no allowance was made for the learning curve effect, was
found to be:
($35/hr) X (4 iterations) X (1.60) X (40 hours) = $8,960
Now we can apply some additional information to this cost estimate in the form of better knowledge of
learning-rate effects. Suppose, for example, that the programmer's learning rate for coding is found to be .90.
8.2 Cost Estimation
259
The steady state time to code the sequence is 40 hours. Our estimate of the time needed for the first
coding iteration is:
b = log 0.90/log 2
= —0.1054/0.693
= —0.1521
40 hrs. = a (4) —0.1521
a = 49.39 hours
Using this time calculated for the initial unit, we can determine the appropriate time multiplier for this
programming example by consulting tables of time multipliers. Find the multiplier by identifying the value that
matches 3 units of production (coding sequences) with a learning rate of .90. We use the value 3 because we
assume that by the fourth iteration, the programmer has reached the steady state time of 40 hours. Based on
a = 1, the learning curve coefficient, unit time, is 3 -0.1521 = .846, and the multiplier, total time, is 1 + 2-0.1521
0.90, +0.846 = 2.746. Therefore, the time needed to code the first three sequences is:
Time required for
initial unit
Multiplier
(2.746)
X
49.39
Total time to program
first three sequences
135.62 hrs.
=
Because the steady state time of 40 hours occurs for the final coding iteration, total coding time required for
all four sequences is given as:
135.62 + 40 = 175.62
The more accurate direct labor cost for the coding activities is:
Wage
($35/hr)
Overhead Rate
(1.60)
X
X
Total Hours
(175.62 hours)
$9,834.72
Compare this figure to the original value of $8,960 we had calculated the first time, which understated the programming cost by $874.72. The second figure, which includes an allowance for learning curve effects, represents
a more realistic estimate of the time and cost required for the programmer to complete the project activities.
In some industries it is actually possible to chart the cost of repetitive activities to accurately adjust
cost estimation for learning curves. Note the curve relating time (or cost) against activity repetition shown
in Figure 8.4. 11 The learning curve effect here shows savings in time as a function of the sheer repetition of
activities found in many projects. Some operations management books offer tables that show the total
50
40
C 30
C.7
20
*E-4
10
0
0
20
40
60
80
100
Repetition
FIGURE 8.4
Unit Learning Curve Log-Linear Model
Source: J. P. Amor and C. J. Teplitz. 1998. "An Efficient Approximation for Project Composite Learning Curves," Project
Management Journal, 29(3), pp. 28-42, figure on page 36.
Copyright © 1998 by Project Management Institute Publications.
Reproduced with permission of Project Management Institute
Publications via Copyright Clearance Center.
Note: Graph on arithmetic coordinates.
260
Chapter 8 • Cost Estimation and Budgeting
time multiplier, based on the learning rate values multiplied by the number of repetitive iterations of an
activity.' 2 Using these multipliers, the savings in revising cost estimates downward to account for learning
curve effects can be significant. However, there is one important caveat: Learning curve effects may occur
differentially across projects; projects with redundant work may allow for the use of learning curve multipliers while other projects with more varied work will not. Likewise, it may be more likely to see learning
curve effects apply in greater proportion to projects in some industries (say, for example, construction)
than in others (such as research and development). Ultimately, project budgets must be adjusted for activities in which learning curve effects are likely to occur and these effects must be factored into activity cost
estimates.
Increasingly, project contracts are coming to reflect the impact of learning curves for repetitive operations. For example, in the automotive industry, the manufacturer of hydraulic cylinders may be given a contract for the first year to provide cylinders at a price of $24 each. Each year after, the cost of the cylinder sold
to the automobile maker is priced at $1 less per year, under the assumption that learning curves will allow
the cylinder manufacturer to produce the product at a steadily lower cost. Thus, learning curves are factored
into the value of long-term contracts. 1 3
Problems with Cost Estimation
In spite of project management's best efforts, a variety of issues affect the ability to conduct reasonable and
accurate project cost estimates. Highly innovative projects can be notoriously difficult to estimate in terms of
costs. Surprisingly, however, even projects that are traditionally viewed as highly structured, such as construction projects, can be susceptible to ruinously expensive cost overruns. Among the more common reasons for
cost overruns are: 11
1. Low initial estimates—Caused by misperception of the scope of the project to be undertaken, low initial
estimates are a double-edged sword. In proposing the low estimates at the start of a project, management
is often setting themselves up to fail to live up to the budget constraints they have imposed. Hence, low
estimates, which may be created either willingly (in the belief that top management will not fund a project that is too expensive) or unwillingly (through simple error or neglect) almost always guarantee the
result of cost overrun. Part of the reason why initial estimates may be low can be the failure to consider
the project in relation to other organizational activities. If we simply cost-out various project activities
without considering the other surrounding organizational activities, we can be led to assume the project
team member is capable of performing the activity in an unrealistic amount of time. (See Chapter 1 1 on
critical chain project scheduling.)
Low estimates may also be the result of a corporate culture that rewards underestimation. For
example, in some organizations, it is widely understood that cost overruns will not derail a project
manager's career nearly as quickly as technical flaws. Therefore, it is common for project managers to
drastically underestimate project costs in order to get their project funded, continually apply for
supplemental funding as the project continues, and eventually turn in a product with huge cost overruns. Political considerations also can cause project teams or top management to view a project
through rose-colored glasses, minimizing initial cost estimates, particularly if they run contrary to
hoped-for results. The recently completed Denver International Airport represents a good example of
a community ignoring warning signs of overly optimistic cost estimates in the interest of completing
the project. The resulting cost overruns have been enormous.
2. Unexpected technical difficulties—A common problem with estimating the cost associated with many
project activities is to assume that technical problems will be minimal; that is, the cost estimate is often
the case of seeming to suggest that "All other things being equal, this task should cost $XX." Of course,
all other things are rarely equal. An estimate, in order to be meaningful, must take a hard look at the
potential for technical problems, start-up delays, or other technical risks. It is a fact that new technologies, innovative procedures, and engineering advances are routinely accompanied by failures of design,
testing, and anticipation. Sometimes the impact of these difficulties is the loss of significant 111011CV;
other times the losses are more tragic, resulting in the loss of life. The Boeing V 22 Osprey transport
aircraft, for example, employs a radical "tilt-rotor" technology that was developed for use by the U.S.
Marines and Navy. Prototype testing identified design flaws, contributing to the deaths of test pilots in
early models of these aircraft.
3. Lack of definition—The result of poor initial scope development is often the creation of projects with
poorly defined features, goals, or even purpose (see Chapter 5 on scope management). This lack of a
-
8.2 Cost
Estimation
261
BOX 8.1
PROJECT MANAGEMENT RESEARCH IN BRIEF
Software Cost Estimation
The software project industry has developed a notorious reputation when it comes to project performance.
Research by the Standish Group 15 suggests that for large companies, less than 9% of IT projects are completed on schedule and at budget. Over 50% of these projects will cost 189% of their original budget, while
the average schedule overrun is 202%. Clearly, from both cost and schedule estimation perspectives, the
industry is frustrated by unrealistic expectations. In spite of recent developments in software development
cost, schedule, and effort estimation, using Constructive Cost Estimating models (COCOMO II), required by
several branches of the federal government when bidding software contracts, our ability to accurately predict
software project costs remains a serious concern. 16
A recent book by Steven McConnell, president of Construx Software, 17 sheds light on some of the key
reasons why software projects suffer from such a poor track record. Among his findings is the common failure
to budget adequate time and funding for project activities that are likely to vary dramatically, depending upon
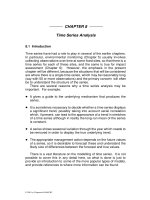
the size of the project. He distinguished among six software project activities: (1) architecture, (2) detailed
design, (3) coding and debugging, (4) developer testing, (5) integration, and (6) system testing. McConnell
determined that for small IT projects of 2,000 lines of code or less, 80% of the project work consisted of just
three activities: detailed design, coding and debugging, and unit testing (see Figure 8.5). However, as the
complexity of the software projects increased, the proportion of these activities to the overall project cost
dropped dramatically. Projects of over 128,000 lines of code required significantly more attention to be paid to
the other three activities: architecture, integration, and system testing (about 60% of total effort).
The implications of this research suggest that IT project budgets must consider the size of the project as
they calculate the costs of each component (work package). Larger projects resulting in hundreds of thousands
of lines of code require that a higher proportion of the budget be allocated to software design and testing,
relative to the actual cost of construction (design, coding, and unit testing).
Sy s tern tasting
I ntegration
Unit testing
Percentage of
Development
Time
Coding and debugging
Construction _ — —
_——
Detailed design
Arcliitectiire
0%
2K
8K
32K
128K
512K
Project Size in Lines of Code
FIGURE 8.5
Software Project Development Activities as a Function of Size
Source: From Code Complete, 2d Ed (Microsoft Press, 2004), by Steve McConnell. Used with
permission of the author.
clear view of the project can quickly spill over into poorly realized cost estimates and inevitable cost
overruns. It is important to recognize that the process of cost estimation and project budgeting must
follow a comprehensive scope statement and work breakdown structure. When the first steps are done
poorly, they effectively render futile any attempt at reasonable estimation of project costs.
4. Specification changes—One of the banes of project management cost estimation and control is the
midcourse specifications changes (sometimes referred to as "scope creep") that many projects are so
prone to. Information technology projects, for example, are often riddled with requests for additional
features, serious modifications, and updated processes; all while the project's activities are still in
development. In the face of serious changes to scope or project specification, it is no wonder that many
262
Chapter 8 Cost Estimation and Budgeting
projects routinely overrun their initial cost estimates. In fact, with many firms, initial cost estimates
may be essentially meaningless, particularly when the company has a well-earned reputation for
making midcourse adjustments to scope.
5. External factors—Inflation and other economic impacts can cause a project to overrun its estimates,
many times seriously. For example, in the face of an unexpected worldwide shortage of a raw material
or financial crisis, cost estimates that were made without these concerns are quickly moot. Ford Motor
Company's misadventure with stockpiling excessive quantities of palladium resulted in a $1 billion
write-off against profits for the 2001 fiscal year. t8 Ford's assumption had been that supplies of palladium, used in catalytic converters to remove pollutants from engine exhaust, were in danger of being
embargoed by Russia, the chief source of the metal. As a result, Ford purchased several years' supply of
palladium only to see its own engineers achieve a technical breakthrough in catalytic converters that
allowed for significantly less palladium to be used. The subsequent plunge in the price of palladium
wiped out Ford's profits for the year and was a factor in its decision to lay off 35,000 employees, 'about
10% of its entire workforce. Other common external effects can occur in the case of political considerations shaping the course that a project is expected to follow. This phenomenon is often found in
government projects, particularly military acquisition contracts, which have a history of cost overruns,
governmental intervention in the form of oversight committees, multiple constituents, and numerous
midcourse change requests.
PROJECT PROFILE
Heathrow Airport's Terminal Five Development
It took 18 years to create, 20,000 workers to build, and £4.3 billion ($8.5 billion), but in March 2008 Heathrow
Airport's Terminal Five (or T5, as it is known) was finally completed, and it celebrated its opening in grand style.
The building, designed by the Richard Rogers Partnership, is "one of the most breathtaking man-made spaces in
modern Britain," according to a prominent London architecture critic, Jonathan Glancey. Other judgments have
rated the building "drop-dead gorgeous" and one of the most ambitious structures created in England in the past
half-century (see Figure 8.6).
Heathrow Airport, located west of London, has ranked among the busiest in the world for many years. The
constant stream of millions of travelers passing through the halls and doorways has taken a tremendous toll on its
infrastructure. For years, passengers have complained about the dirty conditions, long queues waiting to check in
and pass through security, chronic delays, long trips on buses to airplanes, and seeming miles of corridors and
passageways they must use while moving from terminal to terminal. In short, travel through Heathrow was an
experience to be endured, not enjoyed.
11;
'
° ;11 4'14. II! Ilia :
FIGURE 8.6 Heathrow Airport's Terminal Five
ii,art
1-1°1:1111;
8.3 Creating a Project Budget
263
To address this crescendo of complaints, British Airways, one of the principal users of the Heathrow hub, had
approached the government for permission to begin planning a major expansion at the airport in the early 1990s.
After a nearly four-year project proposal review process, British Airways and the government announced plans in
2001 to begin development of a state-of-the-art passenger terminal. Designed for exclusive use by British Airways,
T5 was one of the most ambitious and complex construction projects undertaken in England in the past decade.
The expansion involved the collaboration of more than 60 contractors on 16 major projects and 147 subprojects.
Among the projects that all had to be coordinated were: (a) a terminal building so large that 50 soccer fields could
fit under the roof, (b) an automated people mover using a track transit system, (c) railroad and metro expansion
from London to connect to the terminal, (d) 150 retail shops, including 25 restaurants, and (e) automated baggage
handling systems with over 10 miles of suitcase-moving belts designed to handle up to 70,000 bags each day.
What has been perhaps as impressive as the actual construction of T5 was the design process that the terminal's
contractors went through to ensure they were creating a structure of maximum appeal to the traveling public. British
Airway's commercial director, Robert Foley, noted that a major effort was made to give the airline's customers a voice
in the development of T5, stating, "Our customers told us what they wanted, and we listened. We started with
a blank sheet of paper." The result is a structure that combines dramatic aesthetic qualities with a commitment to
solving problems that were decades in the making and is positioning Heathrow to remain among the busiest airports
in the world while making the traveling experience a bit more bearable for their customers. 19
8.3 CREATING A PROJECT BUDGET
The process of developing a project budget is an interesting mix of estimation, analysis, intuition, and
repetitive work. The central goal of a budget is the need to support rather than conflict with the project's
and the organization's goals. The project budget is a plan that identifies the allocated resources, the project's goals, and the schedule that allows an organization to achieve those goals. Effective budgeting always
seeks to integrate corporate-level goals with department-specific objectives; short-term requirements with
long-term plans; and broader, strategic missions with concise, needs-based issues. Useful budgets evolve
through intensive communication with all concerned parties and are compiled from multiple data sources.
Perhaps most importantly, the project budget and project schedule must be created in tandem; the budget
effectively determines whether or not project milestones can be achieved.
As one of the cornerstones of project planning, the project budget must be coordinated with project
activities defined in the Work Breakdown Structure (see Chapter 5). As Figure 8.7 suggests, the WBS sets the
stage for creating the project schedule; the project budget subsequently assigns the necessary resources to
support that schedule.
A number of important issues go into the creation of the project budget, including the process by which
the project team and the organization gather data for cost estimates, budget projections, cash flow income
and expenses, and expected revenue streams. The methods for data gathering and allocation can vary widely
across organizations; some project firms rely on the straight, linear allocation of income and expenses, without allowing for time, while others use more sophisticated systems. The ways in which cost data are collected
and interpreted mainly depend upon whether the firm employs a top-down vs. bottom-up budgeting procedure. The approaches involve radically different methods for collecting relevant project budget information
and can potentially lead to very different results.
Top Down Budgeting
-
Top-down budgeting requires the direct input from the organization's top management; in essence, this
approach seeks to first ascertain the opinions and experiences of top management regarding estimated project
costs. The assumption is that senior management is experienced with past projects and is in a position to
WBS
Project
Plan
FIGURE 8.7 The Relationship among
WBS, Scheduling, and Budgeting
S ch edu ling
Budgeting
264
Chapter 8 Cost Estimation and Budgeting
provide accurate feedback and estimates of costs for future project ventures. They take the first stab at estimating both the overall costs of a project and its major work packages. These projections are then passed down the
hierarchy to the next functional department levels where additional, more specific information is collected. At
each step down the hierarchy, the project is broken into more detailed pieces, until project personnel who
actually will be performing the work ultimately provide input on specific costs on a task-by-task basis.
This approach can create a certain amount of friction within the organization, both between top and
lower levels and also between lower level managers competing for budget money. When top management
establishes an overall budget at the start, they are, in essence, driving a stake into the ground and saying, "This
is all we are willing to spend." As a result, all successive levels of the budgeting process must make their estimates fit within the context of the overall budget that was established at the outset. This process naturally
leads to jockeying among different functions as they seek to divide up the budget pie in what has become a
zero-sum game—the more budget money engineering receives, the less there is for procurement to use.
On the positive side, research suggests that top management estimates of project costs are often quite
accurate, at least in the aggregate. 2° Using this figure as a basis for drilling down to assign costs to work packages and individual tasks brings an important sense of budgetary discipline and cost control. For example, a
building contractor about to enter a contract to develop a convention center is often knowledgeable enough
to judge the construction costs with reasonable accuracy, given sufficient information about the building's
features, its location, and any known building impediments or worksite constraints. All subcontractors and
project team members must then develop their own budgets based on the overall, top-down contract.
Bottom Up Budgeting
-
Bottom-up budgeting takes a completely different approach than that pursued by top-down methods. The
bottom-up budgeting approach begins inductively from the work breakdown structure to apply direct and
indirect costs to project activities. The sum of the total costs associated with each activity are then aggregated,
first to the work package level, then at the deliverable level, at which point all task budgets are combined,
and then higher up the chain where the sum of the work package budgets are aggregated to create the overall
project budget.
In this budgeting approach, each project manager is required to prepare a project budget that identifies
project activities and specifies funds requested to support these tasks. Using these first-level budget requests,
functional managers develop their own carefully documented budgets, taking into consideration both the
requirements of the firms' projects and their own departmental needs. This information is finally passed
along to top managers, who merge and streamline to eliminate overlap or double counting. They are then
responsible for creating the final master budget for the organization.
Bottom-up budgeting emphasizes the need to create detailed project plans, particularly Work
Breakdown Structures, as a first step for budget allocations. It also facilitates coordination between the project managers and functional department heads and, because it emphasizes the unique creation of budgets for
each project, it allows top managers a clear view for prioritization among projects competing for resources.
On the other hand, a disadvantage of bottom-up budgeting is that it reduces top management's control of the
budget process to one of oversight, rather than direct initiation, which may lead to significant differences
between their strategic concerns and the operational-level activities in the organization. Also, the fine-tuning
that often accompanies bottom-up budgeting can be time-consuming as top managers make adjustments
and lower-level managers resubmit their numbers until an acceptable budget is achieved.
Activity Based Costing
-
Most project budgets use some form of activity-based costing. Activity-based costing (ABC) is a budgeting
method that assigns costs first to activities and then to the projects based on each project's use of resources.
Remember that project activities are any discrete task that the project team undertakes to make or deliver the
project. Activity-based costing is, therefore, based on the notion that projects consume activities and activities
consume resources. 21
Activity-based costing consists of four steps:
1. Identify the activities that consume resources and assign costs to them, as is done in a bottom-up
budgeting process.
2. Identify the cost drivers associated with the activity. Resources, in the form of project personnel, and
materials are key cost drivers.
8.3 Creating a Project Budget
265
3. Compute a cost rate per cost driver unit or transaction. Labor, for example, is commonly simply the
cost of labor per hour, given as:
Cost rate/unit
$cost/hour
>
4. Assign costs to projects by multiplying the cost driver rate times the volume of cost driver units consumed by the project. For example, assume the cost of a senior software programmer is $40/hour and
that she is to work on the project for a total of 80 hours. The cost to the project would be:
$40/hr X 80 hours = $3,200.00
As we discussed earlier in this chapter, there are numerous sources of project costs (cost drivers) applying
both to direct project costs and indirect costs. Activity-based costing, a technique employed within most
project budgets, requires the early identification of these variables in order to create a meaningful control
document.
Table 8.4 demonstrates part of a project budget. The purpose of the preliminary budget is to identify
the direct costs and those that apply to overhead expenses. It is sometimes necessary to further break down
overhead costs to account for separate budget lines. The overhead figure of $500 for Survey, for example, may
include expenses covering health insurance, retirement contributions, and other forms of overhead, which
would be broken out in a more detailed project budget.
Table 8.5 shows a budget in which the total planned expenses given in Table 8.4 are compared against
actual accrued project expenses. With periodic updating, this budget can be used for variance reporting to
show differences, both positive and negative, between the baseline budget assigned to each activity and the
actual cost of completing those tasks. This method offers a central location for the tabulation of all relevant
project cost data and allows for the preliminary development of variance reports. On the other hand, this type
of budget is a static budget document that does not reflect the project schedule and the fact that activities are
phased in following the network's sequencing.
TABLE 8.4 Sample Project Budget
Budget
Activity
Direct Costs
Overhead
Total Cost
4,000
Survey
3,500
500
Design
7,000
1,000
8,000
4,000
Clear Site
3,500
500
Foundation
6,750
750
7,500
Framing
8,000
2,000
10,000
Plumb and Wire
3,750
1,250
5,000
TABLE 8.5 Sample Budget Tracking Planned and Actual Activity Costs
Budget
Variance
Planned
Actual
Survey
4,000
4,250
250
Design
8,000
8,000
-0-
Clear Site
4,000
3,500
(500)
7,500
8,500
1,000
10,000
11,250
1,250
5,000
5,150
150
38,500
40,650
2,150
Activity
Foundation
Framing
Plumb and Wire
Total
266
Chapter 8
Cost Estimation and Budgeting
TABLE 8.6 Example of a Time-Phased Budget
Months
Activity
January
February
March
Design
5,000
3,000
Clear Site
4,000
Survey
April
May
4,000
Total by
Activity
4,000
Foundation
8,000
4,000
7,500
7,500
Framing
8,000
2,000
10,000
Plumb and Wire
1,000
4,000
5,000
Monthly Planned
4,000
9,000
10,500
9,000
6,000
Cumulative
4,000
13,000
23,500
32,500
38,500
38,500
Table 8.6 shows a sample from a time-phased budget, in which the total budget for each project activity
is disaggregated across the schedule when its work is planned. The time-phased budget allocates costs across
both project activities and the anticipated time in which the budget is to be expended. It allows the project
team to match its schedule baseline with a budget baseline, identifying milestones for both schedule performance and project expense. As we will see in Chapter 13, the creation of a time-phased budget works in tandem
with more sophisticated project control techniques, such as earned value management.
We can produce a tracking chart that illustrates the expected budget expenditures for this project by
plotting the cumulative budgeted cost of the project against the baseline schedule. Figure 8.8 is a simple
graphic of the plot and is another method for identifying the project baseline for schedule and budget over
the anticipated life of the project.
8.4 DEVELOPING BUDGET CONTINGENCIES
Budget contingencies symbolize the recognition that project cost estimates are just that: estimates. Unforeseen
events often conspire to render initial project budgets inaccurate, or even useless. (Suppose a construction
project that had budgeted a fixed amount for digging a building's foundation accidentally discovered serious
subsidence problems or groundwater.) Even in circumstances in which project unknowns are kept to a minimum, there is simply no such thing as a project developed with the luxury of full knowledge of events.
A budget contingency is the allocation of extra funds to cover these uncertainties and improve the chances
that the project can be completed within the time frame originally specified. Contingency money is typically
added to the project's budget following the identification of all project costs; that is, the project budget does not
include contingency as part of the activity-based costing process. Rather, the contingency is calculated as an
extra cushion on top of the calculated cost of the project.
Cumulative Budgeted Cost
(in thousands)
40
35
30
25
20
10
Jan.
Feb.
Mar.
Apr.
FIGURE 8.8 Cumulative Budgeted Cost of the Project
May
8.4 Developing Budget Contingencies
267
There are several reasons why it may make good sense to include contingency funding in project cost
estimates. Many of these reasons point to the underlying uncertainty that accompanies most project cost
estimation:22
Many projects aim at moving targets; that is, the project scope
may seem well articulated and locked in. However, as the project moves through its development cycle,
external events or environmental changes can often force us to modify or upgrade a project's goals. For
example, suppose that our organization set out to develop an electronics product for the commercial
music market only to discover, halfway through the development, that technological advances had
rendered our original product obsolete. One option, other than abandoning the project, might be to
engineer a product design upgrade midstream in the project's development. Those scope changes will
cause potentially expensive cost readjustments.
2. Murphy's Law is always present. Murphy's Law suggests that if something can go wrong, it often will.
Budget contingency represents one important method for anticipating the likelihood of problems
occurring during the project life cycle. Thus, contingency planning just makes prudent sense.
3. Cost estimation must anticipate interaction costs. It is common to budget project activities as independent operations. Thus, in a product development project, we develop a discrete budget for each work
package under product design, engineering, machining, and so forth. However, this approach fails to recognize the often "interactive" nature of these activities. For example, suppose that the engineering phase
requires a series of iterative cycles to occur between the designers and the engineers. As a series of designs
are created, they are forwarded to the engineering section for proofing and quality assessment. When
problems are encountered they must be shipped back to design to be corrected. Coordinating the several cycles of design and rework as a product moves through these two phases is often not accounted for in
a standard project budget. Hence, contingency budgets allow for the likely rework cycles that link project
activities interactively.
4. Normal conditions are rarely encountered. Project cost estimates usually anticipate "normal conditions." However, many projects are conducted under anything but normal working conditions. Some of
the ways in which the normal conditions assumption is routinely violated include the availability of
resources and the nature of environmental effects. Cost estimators assume that resources required for
the project will be available when needed; however, personnel may be missing, raw materials may be of
poor quality, promised funding may not materialize, and so forth. When resources are missing or limited, the activities that depend upon their availability are often delayed, leading to extra costs. Likewise,
the geography and environmental effects on some projects demonstrate the difficulty in creating a
"normal" project situation. For example, a project manager was assigned to develop a power plant in
the West Bengal province of India only to discover, upon arrival, that the project was set to begin at the
same time that the annual torrential monsoon rains were due to arrive! His first project activity, after
reaching the construction site, was to spend three weeks erecting a five-foot retaining wall and coffer
dam around the site to ensure it would not flood. Of course, the cost of this necessary construction had
not been factored into his initial budget.
1. Project scope is subject to changes.
While project teams naturally favor contingencies as a buffer for project cost control, their acceptance by
project stakeholders, particularly clients, is less assured. Some clients may feel that they are being asked to cover
poor budget control on the part of the project firm. Other clients object to what seems an arbitrary process for
calculating contingency. For example, it is common in the building industry to apply a contingency rate of
10-15% to any structure prior to architectural design. As a result, a building budgeted for $10 million would be
designed to cost $9 million. The additional million dollars is held in escrow as contingency against unforeseen
difficulties during the construction and is not applied to the operating budget. Finally, does the contingency
fund apply equally across all project work packages or should it be held in reserve to support critical activities
as needed? Where or across what project activities contingency funds should be applied is the final point of
contention. Despite these drawbacks, there are several benefits to the use of contingency funding for projects,
including:
1. It recognizes that the future contains unknowns, and the problems that do arise are likely to have a
direct effect on the project budget. In providing contingency, the project allows for the negative effects
of both time and money variance.
2. Provision is made in the company plans for an increase in project cost. Contingency has sometimes
been called the first project fire alarm. Allowing contingency funds to be applied to a project is a
preliminary step in gaining approval for budget increases, should they become necessary.
268 Chapter 8 Cost Estimation and Budgeting
3. Application to the contingency fund gives an early warning signal of a potential overdrawn budget. In
the event of such signals, the organization's top management needs to take a serious look at the project
and the reasons for its budget variance, and begin formulating fallback plans should the contingency
prove to be insufficient to cover the project overspend. It is often the case, for example, in large defenseindustry contracts, for project organizations facing budget overruns to first apply any contingency
money they possess to the project before approaching the governmental agency for additional funding.
An Army project contract manager will understandably demand full accounting of project expenditures, including contingency, before considering additional funding.
Project cost estimation and budgeting are two important components of project control. Because a significant constraint on any project is its budget, the manner in which we estimate project costs and create realistic
budgets is critical to effective project planning. Further, the best defense against overrunning our budgets is to
prepare project cost estimates as carefully as possible. Although we cannot possibly anticipate every eventuality, the more care that is used in initial estimation, the greater the likelihood that we can create a budget that
is a reasonably accurate reflection of the true project cost. Cost estimation challenges us to develop reasonable
assumptions and expectations for project costs through clearly articulating the manner in which we arrive at
our estimates. Budgeting is the best method for applying project expenditures systematically, with an eye
toward keeping project costs in line with initial estimates. Taken together, cost estimation and budgeting
require every project manager to become comfortable with not only the technical challenges of the project,
but its monetary constraints as well.
Summary
I. Understand the various types of common project
costs. Project budgeting comprises two distinct
elements: cost estimation and the budgeting process
itself. Among the well-known expenses in most projects are:
1. Cost of labor—the charge against the human
resources needed to complete the project.
2. Cost of materials—costs relating to any specific equipment or supplies needed for project development.
3. Cost of equipment and facilities—the costs of any
plant and equipment, either at the project's location
or off-site.
4. Subcontractors—charges against the project budget
for the use of consultants or other subcontracted work.
5. Travel—a sometimes necessary charge for the
expense of having project team members in the field
or at other sites.
2. Recognize the difference between various forms of
project costs.There are a number of ways to identify
the types of costs that a project can incur. For example,
among the more common types of costs are:
• Direct vs. indirect—Direct costs are those that can
be directly assigned to specific project activities performed to create the project. Indirect costs relate to
general company overhead expenses or administration. For example, overhead expenses charged to a
project may include health benefits or retirement
contributions. General administration includes shipping costs, secretarial or computer support, sales
commissions, and so on.
• Recurring vs. nonrecurring—Recurring costs are
ongoing expenses, such as labor or material costs. They
appear across the project's life cycle. Nonrecurring
costs are typically one-time expenses related to some
special expense or purchase, such as training or
purchase of a building.
• Fixed vs. variable—Fixed costs do not vary with
respect to their usage. Variable costs generally increase
in proportion to the degree they are used.
• Normal vs. expedited—Normal costs imply the normally scheduled costs of the project, set in relation to
the schedule baseline. Expedited costs are sometimes
referred to as "crashed costs" and increase due to the
extra resources assigned to speed the completion of a
specific project activity.
3. Apply common forms of cost estimation for project
work, including ballpark estimates and definitive
estimates. Cost estimating may follow one of several
approaches, usually of increasing accuracy as the estimate more closely coincides with the completion of
project design work. Preliminary estimates for task
completion, sometimes called "ballpark estimates,"
may be accurate only to ±30%. On the other hand, as
the project gets closer to the completion of the design
phase, it is more realistic to expect more accurate,
definitive estimates (±5%). One method for cost estimation is through the use of parametric techniques,
which compare current project activities to the cost of
past, similar activities and then assign a multiplier that
considers inflation or other additional cost increases.
Key Terms
4. Understand the advantages of parametric cost estimation and the application of learning curve models
in cost estimation. Parametric cost estimation allows
project managers to develop detailed estimates of current project costs by taking older work and inserting a
multiplier to account for the impact of inflation, labor
and materials increases, and other reasonable direct
costs. Parametric estimation allows project managers to
begin to formulate cost estimates from a position of
past historical record, which can be very helpful in
complex projects for which it is difficult to formulate
reasonable estimates.
One element in project cost estimation that cannot be ignored is the effect of learning rates on an individual's ability to perform a project task. Learning curve
effects typically are only relevant in cases where a project
team member is required to perform multiple iterations
of a task. When these situations occur, it is usually easier
and faster to complete the nth iteration than it was to
complete the first, due to the effect of learning on repetitive activities. Using available formulas, we can readjust
cost estimates for some project activities to reflect the
cost of learning an activity.
5. Discern the various reasons why project cost estimation is often done poorly. There are several reasons
why cost estimation may be poorly done, including:
1. Low initial estimates—These are caused by poor
knowledge of the project's scope or due to an organizational atmosphere that rewards low initial estimates
and does not sanction subsequent cost or schedule
overruns.
2. Unexpected technical difficulties—This is a common
problem for many projects when technical performance is cutting-edge and unexpected problems emerge.
3. Lack of definition—Poorly specified projects usually
lead to poorly budgeted and controlled projects.
4. Specification changes—The continuing distraction
of specification change requests can quickly lead to
cost overruns.
5. External factors—The uncontrollable effects of
inflation or economic or political interference in a
project can render initial cost estimates invalid.
6. Apply both top-down and bottom-up budgeting procedures for cost management. Project budgeting
involves the process of taking the individual activity
cost estimates and creating a working document for
planned project expenditures. Two approaches to
budgeting involve the use of top-down and bottom-up
efforts to better identify costs and allocate project
budget money. Using activity-based budgeting techniques, project teams typically identify the activities
that consume resources and assign costs to them.
Second, they determine the cost drivers associated with
the activities (usually human resources and materials
costs), and third, a cost rate per cost driver is then computed. Activity-based budgeting allows for the creation
of project budgets with specific budget lines for each
task necessary to complete the project.
7. Understand the uses of activity-based budgeting and
time-phased budgets for cost estimation and control.
Taking activity-based budgeting one step further, we
can create time-phased budgets when the specific activity costs are then allocated across the project schedule
baseline to reflect the points on the project timeline
when the budget will be consumed. Using a timephased budget approach allows the project team to link
time and cost into a unified baseline that can be set to
serve as the project plan. Project cost control, as the
project moves forward, is predicated on creating the
time-phased budget.
8. Recognize the appropriateness of applying contingency funds for cost estimation. In some projects,
it is necessary, for a variety of reasons, to set aside a
certain amount of the project budget into an account
to handle any uncertainties or unexpected events that
could not have been anticipated in the initial cost estimation and budgeting sequence. This account is
referred to as a project contingency fund and in many
types of projects, particularly in construction projects, it is a normal part of the project budget.
Contingency is not assigned to any specific project
activities; rather, it is used as a general project-level
emergency fund to handle the costs associated with
problems, should any arise.
Key Terms
Activity-based costing
(ABC) (p. 264)
Ballpark estimates (p. 254)
Bottom-up budgeting (p. 264)
Budget contingency (p. 266)
Comparative
estimates (p. 255)
Cost estimation (p. 250)
Crashing (p. 254)
Definitive estimates (p. 256)
Direct costs (p. 251)
Expedited costs (p. 254)
Feasibility estimates (p. 256)
Fixed costs (p. 253)
269
Indirect costs (p. 252)
Learning curve (p. 258)
Nonrecurring
costs (p. 253)
Normal costs (p. 253)
Parametric
estimation (p. 255)
Project budget (p. 263)
Recurring costs (p. 253)
Time-phased
budget (p. 266)
Top-down
budgeting (p. 263)
Variable costs (p. 253)
270
Chapter 8 • Cost Estimation and Budgeting
Solved Problems
1. Calculating Direct Labor Costs Calculate the direct cost of
labor for the project team using the following data. What are
the costs for the individual project team members? What is the
overall direct cost of labor?
Hours
Needed
Overhead
Charge
Personal
Time
Rate
John
40
1.80
1.12
$21/hr
Bill
40
1.80
1.12
$40/hr
J.P.
60
1.35
1.05
$10/hr
Sonny
25
1.80
1.12
$32/hr
Name
Hourly
Rate
Total
Direct
Labor
Cost
2. Calculating Budget Estimates Using the Learning Curve
Assume you have a software project that will require the coding
services of a senior programmer to complete 14 coding
sequences that are relatively similar. We know that the programmer's learning rate is .90 and that the first coding
sequence is likely to take her 15 hours to complete. Using the
learning curve formula, calculate the steady state rate to code
these sequences.
SOLUTION
Recall that the formula for calculating the learning curve rate, in
which a time is required to produce a unit of output, is represented as:
Total Direct Labor Cost =
Y., = aX
Where:
SOLUTION
Yx = the time required for the x unit of output
a= the time required for the initial unit of output
We use the formula for calculating direct costs, given as:
Hourly rate X Hours needed X Overhead charge X
X= the number of units to be produced, and
b= the slope of the learning curve, represented as:
log decimal learning rate/log 2
Personal time = Total direct labor cost
Applying each rate given above in turn, we fill in the direct cost table
as follows:
Personal
Hours Overhead
Time
Hourly
Name Needed
Charge
Rate
Rate
= -0.04576/0.301
Total
Direct
Labor
Cost
John
40
1.80
1.12
$21/hr
$1,693.44
Bill
40
1.80
1.12
$40/hr
3,225.60
J.P.
60
1.35
1.05
$10/hr
850.50
Sonny
25
1.80
1.12
$32/hr
Total Direct Labor Cost =
b= log 0.90/log 2
= -0.1521
Yx = 15 (14) " 521
Y=10.4hours
1,612.80
$7,382.34
Discussion Questions
1. Describe an environment in which it would be common to bid
for contracts with low profit margins. What does this environment suggest about the competition levels?
2. How has the global economy affected the importance of cost
estimation and cost control for many project organizations?
3. Why is cost estimation such an important component of project planning? Discuss how it links together with the Work
Breakdown Structure and the project schedule.
4. Imagine you are developing a software package for your company's intranet. Give examples of the various types of costs
(labor, materials, equipment and facilities, subcontractors, etc.)
and how they would apply to your project.
5. Give reasons for using different overhead multipliers for different categories of employees when creating a cost estimate for a
project activity.
6. Think of an example of parametric estimating in your personal
experience, such as the use of a cost multiplier based on a similar,
7.
8.
9.
10.
11.
past cost. Did parametric estimating work or not? Discuss the
reasons why.
Consider the common problems with project cost estimation
and recall a project with which you have been involved. Which of
these common problems did you encounter most often? Why?
Put yourself in the position of a project customer. Would you
insist on the cost adjustments associated with learning curve
effects or not? Under what circumstances would learning curve
costs be appropriately budgeted into a project?
Would you prefer the use of bottom-up or top-down budgeting
for project cost control? What are the advantages and disadvantages associated with each approach?
Why do project teams create time-phased budgets? What are
their principal strengths?
Project contingency can be applied to projects for a variety of
reasons. List three of the key reasons why a project organization
should consider the application of budget contingency.
Problems
271
Problems
1.
expect to pay for the fifth unit? The simplified formula for
calculating learning rate time is given as:
Calculate the direct cost of labor for a project team member
using the following data:
Hourly rate:
Hours needed:
Overhead rate:
$35/hr
110
39%
TN- TIC
Where
TN
2. Calculate the direct cost of labor for the project team using
the following data. What are the costs for the individual
project team members? What is the overall direct cost of
labor?
Hours Overhead
Name Needed Charge
Sandy
Chuck
Bob
Penny
40
100
80
65
1.35
Personal
Time
Rate
1.12
1.80
1.35
1.80
5. Problem 4 identified how long it should take to complete the
fifth oil-drilling platform that Natural Resources plans to
purchase. How long should all five oil-drilling rigs take to
complete?
6. Suppose that you are assigning costs to a major project to be
undertaken this year by your firm, DynoSoft Applications. One
particular coding process involves many labor hours, but highly redundant work. You anticipate a total of 200,000 labor
hours to complete the first iteration of the coding and a learning curve rate of 70%. You are attempting to estimate the cost
of the twentieth iteration of this coding sequence. Based on the
above information and at a $60 per hour labor rate, what
would you expect to budget as the cost of the twentieth iteration? The fortieth iteration?
7. Assume you are a project cost engineer calculating the cost of a
repetitive activity for your project. There are a total of 20 iterations of this activity required for the project. The project activity
takes 2.5 hours at its steady state rate and the learning rate is
75%. Calculate the initial output time for the first unit produced,
using the learning curve formula:
$17/hr
$31/hr
- 0 -
$9/hr
$34/hr
1.12
C = Learning curve coefficient
Total
Direct
Hourly Labor
Cost
Rate
1.12
= Time needed to produce the nth unit
Ti = Time needed to produce the first unit
Total Direct Labor Cost =
3. Assume that overhead is charged on a flat rate basis. Each member of the project is assigned an overhead charge of $200/week.
What would the direct cost of labor be for an employee, given
that she is assigned to the project for 160 hours at $8.50/hour?
For problems 4 through 7, please refer to the chart of
learning curve coefficients, unit times, and multipliers below.
4. It took MegaTech, Inc. 100,000 labor-hours to produce the first
of several oil drilling rigs for Antarctic exploration. Your company, Natural Resources, Inc., has agreed to purchase the fifth
oil-drilling rig from MegaTech's manufacturing yard. Assume
that MegaTech experiences a learning rate of 80%. At a labor
rate of $35 per hour, what should you, as the purchasing agent,
5
85%
80%
Unit
Time
Total
Time
Unit
Time
Total
Time
Unit
Time
Total
Time
Unit
Time
Total
Time
.437
3.195
.513
385
.325
.288
.263
.244
.229
.216
3.459
.596
3.738
.686
4.031
6.315
.583
7.116
10
.306
4.932
15
.248
6.274
20
.214
7.407
25
.191
8.404
30
.174
9.305
35
.160
10.133
40
.150
10.902
Based on a = 1.
Yx the time required for the x unit of output
a = the time required for the initial unit of output
X = the number of units to be produced, and
b ------ the slope of the learning curve, represented as:
log decimal learning rate/log 2
75%
70%
Unit
Rate
Where:
5.589
477
7.319
.418
8.511
.530
9.861
8.828
.381
10.485
.495
12.402
10.191
.355
12.309
.470
14.801
17.091
11.446
.335
14.020
.450
12.618
.318
15.643
.434
19.294
13.723
.305
17.193
.421
21.425