The effects of greenwaste biochar on phosphorus availability in acid soils
Bạn đang xem bản rút gọn của tài liệu. Xem và tải ngay bản đầy đủ của tài liệu tại đây (294.87 KB, 55 trang )
The work in this project was undertaken in partial fulfilment of the requirements of the
University of Melbourne for the degree of Master of Environment. The views expressed are
those of the author and might not reflect the views of the University of Melbourne, Office for
Environmental Programs.
Content
Figure
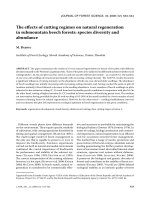
Figure 1. The chemical fraction procedure of Hedley et al (1992) ............................................7
Figure 2. pH values in Poowong Low soil .................................................................................9
Figure 3. pH values in Poowong High soil ................................................................................9
Figure 4. The liming value of biochar on Poowong Low soil .................................................10
Figure 5. The liming value of biochar on Poowong High soil .................................................10
Figure 6. P fractions in Poowong Low and Poowong High soils (% and mg/kg) ....................11
Figure 7. H2O-P values in Poowong Low soil .........................................................................12
Figure 8. H2O-P values in Poowong High soil .........................................................................12
Figure 9. Change in CHCl3/NaHCO3-P in Poowong Low soil ................................................13
Figure 10. Change in CHCl3/NaHCO3-P in Poowong High soil ..............................................14
Figure 11. Non-labile P and residue P in Poowong Low soil ..................................................18
Figure 12. Non-labile P and residue P in Poowong High soil ........................................18Table
Table 1. Treatments in the experiment .......................................................................................6
Table 2. Characteristics of soils and biochar ..............................................................................7
Table 3. Labile P after 45 days incubation, mg P kg-1...............................................................16
Environmental research project – ENST 90007
Table 4. Total Pi and Po ........ 19The effects of greenwaste biochar on phosphorus
availability in acid soils
Abstract
Soil samples from Poowong with two levels of P were incubated at 25 oC in short term in order to
determine the effects of biochar on phosphorus availability and changes in P fractions. Among the
treatment investigated, three were biochar addition at three levels of 10, 30 and 50 tonne ha -1, one was
inorganic P with KH2PO4 as reference, three were NaOH addition at three levels (1, 3 and 6 mmol
NaOH per 200 g soil) and the control. Soil samples after 45 days incubated were sequential
fractionation analysed for inorganic and organic P followed Hedley method, which included H 2O-P,
CHCl3/NaHCO3-P, NaOH-P, HCl-P and finally residue P. The results proved biochar could be used as
soil amendments since it improved significantly (at p = 0.05) pH value, improved significantly labile P
in low phosphorus acid soil and reduced significantly water soluble P in high phosphorus acid soil. In
addition, biochar could also improve microbial activity. The results suggested that improving pH by
adding NaOH in high P soil led to the negative effect on P availability due to it had no P amendment
but increased water soluble P.
1. Introduction
Agriculture has been considered as a source of greenhouse gases emissions contributing to
climate change. Emissions through land-use change and emissions from food production are
the main causes of that. However, the emissions from agricultural land, in fact, could
potentially be mitigated or even reserved to store carbon in agricultural land(Sohi et al.,
2010). Soils contain large amount of carbon in both inorganic and organic forms(Sanderman
et al., 2010). The soil carbon sequestration has the potential to be the carbon sink for
greenhouse gases with multi-benefits to profitability and farm productivity (Sanderman et al.,
2010, Lal, 2004). One means of potentially permanent carbon sequestration is through the
conversion of biomass to charcoal and addition to soil(Sohi et al., 2009). This process has
been enhanced through the production of “biochar”, a form of charcoal produced by thermal
decomposition of organic matter under limited supply of oxygen (Sohi et al., 2009, Lehmann
and Joseph, 2009). The carbon in biochar could hold the carbon in soil for thousands of years
(IBI, 2011). Depending on the means of production and storage this system could be carbon
negative.
The application of biochar to agricultural soils has the potential to improve soil chemical,
physical and biological conditions. With high surface area,variable-charge organic material
and high porosity, biochar has potential to increasecation exchange capacity (CEC), soil
water-holding capacity, surface sorption capacity (Glaser et al., 2002, Keech et al., 2005,
Liang et al., 2006, Chan et al., 2007a, Chan et al., 2007b, Sohi et al., 2010).Most research on
pyrolysis of biomass has focussed on energy and fuel quality rather than on biochar as soil
2
Thi Kim Phuong Nguyen – 376329
Environmental research project – ENST 90007
amendment (Chan and Xu, 2009). Data to date has suggested a wide range of outcomes about
the impacts of biochar on soil amendment. Thus, the application of biochar has proved a
positive, neutral and even negative effect (Grob et al., 2011). The wide range of outcomes
could be due to the differences in biochar used, time scale, tested crop species and soil
properties. Moreover, in terms of enhance soil nutrients studies, most of them have focused on
the enhance nitrogen availability in soils, while lacking study on the effect of biochar on
phosphorus availability in soil, specially the interactions of biochar and available P in soils.
The combination of high concentrations of Al and Fe along with low pH present difficulties
for the productive use of acid soils. Particularly, the present of Fe in acid soils leads to
available P deficiency due to the chemical adsorption to iron oxides (Hedley et al., 1994,
Linquist et al., 1997). To compensate for this available P deficiency, previous study suggested
that large applications of inorganic P should be required(Kamprath, 1967). However, when the
inorganic P is reduced, the effects of the supply as well as available P in soils are reduced
(Dobermann et al., 2002). The application of organic substances could provide many benefits
such as saving inorganic fertilisersas organic fertiliser could provide variable nutrients,
reducing environmental pollution caused by organic matters by transferring organic waste to
organic fertiliser. Especially, organic fertiliser application on acid soils could reduce many
difficulties of acid soils such as improve CEC, improve SOC, reduce Al and Fe toxicity as
well as improve available P(Guppy et al., 2005, Thúy and viễn, 2008, Viễn et al., 2006). The
improvement of P availability due to applying organic matters shows in several ways. Guppy
et al. (2005) illustrated that the competitive sorption of organic matter and P in soil would
release P soil solution. Furthermore, metal complexation and dissolution reactions could
release P for plant uptake(Guppy et al., 2005, Bolan et al., 1994, Maurice et al., 1995).
Depending on structure Biochar may have similar effects in soil.
This study aims to quantify the short term effect of greenwaste biochar on P availability in
soils through the chemical fractionation of P forms. This work has been conducted on an acid
pasture soilswith high and low concentrations of phosphorus – incubation study. KH 2PO4 was
included as a reference treatment, which was used to clarify effects of inorganic fertiliser
application on soils. As greenwaste biochar has a potentially liming capacity, NaOH
treatments were included to determine the affect of pH on P availability.
2. Materials and methods
Soils
Representative soils used in the study were collected from 0-10 cm depth from Poowong East
in Victoria, Australia. Two soil samples have high and low concentrations of phosphorus,
3
Thi Kim Phuong Nguyen – 376329
Environmental research project – ENST 90007
which were Poowong High (PH) and Poowong Low (PL), respectively.Soils are classified as
Brown Dermosol (Isbell, 2003). Brown Dermosol soils are characterised by a gradual change
in texture with depth down the soil profile (DPI, 2011). The Brown Dermosol soils used in the
study are strongly acid, which pH values are 4.4 and 5.3. As most Brown Dermosol soils in
the higher rainfall areas in Victoria, these soils used in the experiment have chemical
problems such as strong acidity, fertility and iron and aluminium toxicity, which can cause
available P efficiency. Land has been long history used for pasture
The soil samples were kept at field-moisture condition and removed all roots and earthworms
as well as large plant materials. Soils were incubated at 25 oC for 45 days and subjected to
sequential fractionation for phosphorus. Three levels of biochar were applied, which were 10,
30 and 50 tonne ha-1 soil. Levels of biochar applied were based on biochar levels of previous
studies (Chan et al., 2007b, Chan and Xu, 2009), particularly International Biochar Initiative
recommends the best rate is from 5 to 50 tonne per ha (IBI, 2010). Inorganic P added to soil
was KH2PO4 solution (15kg Pha-1). Three levels of NaOH were selected by adding 1, 3 and
6mmol NaOH per 200g dry soil to increase soil pH in in the reference treatments.These
treatments are shown in the table 1 below.
Table 1. Treatments in the experiment
Soil
Treatments
Soil with low concentration of P
Control (soil)
Biochar 10 tonne ha-1
Biochar 30 tonne ha-1
Biochar 50 tonne ha-1
Inorganic P 15kg P ha-1
Soil + NaOH level 1
Soil + NaOH level 2
Soil + NaOH level 3
Soil with high concentration of P
Control (soil)
Biochar 10 tonne ha-1
Biochar 30 tonne ha-1
Biochar 50 tonne ha-1
Inorganic P 15kg P ha-1
Soil + NaOH level 1
Soil + NaOH level 2
Soil + NaOH level 3
Biochar
Biochar was supplied from Pacific Pyrolysis which contains 85 percent from green waste and
15 percent from biosolid.
The characteristics of biochar and soils are described in the table 2 below.
Table 2. Characteristics of soils and biochar
pHH2O
Biochar
EC,
mS/cm
7.9
Olsen P,
mgkg-1
Cowell P
Total C:N
CEC,
mgkg-1
P, %
cmolkg-1
335
0.24
61
1.98
0.4
4
Thi Kim Phuong Nguyen – 376329
Environmental research project – ENST 90007
PL
PH
4.4
5.1
9.34
200
0.06
0.34
Sequential fractionation for inorganic and organic P
P forms were extracted by Hedley method (Hedley et al., 1982) by using different extracted
solutions to extract P forms in the order to analyse H 2O-P, CHCl3/NaHCO3-Pi,
CHCl3/NaHCO3-Po; NaOH-Pi, NaOH-Po; HCl-Pi and residue P. The procedure used to
sequential fractionation P in soils is described in the figure 1 below.
Add 30 ml H2O, shake 16 hours, centrifuge and filter supernatant
H2O-P
Soil
Add 1 ml CHCl3, shake in 1 hour, open cap to evaporate CHCl3
Soil
Add 30 ml NaHCO3, shake 16 hours, centrifuge and filter supernatant
CHCl3/NaHCO3-P
Add 30 ml NaOH, shake 16 hours, centrifuge and filter supernatant
NaOH-P
Soil
Add 30 ml HCl, shake 16 hours, centrifuge and filter supernatant
HCl-P
Digest
with 5 ml condensed H2SO4 and H2O2, filter
Soil
Residue
Soil
Figure 1. The chemical fraction procedure of Hedley et al (1992)
First, soil samples were extracted with H 2O to determine water soluble Pi (inorganic P).Soil
samples were treated with CHCl3to remove large amount of microbial P then extracted with
0.5 M NaHCO3 pH 8.5. The CHCl3/NaHCO3 extraction extracted microbial P, Pi and Po
(organic P) compounds.The soil samples were followed by 0.1 M NaOH extraction step to
extract Pi and Po held at the internal surfaces of soil aggregates, which mostly are iron-P
(Kuo, 1996). The acid extraction (1M HCl) removed apatite-type minerals and occluded P in
more weathered soils, mostly is Ca-P. Finally, soil samples were digested by condensed H 2SO4
with H2O2to determine relatively insoluble Pi and more chemically stable Po.Base on several
experiments, the amount of water soluble Po and HCL-Po is negligible(Viễn et al., 2006,
Hedley et al., 1982), so these forms of P were not determined.
The extraction solution was measured Pi (A). The extraction solution was taken from 5 to 10
ml of into the digestion tubeand then added 1 ml 11 N H 2SO4 and 0.4 g potassium persulfate
and heated at the temperature of 150 oC until the solution stops boiling. Cooledsolution, added
5
Thi Kim Phuong Nguyen – 376329
Environmental research project – ENST 90007
H2O up to 30 ml and adjusted pH to 7 by adding NaOH and made up to 50 ml. Measured P in
the solution (B). Po = B – A.
pHH2O with the ratio of 1:5.Method 4A1(Rayment and Higginson, 1992).
CEC was analysed by using compulsive exchangemethod, method 15E1 (Rayment and
Higginson, 1992).
Total Pin biochar: biochar was digested by using H2SO4 and H2O2 and determined by
colourmetric method (Kuo, 1996).
Data analysis
Statistic analysis used in the study is ANOVA one way and compare means by LSD, using
Genstat as a statistical package.
3. Results and discussion
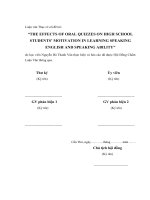
3.1. pH change
With the exception of inorganic treatment, all treatments increased pH relative to the
control(Figure 2 and 3). With the Poowong High soil, both applications of biochar and NaOH
increased pH value, which had significant higher pH values compared with the control. There
is no statistical difference between the pH values of two treatments of 50 and 30 tons biochar
ha-1. The 50 and 30t biochar.ha -1 treatments are statistically significantly higher than the 10t
biochar ha-1 treatment in terms of pH values. The trend is nearly similar with the Poowong
Low soil. In this type of soil, both biochar and NaOH have a large increase in pH value.
Interestingly, with the lower pH soil (Poowong Low), the application of inorganic P led to the
decrease in pH value while this was no effect in the higher pH soil (Figure 2 and 3).
Remark: the figure a, b and c are used to compare means between treatments, so that if two treatments have the same
figure that means these two treatments are not statistically different at p = 0.05.
Figure 2. pH values in Poowong Low soil
Figure 3. pH values in Poowong High soil
Biochar has a liming value as suggested by the high pH value of the char alone (pH 7.9, Table
2.). Biochar used in the study contains 15% biosolid char.That explains biochar could increase
the pH value of soils in the experiment. However, by applying 50 tonnes s biochar.ha -1, the pH
values can increase by 0.20 and 0.26 units in Poowong High and Poowong Low soils,
6
Thi Kim Phuong Nguyen – 376329
Environmental research project – ENST 90007
respectively. That proved that biochar can influence soil pH. Adding the amount of 6mmol
NaOH per 200 g soilincreased significantly the pH values. The Poowong High soil showed a
bigger increase, which the increase of 1.23 units compared with 1.03 units of the Poowong
Low soil. This illustrates that the pH buffer is different between two types of soil.
There is no doubt that biochar has a liming value and it seems to be linear.The liming value of
biochar compares to the liming value of NaOH treatments is presented in the figure 4 and 5.
Therefore, in the Poowong Low soil, applying 10t, 30t and 50t biochar ha -1 had the equal
liming value as 0.64, 0.97 and 1.19 mmol OH - per 200 g soil, respectively. In the Poowong
High soil, application of 10t biochar ha -1 had a lower liming value(equal to 0.34 mmol OH per 200g soil) while the 50t biochar ha -1 treatment had a higher liming value (equal to 1.52
mmol OH- per 200g soil) compared with that value in Poowong Low soil (Figure 4 and 5).
Figure 4. The liming value of biochar on Poowong Low soil
Figure 5. The liming value of biochar on Poowong High soil
3.2. Changes in P fractions
P fractions in soils used in the experiment
The results in the figure 6 show that inorganic P (H 2O-P, CHCl3/NaHCO3-Pi, NaOH-Pi and
HCl-Pi) was the domination forms of P in Poowong High soil (approximately 80% of total P)
while this form in Poowong Low soil was only around 35%. Of that total Pi in Poowong High
soil, the most significant dominant was NaOH-Pi, which was more than 40% of total P. It
means the Poowong High soil has potentially high level of Fe causing the bone Fe-P. In the
Poowong Low soil, total Pi (H2O-P, CHCl3/NaHCO3-Pi, NaOH-Pi and HCl-Pi) was nearly
equal total Po (CHCl3/NaHCO3-Po and NaOH-Po). The high proportion of Po in Poowong
Low soil indicates that microbial activity is negligible in this soil. Therefore, most phosphorus
is stored in organic forms (Figure 6).
Figure 6. P fractions in Poowong Low and Poowong High soils (% and mg/kg)
Water Soluble P
The effects of biochar on P fractions can be easily seen in the water solubleP form results. The
analysis results after 45 days incubation show that biochar improved the water soluble P in
low P soil (Poowong Low soil) and it appears as though there was a linear increase in H 2O-P
in low P soil while it decreased this P form in high P soil (Poowong High soil). Both inorganic
7
Thi Kim Phuong Nguyen – 376329
Environmental research project – ENST 90007
P and the NaOH treatments resulted in increasing water soluble P in two soils. Adding NaOH
proved the rise of 50 percent in water soluble P in both low and high P status soils compared
with the control. However, while adding 6 mmol NaOH per 200 g soil could increase only 1
mg P kg-1 in Poowong Low soil, this increase was approximately 40 mg P kg -1 in Poowong
High soil (Figure 7 and 8).
Figure 7. H2O-P values in Poowong Low soil
Figure 8. H2O-P values in Poowong High soil
The results for water soluble Pillustrate that biochar can improveavailable P through
increasing water soluble P in low phosphorus soil. This helps plants get more benefits from
soil having P deficiency. However, the high concentration of water soluble P could bring the
risk for water resources when plants cannot uptake all since water soluble P could easily runoff into the water resource. Therefore, the application of biochar can limit the P leaching
causing eutrophication for water resources by reducing water soluble P in high phosphorus
soils. This results are matched with DeLuca et al. (2009) study that biochar had a negative
influence on P solubility in calcareous soils and Al-rich soil. In the low P soil case, the
application of biochar resulted in increase water soluble P, but the increase was small (only 2
mg P kg-1). Consequently, the risk for water resources might be negligible.
The sorption capacity of biochar could be used to explain the difference in water-soluble P
changes in two soils. Biochar has its own an amount of water soluble P. Therefore, with low P
soil, water soluble P in biochar could contribute to water soluble P in soil. However, in high P
soil, the amount of water soluble P released from biochar cannot compensate the sorption
capacity. This led to the decrease in water soluble P in the biochar treatments (Figure 8).
Increase pH by adding NaOH led to significant increase in water soluble P in both high and
low phosphorus soils.This result agrees with the previous studies that increase in pH value
could result in increase in available P (Kuo, 1996, DeLuca et al., 2009). Water soluble P bring
with its potential risks for water resources as it can run off into water resources and causes
eutrophication. However, in Poowong Low soil, this increase was small (only around 2 mg P
kg-1). Therefore, the risk for water resources would be small as well. The Poowong High soil
8
Thi Kim Phuong Nguyen – 376329
Environmental research project – ENST 90007
has different situation when the highest level of NaOH increased water soluble P significantly
(by approximate 40 mg P kg-1). Consequently, the risk for water resources in the Poowong
High soil case would be more serious.
Labile P
The results show that increasing pH led to different outcomes in terms of labile P (extracted
by CHCl3/NaHCO3 after extracted by H2O) in two soils. In Poowong Low soil, both
treatments increased statistically amount of inorganic P (CHCl 3/NaHCO3-Pi) compared with
the control except the 10t biochar.ha-1treatment. The 50t biocharha-1treatment showed the most
significant increase compared with others, approximate 20 mgPkg -1higher than the control.
The 30t biocharha-1treatment showed the similar result with the 15kg Pha -1. Although higher
values were showed in three NaOH treatments, both three levels of NaOH application gave
the same CHCl3/NaHCO3-Pi value (Figure 9). The CHCl3/NaHCO3-Po results gave the nearly
similar trend compared with the CHCl3/NaHCO3-Pi results, but the NaOH treatments. While
added NaOH provided the higher CHCl3/NaHCO3-Pi, the NaOH treatments had lower values
of CHCl3/NaHCO3-Po compared with the control, except the NaOH level 1 treatment. The 50t
biocharha-1treatment again showed the highest value, statistically different compared with
others (Figure 9).
Figure 9. Change in CHCl3/NaHCO3-P in Poowong Low soil
The CHCl3/NaHCO3-Pi and CHCl3/NaHCO3-Po forms have a close relationship. While the
NaHCO3-Pi is a part of labile P for plant uptake, NaHCO 3-Po will be used by microbial
activity to release labile P for plant (Lehmann and Joseph, 2009, Kuo, 1996). NaHCO3-Po
could be called potential labile P. The application of biochar led to the increase in both labile
NaHCO3-P and potential labile NaHCO3-P and the amount of both those forms of P had a
positive correlation with the amount of biochar. This result shows that biochar has a similar
function that influences NaHCO3-P in acid soil as other organic substances such as compost
from sugarcane filter cake, vermicompost, pig manure and biogas slude (Viễn et al., 2006,
Thúy and viễn, 2008).Increase pH value by NaOH helped to transfer potential labile P to
labile form. As can be seen from the figure 8, NaHCO 3 labile P values of treatments added
NaOH were statistically higher than the control while NaHCO 3 potential labile values of these
treatments were statistically smaller compared with the control. The microbial activities could
be used to explain that.
In Poowong High soil, the trend differs from the Poowong Low soil’s trend in terms of
CHCl3/NaHCO3-P form. Except from the 50t biochar ha -1treatment, the biochar application
9
Thi Kim Phuong Nguyen – 376329
Environmental research project – ENST 90007
and inorganic supply did not have statistically different values of CHCl 3/NaHCO3-Pi with the
control. While they increased the amount of water soluble P, the NaOH treatments gave the
adverse results in CHCl3/NaHCO3-Pi with the decreasing trend when increasing concentration
of NaOH. The results in CHCl3/NaHCO3-Po had a similar trend with the water soluble P
results except the 50t biochar ha -1 treatment. While the biochar application tended to reduce
CHCl3/NaHCO3-Po, the more amount of NaOH resulted in the higher value of
CHCl3/NaHCO3-Po (Figure 10).
Figure 10. Change in CHCl3/NaHCO3-P in Poowong High soil
Surprisingly, although the total CHCl3/NaHCO3-P of the 50t biocharha-1 treatment gave the
similar result compared with other biochar treatments, the smaller amount of CHCl 3/NaHCO3Pi led to the higher amount of CHCl 3/NaHCO3-Po. Another reason can be used to explain why
biochar had bigger effects on CHCl3/NaHCO3-Pi in Poowong Low soil could be due to the
lower pH value of this soil. Brown Dermosol soil has difficulties with pH and some other
toxicants such as aluminium and iron. The present of alumium could limit the available P. The
lower pH value, the higher concentration of exchangeable aluminium is expected(Kuo, 1996).
The lower pH value of Poowong Low soil could result in higher concentration of
exchangeable Al. The sorption of chelates might have negative influence on available P
(Lehmann and Joseph, 2009). Biochar application then can increase significantly available P
in Al-rich soil(Lehmann and Joseph, 2009, Shen et al., 2001). Consequently, P could be
release from the Al-P link. While in the low phosphorus soil, NaOH had a positive effect on
improving microbial activity that transfers CHCl3/NaHCO3-Po to CHCl3/NaHCO3-Pi, the high
phosphorus soil gave a reverse trend by keeping more potential labile P. Moreover, in the
Poowong High soil, the increase amount of water soluble P when increasing the amount of
NaOH could result in the decrease amount of CHCl3/NaHCO3-Pi.
The overall change in labile P in two soils is presented in the table 3 below. The total labile P
could be the total H2O-P and CHCl3/NaHCO3-Pi (Lehmann and Joseph, 2009, Kuo, 1996).
Therefore, with Poowong Low soil, the incubation with biochar led to the significant increase
10
Thi Kim Phuong Nguyen – 376329
Environmental research project – ENST 90007
in labile P with the large increase. There was a positive correlation between the amount of
applied biochar and the labile P values (Table 3).This increase came from the change of P
fractions in soil as well as from labile P in biochar. The results show that in Poowong Low
soil, biochar increased labile P and this source is from the mineralisation P in soil. Compare to
the control, the 50t biochar.ha-1had the biggest increase (20.3 mg Pkg-1). These other biochar
treatments also increased labile P compared with the control and higher NaOH treatments. It
means that application of biochar would benefit for crop by improving labile P. in Poowong
High soil, there was little difference in labile P value between treatments.
Table 3. Labile P after 45 days incubation, mg Pkg-1
Poowong Low Soil
Expected P
34.4
36.9
41.7
46.4
46.9
34.4
34.4
34.4
Control
10t biochar
30t biochar
50t biochar
inorganic P
NaOH level 1
NaOH level 2
NaOH level 3
LSD
CV,%
After 45-day
∆P
incubation
34.4 e
37.7d
48.0 b
54.7 a
49.0 b
42.1 c
43.7 c
43.3 c
2.587
3.4
Compared with the control
(after incubation)
0.8 c
6.3 b
8.3 ab
2.1 c
7.7 ab
9.3 a
8.9 ab
2.665
24.5
3.3 d
13.6 b
20.3 a
14.6 b
7.7 c
9.3 c
8.9 c
2.665
14
Table 3. (continue)
Poowong High Soil
Expected
Control
10t biochar
30t biochar
50t biochar
inorganic P
NaOH level 1
NaOH level 2
NaOH level 3
LSD
CV,%
715
712
706
700
727
715
715
715
After 45-day
∆P
incubation
715 a
697 ab
700 ab
684 b
712 a
711 a
686 b
695 ab
19.7
77
Compared with the control
(after incubation)
-17.7 ab
-15.4 ab
-30.5 b
-3.4 a
-3.7 a
-28.5 b
-20.1 ab
18.26
1.5
-14.6 ab
-6.1 a
-15.3 ab
-15.4 ab
-3.2 a
-28.5 b
-20.1 ab
19.7
68
Remark: the figure a, b and c are used to compare means between treatments, so that if two treatments have the
same figure that means these two treatments are not statistically different at p = 0.05.
11
Thi Kim Phuong Nguyen – 376329
Environmental research project – ENST 90007
In Poowong High soil, the labile P values tended to decrease after 45 days incubation. The 50t
biocharha-1 treatment gave the highest decrease, by approximate 30 mg Pkg -1 after incubation.
Since the concentration of labile P in biochar is extremely smaller than that concentration in
Poowong High soil (335 mg Pkg -1 compared with 715 mg Pkg -1). Consequently, the more
application of biochar, the more diluted labile P in the soils. Although the experiment showed
that both treatments reduced labile P values compared to the control, those reductions were
not followed any trend and were negligible and these changes were just only around 2
percent.Those results explain the idea that in some cases, biochar have no effect on crop in
short term impacts(Steiner et al., 2007, Lehmann, 2007). However, in long term effects,
biochar could provide the opportunity to balance the microbial activity, especially enhance the
function of mycorrhizal fungi(Warnock et al., 2007, Ishii and Kadoya, 1994).
Non-labile P and residue P
Non-labile P includes the P forms extracted by NaOH and HCl. The results presented in figure
11 and 12 show that biochar application changed NaOH-Pi and HCL-Pi in Poowong Low soil
significantly, but this change was negligible in Poowong High soil. In Poowong Low soil, the
50t biocharha-1 treatment achieved the highest value of NaOH-Pi (around 40 mgPkg -1 higher
the control). The 30t biochar.ha-1 treatment and the inorganic P treatment ranked the next two
highest positions, which were approximate 25 and 10 mg Pkg -1, respectively. The NaOH
adding treatments showed no difference between treatments and compared with the control
interms of NaOH-Pi. The change in HCl-Pi form got the same trend with the NaOH-Pi.
Although NaOH-Po values were different between treatments, the difference was small
(Figure 11).
In Poowong High soil, there was negligible difference between treatments. Except the 30t
biochar.ha-1 treatment had a higher value of NaOH-Pi compared with the others, there was no
significant difference between treatments. The HCl-Pi fraction showed no significant
difference except the 30t biochar ha -1 treatment showed a slightly higher result than the others.
Similarly, the NaOH-Po fraction results presented no significant change between treatments.
The NaOH-Po values were separated into two groups, which the control, the 10t and 30t
biocharha-1 treatments in the higher group. The others were in the lower group (Figure 12).
The results in the Figure 11 and 12 show that residue P were around 200 mg Pkg-1 in Poowong
Low soil and 300 mg Pkg-1 in Poowong High soil. In Poowong Low soil, the 10t biochar.ha -1
treatment was not statistically different compared with the control and those two treatments
were the lowest treatments in residue P value. The other treatments were not significantly
12
Thi Kim Phuong Nguyen – 376329
Environmental research project – ENST 90007
difference. In the Poowong High soil, except the control showed a slightly lower, all
treatments got the similar residue P values (Figure 11 and 12).
Figure 11. Non-labile P and residue P in Poowong Low soil
Figure 12. Non-labile P and residue P in Poowong High soil
NaOH-P fraction is the iron-P form when extracted by NaOH. This P form is non-labile and
not available for plant uptake. High concentration of NaOH-Pi in Poowong High soil (around
1,400 mg P kg-1) ilustrated this soil might has high concentration of iron oxidesand this source
of iron would keep P in the Fe-P bone.Again, the organic form of NaOH-P was seen in low
value in Poowong High soil. High level of organic matter in this soil could benefit microbial
activities. Therefore, those microbial activities would help to transfer extractable NaOH-Po
into extractable NaOH-Pi.
By summing the extractable Pi fractions (H2O-P, CHCl3/NaHCO3-Pi, NaOH-Pi and HCl-Pi)
and Po fractions (CHCl3/NaHCO3-Po, NaOH-Po) it was shown that in the Poowong Low soil,
extractable Pi fractions in the 50 t biocharha-1treatment was higher than the control (325 mg
Pkg-1 compared with 217 mg Pkg-1) and was the highest values. The proportion of extractable
Pi fractions in this treatment also had the highest ranking, which was 43.4%. Although the
extractable Pi fractions in the 50t biocharha-1 ranked the highest proportion, the proportion of
extractable Po fractions in this treatment was smaller than others and got the lowest position.
The control treatment got the lowest values in both extractable Pi fractions and extractable Po
fractions (Table 4).
In the Poowong High soil, the trend was different with the trend in the Poowong Low soil.
Adding NaOH to increase pH led to the decrease in extractable Pi fractions in all NaOH
treatments, total Pi in these treatments got the lowest values, significantly different with
others. The 30t biocharha-1 treatment was the highest extractable Pi fractions, but no
significant difference compared with the 50t biocharha -1 treatment, the control and the
inorganic treatments. The extractable Po fraction had a reverse trend. While the 30t biocharha 13
Thi Kim Phuong Nguyen – 376329
Environmental research project – ENST 90007
1
treatment had the highest value of extractable Pi fractions, the extractable Po fractions in the
treatments was the lowest one compared with other treatments. Adding inorganic P also
resulted in low extractable Po fractions (Table 4).
Table 4. Total Pi and Po
Control
10t biochar
30t biochar
50t biochar
inorganic P
NaOH level 1
NaOH level 2
NaOH level 3
LSD
CV, %
Poowong Low soil
Total Pi, Total Pi, Total Po, Total
Residue P, Residue
mg/kg
%
mg/kg
Po, %
mg/kg
P, %
217 e
37.1
174 b
29.8
194
33.1
231 d
37.9
183 ab
29.9
197
32.3
276 b
39.0
206 a
29.2
225
31.8
325 a
43.4
195 ab
26.1
227
30.4
244 c
36.3
206 a
30.7
222
33.0
219 e
34.5
201 a
31.8
214
33.7
224 de
34.6
204 a
31.5
220
33.9
217 e
34.8
188 ab
30.1
219
35.2
8.316
25.17
12.06
2
7.5
3.2
Table 4. (continue)
Control
10t biochar
30t biochar
50t biochar
inorganic P
NaOH level 1
NaOH level 2
NaOH level 3
LSD
CV, %
Total Pi,
Total
mg/kg
Pi, %
2,807 abc
81.9
2,771 bc
82.0
2,891 a
84.7
2,824 ab
81.3
2,779 abc
82.7
2,693 c
82.1
2,738 bc
81.9
2,705 c
81.7
114.3
2.4
Poowong High soil
Total Po, Total Po, Residue Residue P,
mg/kg
%
P, mg/kg %
304 a
8.9
319
9.3
284 a
8.4
325
9.6
182 c
5.3
338
9.9
307 a
8.9
340
9.8
221 bc
6.6
360
10.7
266 a
8.1
323
9.8
263 ab
7.9
341
10.2
273 a
8.2
332
10.0
44.82
19.72
9.9
3.4
The results showed that biochar application increased the extractable Pi fractions in low
phosphorus soil. In addition, extractable Po fractions in this soil were also increased in the
biochar treatments. It can be explained due to the concentration of phosphorus in this soil is
low, therefore, the adding biochar is going with the adding P sources. That led to the increase
in phosphorus fractions. In high phosphorus soil, because the concentration of phosphorus in
this soil is high and even higher than the concentration of phosphorus in biochar, the
application of biochar had a negligible effect on total Pi and Po fractions. Adding NaOH led
to the decrease in total pi fractions in this soil. Although the Poowong High soil has far higher
14
Thi Kim Phuong Nguyen – 376329
Environmental research project – ENST 90007
value of total P compared with the Poowong Low soil, which were around 3,430 mgPkg -1 and
590 mgPkg-1, respectively (approximately 6 times higher), the residue P of two types of soil
were slightly different. That means the difference in P concentrations in soils would go to P
fractions.
4. Conclusion and recommendation
Poowong Low soil had a low concentration of phosphorus while that concentration in the
Poowong High soil was high. Due to different characteristics of soils, the effects of biochar
and adding NaOH on these soils were different.Biochar had liming value and resulted in
increase pH values in both soils. The application of biochar on Poowong Low soil increased
water soluble P with a linear trend. Labile P in Poowong Low soil was also significantly
increased by biochar application. Similarly, biochar had a positive effect on NaOH-P. The
biochar application increased significantly total Pi and slightly total Po in low phosphorus
soil. The addition of NaOH to increase soil pH led to the increase water soluble P and labile P.
Total Pi was not changed while total Po was slightly affectedwhen increasing pH by adding
NaOH.Inorganic P supplied by KH2PO4could increase labile P in Poowong Low soil but
reduced pH value.
In Poowong High soil, biochar application caused the decrease in water soluble P while
NaOH addition led to the increase in this P form. Although biochar reduced water soluble P, it
had no effect on labile P and little effect on NaOH-P, total Pi and total Po in high phosphorus
soil. Except the increase in water soluble P, adding NaOH to improve pHhad no influence on
labile P, total Piand total Po in Poowong High soil. Inorganic P supplied by KH 2PO4had no
effect on labile P but reduced pH value.
In low phosphorus acid soil as Poowong Low soil, the application of biochar helps increase
pH and improve labile P up to the rate in the experiment (50t biochar ha -1). Increase pH by
inorganic chemical OH- such as NaOH could also improve labile P in this soil. However,
biochar could furthermore benefit microbial activity transferring Po to Pi in this soil. Supply P
by inorganic source as KH2PO4 could increase labile P but led to the decrease pH value.
Although application of biochar could not improve labile P in high phosphorus acid soil,
biochar can help reduce water soluble P causing risk for water resources and improve pH. In
Poowong High soil, addition inorganic chemical OH- such as NaOH could not improve labile
15
Thi Kim Phuong Nguyen – 376329
Environmental research project – ENST 90007
but brings with its risks by increasing water soluble P. Supply P by inorganic source as
KH2PO4 has no benefit since it decreased pH value and cannot improve labile P.
References
Bolan, N. S., Naidu, R., Mahimairaja, S. & Baskaran, S. 1994, 'Influence of low-molecularweight organic acids on the solubilization of phosphates'. Biology and Fertility of
Soils, 18, pp. 311-319.
Chan, K. Y., Dorahy, C. & Tyler, S. 2007a, 'Determining the agronomic value of composts
produced from garden organics from metropolitan areas of New South Wales,
Australia'. Australian Journal of Experimental Agriculture, 47, pp. 1377-1382.
Chan, K. Y., Van Zwieten, L., Meszaros, I., Downie, A. & Joseph, S. 2007b, 'Agronomic
values of greenwaste biochar as a soil amendment.(Report)'. Australian Journal of
Soil Research, 45, pp. 629(6).
Chan, K. Y. & Xu, Z. 2009, Biochar: Nutrient properties and their enhancement, in Biochar
for environmental management, London, Earthscan.
DeLuca, T. H., MacKenzie, M. D. & Gundale, M. J. 2009, Biochar effects on soil nutrient
transformations. Chapter 14 in Biochar for environmental management: science and
technology, London, Earthscan.
Dobermann, A., George, T. & Thevs, N. 2002, 'Phosphorus Fertilizer Effects on Soil
Phosphorus Pools in Acid Upland Soils'. Soil Science Society of America Journal 66,
pp. 652-660.
DPI 2011, Victorian State Soil Contender - Brown Dermosol [Online]: Department of Primary
Industries.
Available:
/>
[Viewed: 08/9/2011].
16
Thi Kim Phuong Nguyen – 376329
Environmental research project – ENST 90007
Glaser, B., Lehmann, J. & Zech, W. 2002, 'Ameliorating physical and chemical properties of
highly weathered soils in the tropics with charcoal - a review'. Biology and Fertility of
Soils, 35, pp. 219-230.
Grob, J., Donnelly, A., Flora, G. & Miles, T. 2011, 'Biochar and the biomass recycling
industry'. Biocycle, 52, pp. 50.
Guppy, C. N., Menzies, N. W., Moody, P. W. & Blamey, F. P. C. 2005, 'Competitive sorption
reactions between phosphorus and organic matter in soil: a review'. Soil Research, 43,
pp. 189-202.
Hedley, M. J., Kirk, G. J. D. & Santos, M. B. 1994, 'Phosphorus efficiency and the forms of
soil phosphorus utilized by upland rice cultivars'. Plant Soil, 158, pp. 53–62.
Hedley, M. J., Stewart, W. B. & Chauhan, B. S. 1982, 'Changes in inorganic and organic soil
phosphorus fractions induced by cultivation practices and by laboratory incubations'.
Soil Science Society of America Journal 46, pp. 970-976.
IBI 2010. Guidelines on Practical Aspects of Biochar Application to Field Soil in Various Soil
Management Systems International Biochar Initiative
IBI 2011, What is biochar? [Online]: International Biochar Intinative. Available:
[Viewed: 08/9/201].
Isbell, R. F. 2003, The Australia soil classification, COLLLINGWOOD, CSIRO.
Ishii, T. & Kadoya, K. 1994, 'Effects of charcoal as a soil conditioner on citrus growth and
vesicular–arbuscular mycorrhizal development'. Journal of the Japanese Society for
Horticultural Science, 63, pp. 529–535.
Kamprath, E. J. 1967, 'Residual effect of large applications of phosphorus on high fixing
soils'. Agronomy Journal, 59, pp. 25-27.
17
Thi Kim Phuong Nguyen – 376329
Environmental research project – ENST 90007
Keech, O., Carcaillet, C. & Nilsson, M.-C. 2005, 'Adsorption of allelopathic compounds by
wood-derived charcoal: the role of wood porosity'. Plant and Soil, 272, pp. 291-300.
Kuo, S. 1996, Phosphours. Chapter 32 in Methods of Soil Analysis. Part 3. Chemical
Methods, Madison, WI, Soil Science Society of America.
Lal, R. 2004, 'Soil Carbon Sequestration Impacts on Global Climate Change and Food
Security'. Science, 304, pp. 1623-1627.
Lehmann, J. 2007, 'A handful of carbon'. Nature, 447, pp. 143–144.
Lehmann, J. & Joseph, S. 2009, Biochar for environmental management: science and
technology, London, Earthscan.
Liang, B., Lehmann, J., Solomon, D., Kinyangi, J., Grossman, J., O'Neill, B., Skjemstad, J.
O., Thies, J., Luizão, F. J., Petersen, J. & Neves, E. G. 2006, 'Black Carbon Increases
Cation Exchange Capacity in Soils'. Soil Science Society of America journal 70, pp.
1719–1730.
Linquist, B. A., Singleton, P. W., Yost, R. S. & Cassman, K. G. 1997, 'Aggregate size effects
on the sorption and release of phosphorus in an Ultisol'. Soil Science Society of
America Journal 61, pp. 160-166.
Maurice, P. A., Hochella, M. F., Parks, G. A., Sposito, G. & Schwertmann, U. 1995,
'Evolution of hematite surface microtomography upon dissolution by simple organic
acids'. Clays and Clay Minerals, 43, pp. 29-38.
Rayment, G. E. & Higginson, F. R. 1992, Australian Laboratory handbook of soil and water
chemical methods, Melbourne, Sydney, Inkata Press.
Sanderman, J., Farquharson, R. & Baldock, J. 2010, Soil Carbon Sequestration Potential: A
review for Australian agriculture, CSIRO.
18
Thi Kim Phuong Nguyen – 376329
Environmental research project – ENST 90007
Shen, C., Kahn, A. & Schwartz, J. 2001, 'Chemical and electrical properties of interfaces
between magnesium and aluminum and tris-(8-hydroxy quinoline) aluminum'. Journal
of Applied Physics 89, pp. 449 - 459
Sohi, S., Krull, E., Lopez-Capel, E. & Bol, a. R. 2009, Biochar, climate change and soil: A
review to guide future research, CSIRO.
Sohi, S. P., Krull, E., Lopez-Capel, E. & Bol, R. 2010, A Review of Biochar and Its Use and
Function in Soil. In: Donald, L. S. (ed.) Advances in Agronomy. Academic Press.
Steiner, C., Teixeira, W. G., Lehmann, J., Nehls, T., MaceˆDo, J. L. V., Blum, W. E. H. &
Zech, W. 2007, 'Long term effects of manure, charcoal and mineral fertilization on
crop production and fertility on a highly weathered Central Amazonian upland soil'.
Plant Soil, 291, pp. 275–290.
Thúy, P. T. P. & viễn, D. M. 2008, 'Effects of different organic substracts on soil Al, Fe, P
fractions and maize growth on acid sulfate soil'. Scientific Journal of Can Tho
University, 10, pp. 92-100.
Viễn, D. M., Gương, V. T., Đông, N. M. & Phượng, N. T. K. 2006, 'Application of compost
from sugarcane filter cake to alleviate Al toxicity and improve P availibility on acid
sulfate soil'. Scientific Journal of Can Tho University, 6, pp. 118-125.
Warnock, D., Lehmann, J., Kuyper, T. & Rillig, M. 2007, 'Mycorrhizal responses to biochar in
soil – concepts and mechanisms'. Plant and Soil, 300, pp. 9-20.
Appendix
284 "One-way ANOVA (no Blocking)."
285 BLOCK "No Blocking"
286 TREATMENTS treatments_PL
287 COVARIATE "No Covariate"
288 ANOVA [PRINT=aovtable,information,means,%cv,missingvalues; FPROB=yes;
PSE=diff,lsd,\
19
Thi Kim Phuong Nguyen – 376329
Environmental research project – ENST 90007
289 means; LSDLEVEL=5] H2O_P_PL
289.............................................................................
***** Analysis of variance *****
Variate: H2O_P_PL
Source of variation
d.f.(m.v.)
s.s.
m.s.
v.r. F pr.
treatments_PL
7
15.1053
2.1579
20.69 <.001
Residual
15(1)
1.5647
0.1043
Total
22(1)
16.6274
* MESSAGE: the following units have large residuals.
*units* 3
0.623
s.e. 0.255
***** Tables of means *****
Variate: H2O_P_PL
Grand mean
3.559
treatments_PL
1
1.851
2
2.899
3
4.059
4
4.320
5
3.871
6
3.730
7
4.387
treatments_PL
8
3.357
*** Standard errors of means ***
Table
treatments_PL
rep.
3
d.f.
15
e.s.e.
0.1865
(Not adjusted for missing values)
*** Standard errors of differences of means ***
Table
rep.
d.f.
s.e.d.
treatments_PL
3
15
0.2637
(Not adjusted for missing values)
*** Least significant differences of means (5% level) ***
Table
rep.
d.f.
l.s.d.
treatments_PL
3
15
0.5621
(Not adjusted for missing values)
***** Stratum standard errors and coefficients of variation *****
Variate: H2O_P_PL
d.f.
s.e.
15
0.3230
***** Missing values *****
cv%
9.1
Variate: H2O_P_PL
Unit estimate
22
3.357
Max. no. iterations 2
290 "One-way ANOVA (no Blocking)."
291 BLOCK "No Blocking"
292 TREATMENTS treatments_PL
293 COVARIATE "No Covariate"
294 ANOVA [PRINT=aovtable,information,means,%cv,missingvalues; FPROB=yes;
PSE=diff,lsd,\
295 means; LSDLEVEL=5] CHCl3_NaHCO3_Pi_PL
295.............................................................................
***** Analysis of variance *****
20
Thi Kim Phuong Nguyen – 376329
Environmental research project – ENST 90007
Variate: CHCl3_NaHCO3_Pi_PL
Source of variation
treatments_PL
Residual
Total
d.f.
7
16
23
s.s.
703.447
37.626
741.073
m.s.
100.492
2.352
v.r.
42.73
F pr.
<.001
* MESSAGE: the following units have large residuals.
*units* 6
2.66
s.e. 1.25
***** Tables of means *****
Variate: CHCl3_NaHCO3_Pi_PL
Grand mean
40.55
treatments_PL
1
32.51
treatments_PL
8
39.91
2
34.77
3
43.98
4
50.42
5
45.08
6
38.40
7
39.34
*** Standard errors of means ***
Table
rep.
d.f.
e.s.e.
treatments_PL
3
16
0.885
*** Standard errors of differences of means ***
Table
rep.
d.f.
s.e.d.
treatments_PL
3
16
1.252
*** Least significant differences of means (5% level) ***
Table
treatments_PL
rep.
3
d.f.
16
l.s.d.
2.654
***** Stratum standard errors and coefficients of variation *****
Variate: CHCl3_NaHCO3_Pi_PL
d.f.
s.e.
cv%
16
1.533
3.8
296 "One-way ANOVA (no Blocking)."
297 BLOCK "No Blocking"
298 TREATMENTS treatments_PL
299 COVARIATE "No Covariate"
300 ANOVA [PRINT=aovtable,information,means,%cv,missingvalues; FPROB=yes;
PSE=diff,lsd,\
301 means; LSDLEVEL=5] CHCl3_NaHCO3_Pi_PL
301.............................................................................
***** Analysis of variance *****
Variate: CHCl3_NaHCO3_Pi_PL
Source of variation
treatments_PL
Residual
Total
d.f.
7
16
23
s.s.
703.447
37.626
741.073
m.s.
100.492
2.352
v.r.
42.73
F pr.
<.001
* MESSAGE: the following units have large residuals.
21
Thi Kim Phuong Nguyen – 376329
Environmental research project – ENST 90007
*units* 6
2.66
s.e. 1.25
***** Tables of means *****
Variate: CHCl3_NaHCO3_Pi_PL
Grand mean
40.55
treatments_PL
1
32.51
treatments_PL
8
39.91
2
34.77
3
43.98
4
50.42
5
45.08
6
38.40
7
39.34
*** Standard errors of means ***
Table
rep.
d.f.
e.s.e.
treatments_PL
3
16
0.885
*** Standard errors of differences of means ***
Table
rep.
d.f.
s.e.d.
treatments_PL
3
16
1.252
*** Least significant differences of means (5% level) ***
Table
rep.
d.f.
l.s.d.
treatments_PL
3
16
2.654
***** Stratum standard errors and coefficients of variation *****
Variate: CHCl3_NaHCO3_Pi_PL
d.f.
16
s.e.
1.533
cv%
3.8
302 "One-way ANOVA (no Blocking)."
303 BLOCK "No Blocking"
304 TREATMENTS treatments_PL
305 COVARIATE "No Covariate"
306 ANOVA [PRINT=aovtable,information,means,%cv,missingvalues; FPROB=yes;
PSE=diff,lsd,\
307 means; LSDLEVEL=5] NaOH_Pi_PL
307.............................................................................
***** Analysis of variance *****
Variate: NaOH_Pi_PL
Source of variation
d.f.(m.v.)
treatments_PL
7
Residual
15(1)
Total
22(1)
***** Tables of means *****
s.s.
5911.05
181.09
6064.85
m.s.
844.44
12.07
v.r.
69.95
F pr.
<.001
Variate: NaOH_Pi_PL
Grand mean
125.77
22
Thi Kim Phuong Nguyen – 376329
Environmental research project – ENST 90007
treatments_PL
1
116.67
treatments_PL
8
111.20
2
120.66
3
140.01
4
160.94
5
125.44
6
114.36
7
116.89
*** Standard errors of means ***
Table
treatments_PL
rep.
3
d.f.
15
e.s.e.
2.006
(Not adjusted for missing values)
*** Standard errors of differences of means ***
Table
rep.
d.f.
s.e.d.
treatments_PL
3
15
2.837
(Not adjusted for missing values)
*** Least significant differences of means (5% level) ***
Table
treatments_PL
rep.
3
d.f.
15
l.s.d.
6.047
(Not adjusted for missing values)
***** Stratum standard errors and coefficients of variation *****
Variate: NaOH_Pi_PL
d.f.
15
s.e.
3.475
cv%
2.8
***** Missing values *****
Variate: NaOH_Pi_PL
Unit
6
estimate
120.66
Max. no. iterations 2
308 "One-way ANOVA (no Blocking)."
309 BLOCK "No Blocking"
310 TREATMENTS treatments_PL
311 COVARIATE "No Covariate"
312 ANOVA [PRINT=aovtable,information,means,%cv,missingvalues; FPROB=yes;
PSE=diff,lsd,\
313 means; LSDLEVEL=5] NaOH_Po_PL
313.............................................................................
***** Analysis of variance *****
Variate: NaOH_Po_PL
Source of variation
d.f.(m.v.)
s.s.
m.s.
v.r. F pr.
treatments_PL
7
2900.0
414.3
1.78 0.166
Residual
15(1)
3496.6
233.1
Total
22(1)
6280.1
* MESSAGE: the following units have large residuals.
*units* 3
31.4
s.e. 12.1
*units* 6
-26.4
s.e. 12.1
***** Tables of means *****
Variate: NaOH_Po_PL
Grand mean
138.9
23
Thi Kim Phuong Nguyen – 376329
Environmental research project – ENST 90007
treatments_PL
1
119.1
treatments_PL
8
135.9
2
127.6
3
149.4
4
133.4
5
146.2
6
146.7
7
152.4
*** Standard errors of means ***
Table
rep.
d.f.
e.s.e.
treatments_PL
3
15
8.81
(Not adjusted for missing values)
*** Standard errors of differences of means ***
Table
treatments_PL
rep.
3
d.f.
15
s.e.d.
12.47
(Not adjusted for missing values)
*** Least significant differences of means (5% level) ***
Table
treatments_PL
rep.
3
d.f.
15
l.s.d.
26.57
(Not adjusted for missing values)
***** Stratum standard errors and coefficients of variation *****
Variate: NaOH_Po_PL
d.f.
s.e.
15
15.27
***** Missing values *****
cv%
11.0
Variate: NaOH_Po_PL
Unit
8
estimate
149.4
Max. no. iterations 2
314 "One-way ANOVA (no Blocking)."
315 BLOCK "No Blocking"
316 TREATMENTS treatments_PL
317 COVARIATE "No Covariate"
318 ANOVA [PRINT=aovtable,information,means,%cv,missingvalues; FPROB=yes;
PSE=diff,lsd,\
319 means; LSDLEVEL=5] HCl_Pi_PL
319.............................................................................
***** Analysis of variance *****
Variate: HCl_Pi_PL
Source of variation
treatments_PL
Residual
Total
d.f.(m.v.)
7
15(1)
22(1)
s.s.
5680.219
119.586
4534.399
m.s.
811.460
7.972
v.r.
101.78
F pr.
<.001
* MESSAGE: the following units have large residuals.
*units* 9
-5.20
s.e. 2.23
***** Tables of means *****
Variate: HCl_Pi_PL
Grand mean
74.24
24
Thi Kim Phuong Nguyen – 376329
Environmental research project – ENST 90007
treatments_PL
1
65.95
2
73.09
3
88.03
4
109.06
5
69.62
6
62.29
7
63.61
treatments_PL
8
62.26
*** Standard errors of means ***
Table
treatments_PL
rep.
3
d.f.
15
e.s.e.
1.630
(Not adjusted for missing values)
*** Standard errors of differences of means ***
Table
treatments_PL
rep.
3
d.f.
15
s.e.d.
2.305
(Not adjusted for missing values)
*** Least significant differences of means (5% level) ***
Table
rep.
d.f.
l.s.d.
treatments_PL
3
15
4.914
(Not adjusted for missing values)
***** Stratum standard errors and coefficients of variation *****
Variate: HCl_Pi_PL
d.f.
15
s.e.
2.824
cv%
3.8
***** Missing values *****
Variate: HCl_Pi_PL
Unit
11
estimate
109.06
Max. no. iterations 2
320 "One-way ANOVA (no Blocking)."
321 BLOCK "No Blocking"
322 TREATMENTS treatments_PL
323 COVARIATE "No Covariate"
324 ANOVA [PRINT=aovtable,information,means,%cv,missingvalues; FPROB=yes;
PSE=diff,lsd,\
325 means; LSDLEVEL=5] Residue_P_PL
325.............................................................................
***** Analysis of variance *****
Variate: Residue_P_PL
Source of variation
d.f.(m.v.)
s.s.
m.s.
treatments_PL
7
3313.83
473.40
Residual
15(1)
776.72
51.78
Total
22(1)
3624.57
* MESSAGE: the following units have large residuals.
v.r.
9.14
F pr.
<.001
*units* 10
-15.1
s.e. 5.7
***** Tables of means *****
Variate: Residue_P_PL
Grand mean
214.8
treatments_PL
1
193.6
2
197.4
3
224.9
25
4
227.4
5
221.6
6
213.9
7
219.9
Thi Kim Phuong Nguyen – 376329