Environmental regulation and development a cross country empirical analysis
Bạn đang xem bản rút gọn của tài liệu. Xem và tải ngay bản đầy đủ của tài liệu tại đây (1.12 MB, 34 trang )
IPOl.l(Y
RFSEARCH WORKING PAPER
-a E
Environmental Regulation
prottnhas
:'
not been resricted to wealthy
and Development
_
1448
nations.
Startingat theiowest
Ievelof deveopment'
. .
.
A Cross-Country Empirical Analysis
~~~~~~~~~~~~regulatioriinrawses
steadigly-.
income.
percapita.The.
characteristic
progression,
is:
with.
Susinita Dasgupta
Ashoka Mody
firomnaturalresource
protection,through
Subhendu Roy
D)avid Wbeeler
regulationof vaterpollution,.
to air pollutioncontrol.
I
The World Bank
Polic ResearchDepartmecnt
Environmeint, Infrastructure, and Agriculture Division
April11995
Mi
[POLI(Y RESI ARCII WORKING PAPER 1448
Summary findings
l)asgupta, Mody, Roy, and Wheeler develop
comparative indices of environmental policy and
performance for 31 countries using a quantified analysis
of reports prepared for the Ulnited Nations Conference
on Environment anidDevelopmentn
In cross-country regressions, they find a very strong,
continuous association betwcen their indicators and
national income per capita, particularly whcn adjusted
for purchasing power parity.
Their results suggest a charactcristic progression in
development. Poor agrarian economies .ocus first on
natural resource protectin. With increased urhaniaiii'ue
and industrialization, countrics move from initial
regulation of water pollution to air pollution contrnl
The authors highligilt the importance of institutional
developmcnt. Environmental regulationi is moBre
advanced in developing countries with relatively secuirc
property rights, effective legal and judicial systems, and
efficient ptublic administration.
This paper - a product of the Environment, Infrastructure, and Agriculture Division, Policy Research Depat tment -- is
part of a larger effort in the department to study the relationship between environmental regulation and economic
development. Copies of the paper are available frec from the World Bank, 1818 H Street NW, Washington, DC 20433.
Please contact Elizabeth Schaper, room NIO-037. extension 33457 (27 pages). April 1995.
The PolicyResearch
Working
PaperSeries
disseminates
the findingsof uwk in pogressto encourage
the exchange
of idLasabIout
development
issues.
An objectiuv
of theseries
is to getthefindingsout quickly.evenif thepresentations
areless
thanfullypolished.
The
paperscarrythenames
of theauthorsandshouldbeusedandcitedaccordingly.Thefindings,
interpretations.
andconclusions
arethe
authorsownandshouldnot beattributedto theWorldBank.its F.recutive
Boardof Directors.oranyof its mernber
countries.
Produced by the Policy Research Dissemination Center
ENVIRONMEMTAL
REGULATION AND DEVELOPMENT:
A CROSS-COUNTRY
EMPIRICAL ANALYSIS
by
Susmita
Dasgupta*
Ashoka
Mody
Subhendu Roy
David Wheeler
S. Dasgupta and S. Roy are Consultants and D. Wheeler is
Principal
Economist in the Environment,
Infrastructure
and
Agriculture
Division of the World Bank's Policy Research
Department.
A. Mody is Principal Economist in the
Private Sector
Development
and Privatization
Division of the World Bank's
Cofinancing
and Financial Advisory Services Department.
EXECUTIVE SUMMARY
Since the Stockholm Conference on Environment and
Development in 1972, many countries have taken steps to mitigate
environmental damage. More systematic comparative analysis of
countries' environmental performance would undoubtedly help
clarify the major policy issues and options. Unfortunately,
comparable data on regulatory measures are available only for
developed countries, and even these data are frequently scanty.
In this paper, we undertake a comparative assessment using
environmental reports presented to tlLeUnited Nations Conference
on Environment and Development (UNCED, 1992) by 145 countries.
From the information in these reports, we have developed a set of
indicators which measure the status of environmental policy and
performance.
This paper describes our methodology, the indices,
aiid some results from a statistical analysis of their
relationship to other more conventional measures of socioeconomic
development.
The UNCED reports are similar in form as well as coverage,
and permit cross-country comparisons.
To an impressive degree,
they seem to reflect real environmental conditions and issues.
For this exercise, we have randomly selected 31 UNCED reports
from the total of 145 (see Table 2A, p. 6). These 31 countries
range from highly industrialized to extremely poor, they are
drawn from every world region, and they range in size and
diversity from China to Jamaica.
Our analysis focuses on three dimensions of environmental
policy and performance: Overall, "Green" sector, and "Brown"
sector. We develop and test a set of hypotheses about regulatory
development which can be summarized as follows:
*
Overall environmental performance should be positively
correlated with:
1)
2)
3)
4)
5)
Income per capita;
Degree of popular representation;
Freedom of information;
Security of property rights;
Development of the legal and regulatory system.
Controlling for these variables,
*
"Green" sector indices should be positively correlated with:
1) Rural population density;
2) Agricultural and forest production share of
national output.
*
E"Brown"
sectors indices should be positively correlated
with:
1) Particular focus on public health, indexed by
life expectancy;
2) Urban share of total population;
3) Urban populaFion density;
4) Manufacturing share of national output.
Our analysis of overall regulatory performance reveals
strong cross-country associations with income per capita,
security of property rights, and general development of the legal
and regulatory system. Surprisingly, however, we find only
insignificant or perverse associations with degree of popular
representation and freedom of information.
For both the Green and Brown indices, performance is again
strongly associated with income per capita, freedom of property
and (in small samples) measures of regulatory efficiency.
The
two specifically rural-sector variables (population density;
proportion of GDP in agriculture and forestry) are only weakly
associated with the Green index. T'e fit is much better for the
Brown index: degree of urbanization, population density and
manufacturing share in GDP all have the expected signs and
relatively high significance. Life expectancy as a proxy for
public health priority has no independent effect.
In summary, our findings suggest that a detailed, quantified
analysis of the UNCED reports can yield comparable and plausible
indices of environmental policy performance across countries.
Cross-country variations in our environmental index are wellexplained by variations in income per capita, degree of
urbanization and industrialization, security of property rights,
and general administrative efficiency.
1.
Introduction
Since the Stockholm Conference on Environment and
Development
in 1972, many countries have taken steps to mitigate
environmental damage.
General environmental
legislation is
already common, although detailed rules and regulations are still
far from universal.
In many developing countries, it is clear
that enforcement of environmental laws has been hampered by
inadequate staffing and funding.
Anecdotes abound, but more
systematic comparative analysis of countries' environmental
performance would undoubtedly help clarify the major policy
issues and options.
Unfortunately, comparable data on regulatory
measures are available only for developed countries, and even
these data are frequently scanty.
At present, therefore, comparat:.ve analysis must begin with
basic data construction.
environmental
One promising source is the set of
reports presented to the United Nations Conference
on Environment and Development
(UNCED, 1992) by 145 countries.
The reports are reasonably comparable because the UN imposed a
standard reporting format.
Using a multidimensional survey of 31 national UNCED
reports, we have developed a set of comparative indices for the
status of environmental policy and performance.
This paper
describes our methodology, the indices, and some results from a
statistical analysis of their relationship to other more
1
conventional measures of socioeconomic development.
In the
following section, we begin with a description of the UNCED
reports.
sets
Section 3 explains our indexing method, while Section 4
out some preliminary hypotheses about the relationships
linking environmental policy and performance to socioeconomic
development.
Section 5 reports and discusses some statistical
tests of the hypotheses; and Section 6 concludes the paper.
2.
The UNCED Reports
As part of the preparations for the United Nations
Conference on Environment and Development (UNCED - Rio de
Janeiro, June 1992), all UN member governments were asked to
prepare national environmental reports.
Detailed preparation
guidelines were laid down at the First Preparatory Committee
meeting in Nairobi in August, 1990.' The UNCED secretariat
suggested that the reports be prepared by working groups
representing government, business and non-governmental
organizations
(NGO's). The guidelines recommended that the
reports provide information on: (i) the drafting process;
(ii) problem areas; (iii) past and present capacity building
initiatives;
(iv) recommendations and priorities
and development;
requirements;
{v) financial
arrangements
for environment
and funding
(vi) environmentally sound technologies;
! United Nations General Assembly document A/CONF.151/PC/8
and
A/CONF.lSl/PC/B/Add.1
2
(vii) international cooperation; and (viii) expectations about
UNCED.
The resulting reports are similar in form as well as
coverage, and permit cross-country comparisons.
Undoubtedly,
the
participation of NGO's has helped assure that the UNCED reports
are not mere government handouts.
To a striking degree, they
seem to reflect real environmental conditions and issues.
While we recognize that self-reporting always carries the risk of
misrepresentation,
we should also note that almost all currently
available enivironmental information is self-reported by firms and
governments.
The UNCED reports differ principally
in the absence
3f any formal sanction for misreporting.
3.
Quantifying Environmental Performance
For this exercise, we have randomly selected 31 UNCED
reports from the total of 145 (see Table 2A, p. 6).
These 31
countries range from highly industrialized to extremely poor,
they are drawn from every world region,
and they range in size
and diversity from China to Jamaica.
Our survey considers the state of policy and performance
in
four environmental dimensions: Air, Water, Land and Living
Resources. We analyze the apparent state of policy as it affects
the interactions between these four environmental dimensions and
five activity categories: Agriculture, Industry, Energy,
Transport and the Urban Sector.
Although many overlaps
3
undoubtedly exist, we attempt to draw a separate assessment for
the interaction of each activity category with each environmental
dimension.
Our survey assessment uses twenty five questions to
categorize the state of (i) environmental awareness;
of policies adopted;
(ii) scope
(iii) scope of legislation enacted;
(iv) control mechanisms in place; and (v) the degree of succeus
in implementation.2
The status in each category is graded "High,
Medium, Low," with assigned values of 2, 1 and 0 respectively.
For each UNCED country report, all twenty-five questions are
answered for each element of the matrix in Table 1. With 20
elements in the matrix, 500 assessment scores are developed for
each country.
We compute four composite indices by adding scores within
each environmental dimension.
We also calculate a total score
to provide a composite index of the state of environmental policy
and performance.
Finally, we have used our scoring system to
establish separate indices for three particularly interesting
policy dimensions:
the extent of environmental awareness;
enactment of policies; and success in implementation.
We use all
three sets of indices for the cross-country analysis reported in
Section 5.
2
The survey instrument is included in the Appendix.
country scores are available on request.
4
All
Table 1
Evaluation Format
Sector/
Activity
Water
Air
Land
Living
Resources
Agriculture
Industry
Energy
____
____
Transport
Urban
_
_ -
_
Using the four dimensional indices and a composite index, we
summarize
our
results as country rankings
values are displayed in Table 2B.
in Table
2A. Actual
Table 2A also ranks countries on
the basis of per capita C-NP (PCGNP) and per capita GDP estimates
compiled by the UN International Comparisons Program (ICPGDP) . The
ICPGDP computation explicitly adjusts the standard income data to
take account of purchasing power parity. Where countries
in our
sample are not covered in the most recent International Comparisons
Program
Study
estimate.
(Phase V,
1985), we
have
adopted
a World
Bank
The 1985 figures have been extrapolated to 1990 using
World Bank estimates of real per capita GDP growth.
Table 3 presents summary statistics for the four dimensional
performance indices, whose possible maximum values are all 250.
The results suggest fairly similar distributions with the
exception of Air, which has a significantly lower mean and
greater variance.
Our statistical results suggest that air
pollution gets relatively low priority in poor countries but
5
Table 2A
SampleCounnryRunking.:
IncomeandEnvrcnnmental
PerfonuanceIndices
Country
PCGNP
ICPGDP
Air
Water
Land
Living
Resources
Switzerland
I
I
.
2
2
I
2
FInland
2
3
4
3
3
4
4
Germany
3
2
Netherlands
4
4
3
4
4
3
3
Ireland
5
5
5
5
4
5
5
ICora
6
7
7
B
7
7
Trinidad
7
6
10
II
1I
12
11
Brazil
8
IU
12
16
16f
SAfrica
9
9
8
9
9
10
9
Bulgana
10
7
6
6
6
6
6
Janmica
If
16
8
BI
7
Tunisia
12
13
9
10
10
11
10
Thailand
13
11
15
24
Is
23
19
Jordan
14
12
17
14
15
22
16
ParAguay
15
14
24
20
20
17
21
PapuaNG
16
21
28
27
29
30
29
Philippines
17
17
is
24
20
18
20
Egypt
lS
15
21
12
24
27
22
Zambia
19
26
'2
23
20
20
23
Ghana
20
20
18
19
Is
18
17
Pakistan
21
19
13
14
13
13
13
China
22
18
15
16
12
9
12
Kenya
23
24
23
16
16
16
18
India
24
23
13
13
14
i4
14
Nigena
25
22
26
21
25
24
24
Bangladesh
26
25
25
29
27
29
26
Malawi
27
27
Is
22
23
21
27
Bhuman
28
30
30
31
30
28
30
Ethiopia
29
31
31
30
31
31
31
Tanzania
30
29
29
28
28
26
28
Mozambique
31
28
27
26
26
25
25
.
2
1
6
15
S
X
Tibil. 211
Sample
CoiuniyDR,Al
lnmonne
andEnvinnmctital performanceIndices
C'onltry
I'tGNI'
.3I9W01
Swucrlane3d
J2.,hH0
linland
ICPODP
i ISI 'rXM_
Air
Waler
21.o90
231
240
J3
238
947
2h,040
15,620
214
229
231
220
894
mnany
22.320
16,920
236
242
241
232
951
Ncthcrlinds
17,320
14.600
219
220_j
229
226
90
lIcand
9.550
9.130
203
223
229
216
Korea
5.410)
7.190
-SO
170
189
177
686
Trinidad
3.610
8.510
I1l
149
159
13R
564
Brazil
2.680
4.780
113
127
130
123
15
S.Afnca
2.530
5.500
136
165
173
145
619
Bulgana
2.250
7,900
168
198
199
185
750
Jamaica
1.500
3.030
114
168
193
158
633
Tumnsia
1.440
3.979
128
158
161
142
589
Thailand
1.42D
4.610
98
113
129
109
449
Jordar
1.240
4,530
95
131
138
I10
474
Paraguay
I.110
3.120
84
117
123
119
443
PapuaNG
860
1.500
54
91
100
84
329
Philippines
730
2.320
93
113
123
118
447
Egypt
600
3.100
92
134
118
97
441
Zambia
420
810
87
115
123
114
439
Ghana
390
1.720
93
124
129
118
464
Pakistan
380
1.770
[Os
131
144
128
SOB
China
370
1.950
98
127
151
153
529
Kenya
370
1,120
85
127
130J
121
463
India
350
1.150
105
132
143
127
507
Nigeria
290
1.420
75
106
114
105
400
Bangladesh
210
1,050
77
89
109
91
366
Malawi
20W
670
93
116
122
III
352
Bhutan
190
510
39
54
70
93
256
Ethopia
120
310
20
56
67
75
218
Tanzania
110
540
50
90
103
98
341
Mozambique
80
620
56
98
112
102
37_
7
Land
I.iving
Resources
_
Env
187
increases more rapidly in importance with income.
By contrast,
low income countries such as Tanzania, Mozambique, Bhutan and
Bangladesh seem to focus first on the natural resources which are
critical to their livelihood --
soils, forests and water.
Table 3
Indices of Environmental Policy-Summary Measures for 31 Countries
4.
Resource
Mean
s.d.
Maximum
Minimum
Air
113.84
56.61
236.0
20.0
Water
140.61
50.91
242.0
54.0
Land
149.03
48.26
241.0
67.0
Living
137.B4
46.70
238.0
75.0
The Political Economy of Exvironmental Management:
Some Preliminary Hypotheses
Environmental degradation affects national welfare by
damaging human health, economic activities and ecosystems.
Because environmental problems represent a classic externality,
some government regulation is generally warranted.
From an
economist's perspective, desirable regulation should weigh two
factors: the benefits associated with reduced environmental
damage and the opportunity cost of mitigation.
In reality, the
extent and focus of government intervention will also reflect
national political and institutional considerations.
8
4.1
Benefits
The demand for environmental quality should increase with
income per capita, and we would expect this to be strongly
reflected in the country scores.
In addition, demographic and
sectoral differences may play an important role.
For example,
economies with high rural population densities and heavy
dependence on agriculture and forest extraction should be
particularly
concerned with agricultural water supply, soil
erosion, and deforestation.
In our Evaluation Format (Table 1),
the relevant scoring cells are located at the intersection of
Agriculture with Water, Land and Living Resources.3
If
environmental policy reflects basic economic considerations
resource-dependent
in
economies, we would expect country scores in
these dimensions to be positively correlated
(ceteris paribus)
with rural population density and the share of agricultural and
forest production in national output.
By contrast, urbanized and industrialized economies should
exhibit more concern with the potential health impacts of air and
water pollution on densely populated areas.
The relevant cells
in this context are located at the intersections of the Air and
Water columns with Industry, Energy, Transport and Urban.
We
would expect country scores in these dimensions to be correlated
with the urban share of national population, urban population
density, and the share of manufacturing
in national output.
Agriculture includes wood production from plantations and
primary forests.
3
9
4.2
Opportunity Costs
Governments must make resource allocation decisions with
constrained budgets, so we would expect the benefits of
environmental
costs.
improvement to be weighed against opportunity
In particular, environmental management
liasto share a
limited social welfare budget with public health, education and
other needs.
Therefore the poorer the country, the more limited
environmental management resources are likely to be.
This should
be another source of positive correlation between income per
capita and country scores.
4.3
Political Economy
Political and institutional factors may also contribute
significantly to cross-country variation in environmental policy
and performance.
Attention to environmental problems should
reflect the political power of affected interest groups, the
quality of their information about environmental damage, and the
effectiveness of legal and regulatory institutions.
Many
environmental problems pit broad public interests against the
profitable pursuit of manufacturing and extraction.
Thus, we
might expect our environmental performance indices to be
correlated with measures of degree of popular representation,
freedom of information and education.
Performance should also be
superior where legal and regulatory systems are relatively
efficient.
Finally, environmental objectives may be promoted
10
more strongly in economies where secure property rights lead to
longer planning horizons.
4.4
Predicted Relationships
Within this simple framework, we can make some predictions
about the probable strength and direction of empirical
relationships across our sample countries.
We consider cross-
country variations in three sets of indices:
(1) Overall policy
and performance, along with separate scores for Air, Water, Land
and Living Resources; (2) a "Green" index (interaction of
Agriculture with Water, Land and Living Resources) and (3) a
"Brown" index (interaction of Industry, Energy, Transport and
Urban with Air and Water).
We have also decompnosed the Green and
Brown indices into three subindices:
Awareness of environmental
problems; enactment of regulations; and success in
implementation.
However, as Table 4 indicates, the subindices
are so highly correlated with the composite indices that more
detailed analysis seems unnecessary.
Table 4
Correlation Matrix:
Component Scores
Green Subindices
_
Composite
Awareness
Enactment
Composite
1
Awareness
.906
1
Enactment
.982
.858
1
.968
.866
.910
1Success
iSuccess
l
l
11
1
Brown Subindices
IComposite Awareness
Enactment
Composite
1
Awareness
.953
1
Enactment
.989
.926
1
Success
.984
.934
.951
Suce7ess
_
_
1
To summarize briefly, the following predictions are
consistent with our hypotheses:
*
Overall environmental performance should be positively
correlated with:
1)
2)
3)
4)
5)
Income per capita;
Degree of popular representation;
Freedom of information;
Security of property rights;
Development of the legal and regulatory system.
Controlling for these variables,
*
G.reen indices should be positively correlated with:
1) Rural population density;
2) Agricultural and forest production share of
national output.
*
Brown indices should be positively correlated with:
1) Particular focus on public health, indexed by
life expectancy4;
2) Urban share of total population;
3) Urban population density;
4) Manufacturing share of national output.
4
We recognize some risk of endogeneity, but we regard it as
minimal in this case. Life expectancy is influenced by many policy
and other variables which are not directly related to environmental
concerns.
12
5.
Results
5.1
Income and Environmental Performance
The correlation between income and composite environmental
rankings is clear in Table 2A. Comparisons of bivariate
regressions on the two income measures, recorded in Tables 5A and
5B, reveal significantly tighter fits for ICPGDP. The income
elasticity of environmental policy performance is positive and
Air seems to
highly significant in all environmental dimensions.
have a much higher income elasticity than the others.
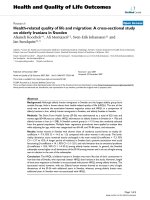
The
scatter of the composite environmental index (Env) against ICPGDP
(Figure 1) indicates that the relationship is continuous over the
entire range of incomes.
5.2
Political Economy and Institutional Variables
For the reasons previously noted, effective environmental
management may be seriously handicapped by lack of political,
civil, and economic liberty; lack of an independent judicial
system; and an inefficient or corrupt bureaucracy.
To test these
ideas, we have fitted regressions with several sets of
institutional
indicators previously used in the literature. In
each case, limited availability of the indicators has forced us
to run regressions on subsamples of countries.
Our first test employs a widely-used set of political,
and economic liberty indicators developed by Gastil.5 These
5 See Scully
(1992) for details.
13
civil
Table
Impact
of
Dependent
Variable
PCGNP
on
5A
Environmental
Intercept
In
Indicators
PCGNP
Adjusted
.
ln Air
2.70
(11.93)
0.27
(8.70)
0.71
ln Water
3.55
(22.84)
0.19
(8.80)
0.72
ln
3.79
(27.70)
0.17
(8.75)
Land
0.72
_
ln
Living
3.73
(29.60)
0.16
(9.26)
0.74
ln
Env
4.89
(34.80)
0.19
(9.78)
0.76
*t-statistics
in parentheses.
Table
Impact
Dependent
Variable
ln Air
of
ICPGDP
on
5B
Environmental
Intercept
ln
ICPGDP
Indicators
Adjusted
1.29
(4.06)
0.42
(10.59)
ln Water
2.59
(11.53)
0.30
(10.30)
ln
2.97
(14.52)
0.25
(9.82)
3.03
0.23
(8.53)
0.71
(13.88)
3.97
(18.72)
0.29
(10.79)
0.79
Land
ln Living
l ______________
ln
Env
R2
14
0.79
.
0.78
0.76
__
R2
Figure
Overall
Environmental
ICP
Income
1
Performance
Per
vs.
Capita
7.00
*.
I
.
*~~~~~~~~~~~~~.
9
6.50!
*
X
9
6.00
_-
9
I
9
9
5.50
5.00
6.00
7.00
8.00
ln ICPGDP
15
9.00
10.00
11.00
indicators are available for 29 of our selected 31 countries.
Among the aspects that appear most relevant for our study are:
freedom of property
of print media
(FOP), freedom of information
(FPM), freedom of broadcast media
(FOI), freedom
(FBM), freedom
of peaceful assembly (FPA) and the Gastil-Wright classification
of types of economic system (TES) by degree of commercial
freedom.
In our regressions, only FOP and FOI are statistically
significant
(Table 6). Each of these indicators is coded 1 to 5,
with higher scores for lower liberty, so the expected sign of the
coefficients is negative for both indicators.
Freedom of
property has the expected sign, but the other result is quite
surprising: Controlling for income and property rights, greater
freedom of information is associated with lower environmental
index values.
We have no explanation for this anomaly, and we
have dropped FOI from our final regressions
(Table 9).
Table 6
Impact of Liberty Indexes on Environmental Indicators
Dependent
Intercept
ln ICPGDP
ln FOP
ln FOI
Adjusted
R2
Variable
ln Air
1.42
(2.97)
ln Water
ln Land
ln Living
ln Env
._
_
0.41
(8.17)
-0.36
(-2.39)
0.27
(2.24)
0.80
0.82
2.86
0.27
-0.26
0.18
(9.54)
(8.44)
(-2.80)
(2.38)
3.17
(10.28)
0.23
-0.18
0.12
(7.16)
(-1.90)
(1.57)
3.22
0.22
-0.27
0.16
(9.57)
(6.27)
(-2.57)
(1.90)
4.18
0.27
-0.26
0.18
(13.43)
(8.25)
(-2.72)
(2.25)
16
0.77
0.74
0.82
As a second test, we have employed measures of bureaucratic
delay and contract enforceability
(or relative degree to which
contractual agreements are honored) from Business Environmental
Risk Intelligence, Inc. (BERI) ,h
are available
Scores for the BERI indicators
for only fourteen of our thirty-one countries and
are set so thlat positive relationships with environmental
Table 7
Impact of BERI Indexes on Environmental Indicators
Adjusted
R2
Intercept
ln
ICPGDP
ln Delay|
ln Air
1.99
(3.48)
0.32
(3.23)
0.19
(0.56)
0.81
ln Water
3.21
(6.19)
0.18
(2.04)
0.31
(1.00)
0.72
0.68
Dependent
Variable
ln Land
l__________
ln Living
____
__
ln Env
l__________
ln Air
ln Water
ln Land
ln Living
l__________
ln Env
6
3.25
0.20
0.18
(6.18)
(2.19)
(0.57)
2.99
0.21
0.24
(4.87)
(1.99)
(0.64)
0.22
0.23
(7.96)
(2.40)
(0.72)
2.05
(2.24)
0.32
(2.10)
4.29
in
Contract
0.66
.
0.74
0.16
(0.34)
0.81
0.72
3.45
0.15
0.35
(4.15)
(1.11)
(0.82)
3.43
(4.12)
0.18
(1.26)
0.22
(0.52)
0.68
3.01
0.22
0.17
0.65
(3.06)
(1.34)
(0.33)
4.42
0.21
0.23
(5.13)
(1.47)
(0.52)
0.73
_
For a discussion of these indicators, see Keefer and Knack
(1993).
17
management would be consistent with our prior hypotheses about
the effect of judicial and administrative efficiency.
The
regression coefficients are positive, as expected, but none are
statistically significant
(Table 7).
Finally, we have tested a set of indicators which directly
reflect the efficiency of the legal and judicial system (LJS) and
the level of red tape in the bureaucracy
(RTB).
These were
developed by the Country Assessment Service of Business
International, Inc.7
Unfortunately, the measures are available
for only twelve of the thirty-one countries in our sample.
In
separate regressions for this subset of countries, both LJS and
RTB emerge as significant explanatory variables.
Since they are
collinear, we have computed their first principal component
and used it as a composite regressor.
(PC1)
When it is included with
ICPGDP (Table 8) the results show substantial improvement in the
explanatory power of the regressions: The adjusted R2 increases
between 9% and 24%. The change in outliers indicates that the
improvement is especially striking for Ireland, India and
Thailand.
5.3 Green and Brown Indices
For both Green and Brown indices, the regressions reported
in Table 9 suggest that performance is again strongly associated
See Wheeler and Mody (1992) for details.
18
with income per capita, freedom of property and (in small
samples) measures of regulatory efficiency.
variables
The two rural-sector
(population density; proportion of GDP in agriculture
and forestry) are only weakly associated with the Green index
(Table 9a). The fit is much better for the Brown index: degree of
urbanization, population density and manufacturing
share in GDP
all have the expected signs and relatively high significance
(Table 9b).
Life expectancy as a proxy for public health
priority has no independent effect.
6.
Summary
Using a multidimensional
survey analysis of the UNCED
reports, we have developed a set of comparative indices of
environmental policy and performance in thirty-one
countries. We
find a strong positive correlation between our environmental
indicators and the level of economic development.
The fit is
substantially better when national incomes are adjusted for
purchasing power parity.
The income elasticity of the indices is
positive and highly significant in all environmental
dimensions.
The pattern of elasticities suggests that protection measures for
land and living resources precede those for water; action for
reducing air pollution comes later.
Some impact for institutional development is also suggested
by our results, although the information base is quite limited.
19
Table
Impact
of
Dependent
ICPGDP,
LJS and RTB oi Environmental Indicators
Intercept
Variable
ln Air
____________
In Air
l___________
In Water
l
___________
ln Water
ln Land
____________
ln Land
____________
in Living
ln Living
l___________
ln Env
ln Env
____(18.08)
_
ln ICPGDP
PCi
Adjusted R2
_
1.60
0.38
(2.91)
(6.02)
0.76
3.35
0.18
0.26
(8.81)
(4.07)
(6.18)
2.59
0.29
(5.57)
(5.35)
4.13
0.11
0.23
(3.73)
(8.37)
2.79
0.27
(6.19)
(5.16)
0.95
0.72
(16.68)
0.96
0.70
4.20
0.10
0.21
(13.15)
(2.78)
(5.96)
2.79
('.19)
0.27
(5.16)
0.93
0.70
4.05
0.11
0.24
0.90
(9.12)
(2.15)
(4.91)
_
3.77
(7.79)
_L.
8
5.35
0.31
0.73
(5.48)
0.12
(3.58)
0.23
0.95
(7.15)
The level of explanation in all regressions improves
significantly with the addition of the Business International
effectiveness
indices for legal/judicial and administrative
systems and the Gastil measure of property rights protection.
Similar BERI measures are not significant, however.
We also
obtain insignificant or perverse results for all Gastil measures
of degree of popular representation and freedom of information.
20