Consumer values versus perceived product attributes: Relationships among items from the MVS, PRS, and PERVAL scales
Bạn đang xem bản rút gọn của tài liệu. Xem và tải ngay bản đầy đủ của tài liệu tại đây (251.61 KB, 13 trang )
Sport Management Review 14 (2011) 89–101
Contents lists available at ScienceDirect
Sport Management Review
journal homepage: www.elsevier.com/locate/smr
Consumer values versus perceived product attributes: Relationships
among items from the MVS, PRS, and PERVAL scales
Donghun Lee a,*, Galen T. Trail b,1, Hyungil H. Kwon c,2, Dean F. Anderson d,3
a
Division of Business, College of Mount St. Joseph, 5701 Delhi Road, Cincinnati, OH 45233, United States
Seattle University, Lynn 112, 901 12th Avenue, P.O. Box 222000, Seattle, WA 98122, United States
c
Florida State University, Tully Gym 120A, Tallahassee, FL 32306-4280, United States
d
College of Education, Iowa State University, Ames, IA 50011, United States
b
A R T I C L E I N F O
A B S T R A C T
Article history:
Received 12 March 2009
Received in revised form 14 April 2010
Accepted 4 May 2010
Available online 8 June 2010
Consumer values and the perceived attributes of a product elicit consumptive behaviors.
The purpose of this study was twofold: (a) to test the psychometric properties of three
scales (MVS; Richins & Dawson, 1992; PRS, Richins, 1994; PERVAL scale, Sweeney & Soutar,
2001) that measure consumer values and the perceived attributes of a product within a
licensed sport merchandise (LSM) setting, and (b) to examine the relationships among
items across the three scales for commonalities, and to examine the relationships between
consumer values (CV) and perceived product attributes (PPA). Statistical analyses
indicated that the psychometric properties of the MVS, PRS, and PERVAL scales could be
improved substantially. A principal components analysis (PCA) indicated nine interpretable dimensions; five that could be categorized as CV dimensions (Social Approval,
Materialism, Covetousness, Prestige/Status, and Escape) and four that could be categorized
as PPA dimensions (Price/Quality, Nostalgia, Craftsmanship, and Aesthetic Beauty).
ß 2010 Sport Management Association of Australia and New Zealand. Published by
Elsevier Ltd. All rights reserved.
Keywords:
Consumer values
Perceived product attributes
By the end of the 1990s, estimates of the total production and consumption of sporting goods and services ranged from
$213 to $560 billion (Howard & Crompton, 2004). Shank (2002) reported that retail sales of licensed products of the four
major leagues and universities in the U.S. have doubled from $5.35 billion in 1990 to $10.95 billion in 1999. Nearly 20% of the
total amount spent on sport was for sport product consumption including equipment, apparel, footwear, and licensed goods
(‘‘The Making of the $213 Billion,’’ 1999). This figure did not include the $8.84 billion spent by spectators on merchandise at
sports venues (Howard & Crompton). This market trend has continued. Retail sales of sport-licensed merchandise have
reached $13.2 billion in 2005 in the U.S. and Canada (Brochstein, 2006). According to Brochstein, sports licensing is the
fastest growing segment within the licensing industry. The purchase of sport merchandise has contributed a significant
portion to the overall consumption of sport.
Although the amount spent on sport products and services is known, internal and external influences that affect the
purchase of licensed sport merchandise are not well understood. According to Richins and Dawson (1992), although
consumers may behave independently, they tend to be directed by very similar desires for goods. Thus, individuals might be
able to be classified by the degree of similarity in their consumer values (Pitts & Woodside, 1984). Likewise, comprehending
* Corresponding author. Tel.: +1 352 392 4042x1309; fax: +1 352 392 7588.
E-mail addresses: (D. Lee), (G.T. Trail), (H.H. Kwon), (D.F. Anderson).
1
Tel.: +1 206 398 4605; fax: +1 206 398 4618.
2
Tel.: +1 850 645 2350; fax: +1 850 644 0975.
3
Tel.: +1 515 294 3427; fax: +1 515 294 8740.
1441-3523/$ – see front matter ß 2010 Sport Management Association of Australia and New Zealand. Published by Elsevier Ltd. All rights reserved.
doi:10.1016/j.smr.2010.05.001
90
D. Lee et al. / Sport Management Review 14 (2011) 89–101
what determines product consumption is clarified when consumer values are identified (Richins, 1994) and additionally,
when the aspects that constitute perceived value (important attributes) of a product are understood (Sweeney & Soutar,
2001). This distinction is a critical one and one that is often neglected. Consumer values (CV) are beliefs that guide
consumers’ behavior when purchasing products or services. The perceived value of an object is the object’s perceived worth
to the individual or as Zeithaml (1988) noted, it is the ‘‘consumer’s overall assessment of the utility of a product (or service)
based on perceptions of what is received and what is given’’ (p. 14). The perceived value of a product is often predicated on
the consumer values for that individual, and thus these concepts are frequently confused within the research on these topics.
Thus, we purposefully refer to perceived value of a product as the perceived product attributes (PPA) throughout this study.
Another method of distinguishing between the two is that CVs are internal and are typically generalizable across consumer
behavior situations, while PPA are specific to the individual and are typically contingent on the product itself (i.e., product
specific).
1. Consumer values and perceived product attributes
As we noted above, consumers are likely to have different preference criteria according to their value systems. Compared
to attitudes, values generally carry greater importance in a person’s life and are more abstract and general (Schwartz, 1992).
Values are often expressed by various motivational types of goals (Schwartz, 1992; Schwartz & Bilsky, 1990). However, it is
uncertain how individuals establish their values, such as honesty, security, power, and so forth. In addition, it is not clear that
values themselves are sufficient in explaining consumption behaviors. As a result, several researchers have used the meansend chain approach (Gutman, 1982; Reynolds & Gutman, 1988; Vinson, Scott, & Lamont, 1977). For instance, Gutman
distinguished values from product attributes in that values are end states that one desires to be, which may or may not be
actualized. Product attributes are the product features that provide the desired benefits, which may gratify specific values
(Gutman). Vinson et al. classified an individual’s value system into several dimensions (i.e., global values–domain-specific
values–evaluative values). Within the classification, global values are the beliefs that guide one’s thought process, while
evaluative values are specifically related to product attributes that elicit one’s beliefs. These lead to evaluation of the
properties of a product, which elicits behavior. In this vein, an individual’s perceived attributes of a product tends to be an
evaluation of information available to the individual, such as cost, craftsmanship, aesthetic appearance, and so forth.
Bloch and Richins (1983) also made a CV–PPA distinction in their theoretical model, which depicted consumer
characteristics, product characteristics, and situational variables influencing perceived product importance, which in turn,
influenced product purchase. Consumer characteristics included values, needs, personality traits, and social roles, among
other things. Product characteristics were the attributes of the product (e.g., cost, symbolic attributes of the product, etc.).
Situational variables included time available to search for the product and/or the presence or absence of family or friends at
time of purchase. Bloch and Richins also divided product importance type into two dimensions: enduring importance and
instrumental importance. Enduring importance was defined as a ‘‘long-term, cross-situational perception of product
importance based on the strength of the product’s relationship to central needs and values’’ (Bloch & Richins, p. 72).
Instrumental importance was defined as ‘‘a temporary perception of product importance based on the consumer’s desire to
obtain particular extrinsic goals that may derive from the purchase and/or usage of the product’’ (Bloch & Richins, p. 72). The
distinction Bloch and Richins made between consumer characteristics and product characteristics is similar to our
distinction between consumer values and perceived product attributes. In their model, each influenced product
consumption, mediated by a different type of product importance. In summary, the proposed models and hypotheses noted
above suggest that a CV–PPA distinction exists. However, there is little, if any, empirical evidence supporting a distinction
between the two at a domain level. Thus, there is a need for empirical examination of such aspects, especially in a contextspecific situation, like LSM consumption. However, this context-specific situation of LSM consumption may cause licensed
sport merchandise to be evaluated differently from many other types of merchandise or merchandise in general.
2. SEC paradigm
One way of categorizing goods is the search–experience–credence (SEC) paradigm. Nelson (1970) proposed that goods
could be categorized into either ‘‘search’’ goods or ‘‘experience’’ goods depending on how easily the core attributes of the
good could be evaluated prior to purchase. A consumer can easily inspect the qualities of search goods prior to purchase (e.g.,
a book; Ekelund, Mixon, & Ressler, 1995), whereas the qualities of an experience good can only be evaluated after the
consumption of the product (e.g., a cruise; Ekelund et al.). Due to this relative complexity, consumers of experience goods are
more skeptical about their evaluation of product attributes than those of search goods (Franke, Huhmann, & Mothersbaugh,
2004). According to Ford, Smith, and Swasy (1988), Darby and Karni (1973) proposed the third category of goods (credence)
because ‘‘certain qualities can never be verified by the average consumer. This occurs because the consumer may not possess
sufficient technical expertise to assess the product’s true performance, to diagnose his/her own need for the product or
service, or because diagnosing a need separately from filling the need at the same time is uneconomical or difficult’’ (Ford
et al., 1988, p. 239). These qualities were termed ‘‘credence’’ and credence qualities are those that cannot be verified even
after purchase and consumption. Ekelund et al. suggested that marriage counseling (therapy) would be a credence good.
However, as Ford et al. noted, although the SEC has intuitive appeal, it has not been validated. Furthermore, Huang, Lurie, and
Mitra (2009) claimed a slightly modified view to the Nelson’s search-experience classification. They suggested that ‘‘it is no
D. Lee et al. / Sport Management Review 14 (2011) 89–101
91
longer the amount of search or the perceived ability to assess product quality before purchase that distinguishes search from
experience goods; rather, it is the type of information sought and the way this information is accessed and processed by the
consumer’’ (p. 66). Thus, products and services, rather than fitting neatly into one particular category, may exist on a
continuum somewhere between the most basic ‘‘search’’ good and the most esoteric ‘‘credence’’ good.
A product without a brand association with a team but in a similar vein (e.g., a shirt, cap, or jacket) would typically be
categorized as a search good. However, the branding of the same product with a team name (e.g., a Lakers jersey)
potentially moves the product into the experience-product category because the core attribute of LSM (i.e., vicarious
achievement obtained by wearing team merchandise) is rather difficult to evaluate without an actual experience. That
is, the full experience of the product is not obtained until the purchaser wears the product and is evaluated by others
(either positively or negatively) due to the association created with the referent team by the product. If this was the
case, then LSM may tend to be a credence good, as this added value may never be able to be fully evaluated by the
purchaser. Thus, consumers of LSM may be more cautious about their product purchase compared to general non-sport/
team merchandise, indicating that perhaps LSM is closer to an experience product than a search product on the
continuum, or perhaps even more closely related to a credence product. The potential for evaluating LSM differently
from other types of products may make existing measures of consumer values and perceived product attributes less
valid when used with LSM purchases.
3. Measures of consumer values and perceived product attributes
There have been several attempts to develop research tools that systematically measure the complex nature of
consumer values (Helgeson, Kluge, Mager, & Taylor, 1984; Richins, 2004; Richins & Dawson, 1992). Several researchers
have developed scales that measure consumer values and perceived product attributes relative to general product
consumption. For example, Richins and Dawson developed the 18-item Material Values Scale (MVS) that consists of
three consumer values (i.e., Success, Centrality, and Happiness). The items of the MVS were designed to measure
materialistic values that trigger an individual’s consumption behavior. Similarly, Richins (1994) introduced a Possession
Rating Scale (PRS) that measures possession of goods that are important to a person according to various reasons such
as enjoyment, interpersonal ties, self-expression, and appearance-related aspects. However, the PRS scale included
items measuring both consumer values and perceived product attributes. Sweeney and Soutar (2001) developed a
Perceived Value (PERVAL) scale that measured the perceived worth of consumer products to the purchaser. Similar to
PRS, the items on the PERVAL scale seem to measure both consumer values and perceived attributes of a product as well.
Accordingly, using these scales, researchers attempted to explain complex consumption behaviors and also initiated the
development of research tools to measure cognitive aspects possibly influencing general product purchases. It is readily
apparent that the three scales have structural and/or contextual similarities and differences while designed to focus on
general product consumption. Regardless of these efforts to comprehend product consumption behavior, no one has
examined these scales, nor any other scales, referent to sport products, specifically licensed sport merchandise.
Although there has been a fair amount of research attempting to explain sport consumption, most of it has focused
on motives for attendance (Fink, Trail, & Anderson, 2002; Funk, Mahony, & Ridinger, 2002; Sloan, 1989; Trail & James,
2001). While there has been some research concerning consumption of licensed sport apparel (Kwon & Armstrong,
2002; Kwon, Trail, & Anderson, 2006), little research has examined the role that consumer values play in the process of
making a purchase decision or in judging the perceived attributes of the sport-related product itself. Accordingly, the
purpose of this study is twofold. The first purpose is to test the psychometric properties of the three scales (MVS, PRS,
and PERVAL) relative to purchasing/owning licensed sport merchandise by examining the factor structure, the construct
reliability, the internal consistency, and the discriminant validity of the subscales. The second purpose is to examine
relationships among items and/or subscales across the three scales for similarities and differences. The third objective is
to determine if differences between consumer values and perceived product attributes exist, and if so, how are they
represented.
3.1. Material Values Scale (MVS)
Richins and Dawson (1992) argued that acquisition and possession are the central theme in materialists’ lives. These
people tend to spend little time on leisure activities because they desire to work longer hours in order to earn more money.
They suggested that consumers’ materialistic behaviors function along the three dimensions of centrality, success, and
happiness, representing their CV. Centrality indicates the degree to which individuals ‘‘place possessions and their
acquisition at the center of their lives’’ (p. 304). Materialists judge standard of success by the number and quality of
possessions they own. Happiness is accomplished through acquisition of possessions rather than personal relationships,
experiences, or achievements.
Richins and Dawson (1992) developed the three-factor MVS and determined it was internally consistent across different
samples. The coefficient alpha for the entire 18-item scale was above .70. In addition, the Chi-square difference-test values
indicated that the predicted three-factor model fit better than either the two-factor or the one-factor model (Richins &
Dawson). Furthermore, Richins (2004) reassessed the 18-item MVS and suggested that a 15-item version demonstrated
better psychometric properties than the 18, 9, 6 or 3-item versions across multiple populations.
92
D. Lee et al. / Sport Management Review 14 (2011) 89–101
3.2. Possession Rating Scale (PRS)
In an extension of the previous work by Richins and Dawson (1992), Richins (1994) investigated the value
(meanings) that possessions have for their owners. From the literature, she identified four potential dimensions:
utilitarianism value, enjoyment, representations of interpersonal ties, and identity/self-expression. After several studies,
Richins proposed 11 different dimensions of values, the four previously mentioned and seven new ones: facilitates
interpersonal ties, represents achievement, symbolizes personal history, financial aspects, appearance-related, status,
and spiritual. We have provided the description of each dimension in Table 1 and have also classified each dimension as
either a consumer value (CV; internally based) or as a perceived product attributes (PPA; externally based). Richins
developed the 23-item scale (PRS) based on a revised version of Dittmar’s Possession Rating Scale and suggested these
11 dimensions (see Richins, 1994, p. 519). However, Richins did not report any internal consistency coefficients or
construct reliability coefficients.
3.3. Perceived Value (PERVAL) Scale
Unlike the consumer values discussed by Richins and Dawson (1992), and as we noted above, perceived product
attributes relate to the ‘‘consumer’s overall assessment of the utility of a product (or service) based on perceptions of what is
received and what is given’’ (Zeithaml, 1988, p. 14). Sweeney and Soutar (2001) argued that previously developed value
factors failed to capture the extensive range of what the customer valued because the focus was primarily on the relationship
between quality and price. Thus, Sweeney and Soutar developed a scale (i.e., PERVAL) based on both utilitarianism and
hedonic components to measure ‘‘consumption values’’ (p. 203) that effect purchase attitudes and behaviors in a retail
setting. They derived two subscales representing the hedonic component: Emotion and Social. For example, emotional value
is ‘‘derived from the feelings or affective states that a product generates’’ (p. 211). On the other hand, social value is ‘‘derived
from the product’s ability to enhance social self-concept’’ (p. 211). In addition, they developed two subscales representing
the utilitarianism component: Price and Quality. For example, price or value for money is ‘‘the utility derived from the
product due to the reduction of its perceived short term and longer term costs’’ (p. 211). Similarly, the perceived quality of a
product is ‘‘the utility derived from the perceived quality and expected performance of the product’’ (p. 211). We propose
that the Emotion and Social dimensions refer to consumer values, whereas the Price and Quality dimensions refer to perceived
product attributes. The PERVAL subscales were internally consistent in measuring consumers’ post purchase experiences
(a = .84–.95; Sweeney & Soutar, 2001). The results indicated that the four-factor model (Quality, Price, Emotion, and Social) fit
better than the three-factor, one-factor, or null model. Sweeney and Soutar also claimed convergent and discriminant
validity.
Although all three of the aforementioned scales have been tested on product consumption, testing these scales
within the licensed sport merchandise context is necessary to determine applicability. Positive psychometric results of
these scales would allow retailers to use them as a reliable and valid tool for better communication with individual
consumers and, as a result, could enhance overall sales of LSM. When retail staffs have a clear understanding of the
nature of consumer values and the perceived attributes of a particular product to the consumer, then they will be able to
develop better marketing strategies rather than relying on mere discounting (Sweeney & Soutar, 2001). However, if
these scales do not have adequate psychometric properties, then it will be necessary to continue scale development in
Table 1
Classification and descriptions of dimensions of the combined scales.
Consumer values (CV)
Refers to
Centrality
Happiness
Success
Enjoyment
Represents interpersonal ties
Facilitates interpersonal ties
Self-expression
Represents achievement
Symbolizes nostalgic appeal
Status
Spiritual
Social
Emotion
Centrality in beliefs of possession
The possession of a certain product that gratifies happiness (i.e., a hedonic value)
The possession of a certain product as a symbol of success
The possession of a certain product that provides enjoyment (i.e., a hedonic value)
Memories of relationships with significant others
Spending time with others
The expression or reinforcement of the sense of the self
The effort to acquire
Memories of personal events or places
The social prestige that a possession entails
A spiritual link to higher forces
The possession of a certain product that gives social approval
The possession of a certain product that escalates one’s emotion
Perceived product attributes (PPA)
Utilitarianism
Financial aspects
Quality
Price
Appearance-related
A product’s usefulness and convenience
The monetary worth of the product
Acceptable standard of quality of the product
Reasonable price of the product
The beauty or attractiveness of the product or enhanced self-image and appearance
D. Lee et al. / Sport Management Review 14 (2011) 89–101
93
an attempt to create scales that will measure consumption values and perceived product attributes that influence the
purchase of LSM.
4. Method
4.1. Sample and procedures
We used a convenience sampling method to survey 319 college students. We collected 117 responses from two physical
activity classes and two lecture classes in a large Mid-western university and 202 responses from several lecture classes in a
large southeastern university. The final sample (N = 312; seven were eliminated due to incompleteness) consisted of 56.9%
males and 43.1% females, with an average age of 21.5 years. Most respondents were U.S. citizens (97.3%). Prior to distributing
the surveys, brief instructions were given to the students about the nature of the study, including purpose of the study,
voluntary participation, and confidentiality of the information they provided.
4.2. Instrumentation
The questionnaire consisted of items from the three existing materialism scales: MVS, PRS, and PERVAL scale. The 18-item
MVS consisted of the three constructs of Centrality (7 items), Happiness (5), and Success (6). The respondents were asked to
rate the extent to which they agreed or disagreed in identifying what affected their consumption of LSM by using a 5-point
Likert-type scale ranging from (1) Strongly Disagree to (5) Strongly Agree.
The 23-item PRS consisted of 11 constructs: Enjoyment (3 items), Represents Interpersonal Ties (3), Facilitates
Interpersonal Ties (1), Utilitarianism (3), Appearance-related (2), Self-expression (2), Spiritual (1), Personal History (3),
Achievement (2), Status (2), and Financial Aspects (1). The respondents were asked to think about a specific piece of LSM and
write it down in the space provided. They were then asked to rate the extent how true or not true each item in the scale was
for them, relative to the piece of sport merchandise they had chosen. The preface to all the items was ‘‘This possession is
important to me because it. . .. . ..’’ and an example of an item is ‘‘provides comfort or emotional security.’’ The response
format was a 7-point Likert-type scale from (1) Not True for Me to (7) Very True for Me.
The 19-item PERVAL scale consisted of four constructs: Price (4 items), Quality (6), Emotion (5), and Social (4). The same
introduction as PRS was given to the respondents except that we emphasized the LSM item should be one that the
respondent had purchased for him or herself and was important. The preface statement was ‘‘I bought this item because
it. . .. . ..,’’ followed by an item such as ‘‘has an acceptable standard of quality.’’ The items were measured on a 7-point Likerttype scale ranging from (1) Strongly Disagree to (7) Strongly Agree. Thus, there were 60 items total from the 3 scales. We also
included several demographic items in the questionnaire.
4.3. Data analysis
We used the RAMONA program available in the SYSTAT 7.0 statistical package and performed three separate
Confirmatory Factor Analyses (CFA), one on each scale (MVS, PRS, and PERVAL), to examine factor loadings of the
items on the pre-specified factors. We used the results of the CFA to test the construct reliability and the discriminant
validity of the subscales within their own scale. We also calculated Cronbach’s alpha coefficients for each pre-specified
factor.
To examine the relationships among all items across the three scales, we used a principal components analysis (PCA) with
direct Oblimin rotation. We used the Scree plot, the eigenvalue criterion and interpretability of dimensions, to determine
how many components should be retained. Items with factor loadings exceeding .6 without a double loading greater than .3
were retained. Tabachnick & Fidell (2001) stated that ‘‘as a general rule of thumb, it is comforting to have a least 300 cases for
factor analysis.’’ (p. 588): thus our sample of 312 was sufficient for a PCA.
We then used a multidimensional scaling technique (Euclidean distance method using ALSCAL program in SPSS) to obtain
additional information about the CV-PPA structure. S-stress tests were reported as an indication of model fit. Stress
values < .05 indicate ‘‘excellent’’, values < .1 indicate ‘‘good’’, values < .2 indicate ‘‘usable’’, and values > .2 indicates uninterpretable model fit (Clarke, 1993, p. 126).
5. Results
Respondents identified the following types of licensed sport merchandise that they had recently purchased for
themselves and that were the focal point of their responses to the items for each scale: hat, visor, jersey, sweatshirt, T-shirt,
short, hooded t-shirt, mug, automobile license plate, jacket, and key chain.
5.1. Model estimation and psychometric properties of scales
MVS. The CFA on the 18-item MVS indicated that the model had reasonable fit (RMSEA, eA = .064; CI = .054, .073;
pclose = .011; x2/df = 296.74/132 = 2.25) as did the CFA on the15-item MVS (RMSEA, eA = .063; CI = .051, .075; pclose = .037,
D. Lee et al. / Sport Management Review 14 (2011) 89–101
94
Table 2
Beta coefficients, means, standard deviations, internal consistency, and average variance extracted for the material values scale (15-item MVS).
Item
Centrality (5)
I put less emphasis on material things than most people I knowa
Buying things gives me a lot of pleasure
I try to keep my life simple, as far as possessions are concerned
I usually buy only the things I needa
The things I own aren’t all that important to mea
Success (5)
I admire people who own expensive home, cars, and clothes
I like to own things that impress people
Some of the most important achievements in life include acquiring material possessions
The things I own say a lot about how well I’m doing in life
I don’t place much emphasis on the amount of material objects people own as a sign of successa
Happy (5)
I wouldn’t be any happier if I owned nicer thingsa
It sometimes bothers me quite a bit that I can’t afford to buy all the things I’d like
I have all the things I really need to enjoy lifea
My life would be better if I owned certain things I don’t have
I’d be happier if I could afford to buy more things
b
M
SD
.528
.607
.515
.282
.699
2.67
3.32
2.77
3.56
2.99
.93
.97
.93
.92
1.06
.633
.682
.584
.451
.497
2.94
3.00
2.03
2.72
2.84
1.03
1.07
.97
.96
.96
.437
.491
.538
.745
.775
3.03
2.41
3.01
2.77
3.02
1.09
1.07
1.06
1.00
1.05
a
AVE
.66
.296
.71
.331
.72
.375
Note. Statistical method: confirmatory factor analysis.
a
Indicates reverse scored items.
x2/df = 193.35/87 = 2.22). Although Richins (2004) suggested that the 15-item version demonstrated better
psychometric properties than the 18, 9, 6 or 3-item versions, we found no significant differences between the
18-item and 15-item versions. Therefore, we selected the more parsimonious one (15-item version). The 15-item MVS
evidenced poor construct reliability for all three subscales as the average variance extracted (AVE) values of each (refer
to Table 2) did not reach the .50 cut-off value (Hair, Anderson, Tatham, & Black, 1998). However, internal consistency for
the three sub-scales (refer to Table 2), centrality (a = .66), success (a = .71), and happiness (a = .72), were either close to or
above the .70 value recommended by Nunnally and Bernstein (1994). Initial discriminant validity was evidenced in that
no correlation between any of the three constructs was within two standard errors of unity (Anderson & Gerbing, 1988).
However, the subscales failed Fornell and Larcker’s (1981) more stringent test of discriminant validity in which the AVE
value for a specific construct should be greater than the squared value of the correlation between that construct and any
other (refer to Table 3).
PRS. The CFA results on the PRS indicated that the model had mediocre fit (RMSEA, eA = .092; CI = .084, .100;
pclose = .000, x2/df = 634.92/178 = 3.57). The AVE values for the interpersonal ties, self-expression, achievement,
utilitarianism, appearance-related, and personal history subscales (refer to Table 4) did not reach the .50 cut-off value.
The internal consistency for each of the eight pre-specified factors was moderate at best (a ranged from .55 to .78; refer
to Table 4). Discriminant validity was evidenced in that only 3 out of 55 correlations were within two standard errors of
unity. However, the following subscales failed the more stringent test for discriminant validity: represents interpersonal
ties, self-expression, achievement, utilitarianism, enjoyment, appearance, status, personal history, facilitates interpersonal
ties, and spirit (refer to Table 5).
PERVAL. The CFA results on the PERVAL scale indicated that the model had poor fit (RMSEA, eA = .100; CI = .092, .108;
pclose = .000, x2/df = 589.18/146 = 4.04). AVE values were less than .50 on two of the subscales: price and quality (refer to
Table 6). Two factors in the PERVAL Scale, emotion (a = .84) and social (a = .90) displayed a high level of internal consistency.
However, quality (a = .74) was borderline, and price (a = .62) was below Nunnally and Bernstein’s (1994) cut-off value (refer
to Table 6). All four constructs met the less stringent test of discriminant validity. However, only the social subscale met the
criterion of the more stringent test (refer to Table 7).
5.2. Principal component analysis
The PCA initially identified 14 components with eigenvalues greater than 1.0. Based on interpretation of the Scree
plot, the loadings, and meaningfulness of the components, we identified 9 components that were interpretable: five that
Table 3
Correlation Table (MVS).
Centrality
Success
Happiness
Centrality
Success
Happiness
1
.877a
.533
1
.641
1
Note. Statistical method: confirmatory factor analysis (EQS).
a
Correlation is not distinct (Kline, 2005).
D. Lee et al. / Sport Management Review 14 (2011) 89–101
95
Table 4
Beta coefficients, means, standard deviations, internal consistency, and average variance extracted for the Possession Rating Scale (PRS).
b
M
SD
.558
.660
.681
3.38
4.30
2.45
2.07
2.06
1.83
.653
.710
4.83
3.96
1.61
1.84
.635
.635
3.67
2.73
1.99
1.77
.873
.334
.619
2.84
4.35
2.30
1.66
1.76
1.62
.666
.827
.714
3.14
3.92
3.99
1.72
1.81
1.86
.648
.709
4.65
3.60
1.70
1.80
.718
.831
3.35
3.12
1.76
1.71
.565
.724
.643
3.47
3.56
4.94
2.06
1.90
1.80
Financial aspects = FINANC (1)
Is valuable in terms of money
2.97
1.85
Facilitates interpersonal ties = FAINTIE (1)
Allows me to spend time or share activities with other people
3.03
1.79
Spiritual = SPIRIT (1)
Provides a spiritual link to divine or higher forces
1.98
1.47
Item
Represents interpersonal ties = REINTIE (3)
Reminds me of my relationship with a particular person
Reminds me of my family or a group of people I belong to
Represents my family heritage or history
Self-expressive = SELFEXP (2)
Allows me to express myself
Expresses what is unique about me, different from others
Represents achievement = REACHIE (2)
Reminds me of my skills, achievements, or goals
Required a lot of effort to acquire or maintain
Utilitarian = UTILIT (3)
Provides me freedom or independence
Has a lot of practical usefulness
Allows me to be efficient in my daily life or work
Enjoyment = ENJOY (3)
Provides comfort or emotional security
Provides enjoyment, entertainment, or relaxation
Improves my mood
Appearance-related = APPEAR (2)
Is beautiful or attractive in appearance
Improves my appearance or the way I look
Status = STATUS (2)
Has social prestige value, gives me social status
Makes others think well of me
Symbolizes personal history = SPERHIS (3)
Reminds me of my childhood
Is a record of my personal history
Reminds me of particular events or places
a
AVE
.67
.404
.63
.465
.55
.403
.65
.419
.78
.546
.62
.462
.74
.604
.68
.419
could be categorized as consumer values (CV) dimensions (Social Approval, Materialism, Covetousness, Prestige/Status, and
Escape) and four that could be categorized as perceived product attributes (PPA) dimensions (Price/Quality, Nostalgia,
Craftsmanship, and Aesthetic Beauty). These items and dimensions explained approximately 55% of the total variance.
Only 30 out of 60 total items from all three scales combined loaded higher than .6 on the interpretable components with
no double-loadings greater than .3 on another component (Table 8). The AVE values ranged from .408 to .632 and the
Cronbach’s alpha values ranged from .525 to .896 (Table 8). None of the correlations from the PCA component
correlation matrix exceeded .48 (evidence for discriminant validity; Table 9). In addition, discriminant validity was
established at the stringent level. More specifically, discriminant validity among the nine constructs from the PCA was
Table 5
Correlation Table (PRS).
1. Represents interpersonal ties
2. Self-expressive
3. Represents achievement
4. Utilitarian
5. Enjoyment
6. Appearance-related
7. Status
8. Symbolizes personal history
9. Financial aspects
10. Facilitates interpersonal ties
11. Spiritual
1
2
3
4
5
6
7
1
.774
.736
.608
.732
.424
.401
.963a
.233
.502
.500
1
.583
.529
.672
.696
.518
.838
.281
.285
.156
1
.370
.488
.349
.419
.762
.502
.374
.494
1
.955a
.675
.491
.503
.072
.704
.401
1
.813
.578
.741
.196
.729
.375
1
.720
.485
.402
.453
.230
1
.454
.424
.539
.225
Note. Statistical method: confirmatory factor analysis (EQS).
a
Correlation is not distinct (Kline, 2005).
8
9
10
11
1
.230
.399
.365
1
.174
.253
1
.476
1
D. Lee et al. / Sport Management Review 14 (2011) 89–101
96
Table 6
Beta coefficients, means, standard deviations, internal consistency, and average variance extracted for the Perceived Value (PERVAL) Scale.
Item
Emotion (5)
Is one that I would enjoy
Would make me want to use it
Is one that I would feel relaxed about using
Would make me feel good
Would give me pleasure
Quality (6)
Has poor workmanshipa
Would not last a long timea
Would perform consistently
Has consistent quality
Is well made
Has an acceptable standard of quality
Price (4)
Is reasonably priced
Offers value for money
Is a good product for the price
Would be economical
Social (4)
Would give its owner social approval
Would make a good impression on other people
Would help me to feel acceptable
Would improve the way I am perceived
b
M
SD
.792
.785
.710
.699
.640
5.45
4.79
5.12
4.47
4.56
1.30
1.67
1.47
1.49
1.58
.317
.053
.730
.754
.712
.800
6.06
5.54
4.93
4.75
5.29
5.20
1.20
1.56
1.46
1.40
1.29
1.33
.632
.300
.829
.593
4.77
3.37
5.04
3.76
1.51
1.75
1.37
1.70
.830
.845
.798
.849
3.85
3.87
3.32
3.44
1.70
1.63
1.67
1.69
a
AVE
.84
.529
.74
.392
.62
.382
.90
.690
Note. Statistical method: confirmatory factor analysis.
a
indicate reverse scored items
Table 7
Correlation table (PERVAL).
Emotion
Quality
Price
Social
Emotion
Quality
Price
Social
1
.864a
.734
.652
1
.775
.479
1
.374
1
Note. Statistical method: confirmatory factor analysis (EQS).
a
Correlation is not distinct (Kline, 2005).
evidenced in that the AVE value was greater than the squared correlation between that construct and any others
(Fornell & Larcker, 1981).
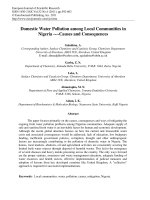
5.3. Multidimensional scaling (MDS)
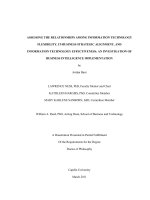
MDS created a visual map exhibiting relative relationships among values on a two-dimensional configuration.
Coefficients of alienation for the two-dimensional solution indicated an excellent fit (Young’s S-stress < .04; Clarke, 1993).
The stress test indicates ‘‘the proportion of the variance of the disparities not accounted for by the MDS model’’ (Hair et al.,
1998, p. 540). The visual projections of the two-dimensional solution of the hypothesis were also interpretable (refer to
Fig. 1). This pattern provides additional information supporting discriminant validity.
6. Discussion
This study examined the psychometric properties of three values scales: the MVS (Richins & Dawson, 1992), the PRS
(Richins, 1994), and the PERVAL scale (Sweeney & Soutar, 2001). In addition, we investigated the relationships among the
items across the three scales in an attempt to distinguish between the items measuring ‘‘consumer values’’ that influence
product purchases and the items representing ‘‘perceived attributes’’ of a product.
6.1. Overview of the significant findings
The 15-item MVS had reasonable fit and was comparable to the findings of Richins and Dawson’s (1992) for non-sport
consumers. However, in that research they did not report either construct reliability or discriminant validity values. More
recently Richins (2004) noted that the original 18-item MVS had ‘‘some imperfect psychometric properties’’ (p. 212) and
D. Lee et al. / Sport Management Review 14 (2011) 89–101
97
Table 8
Factor loadings for the three scales combined (PCA).
Item
1
Social1
Social3
Social2
Social4
Centrality3
Centrality6
Centrality2
Price3
Quality3
Price1
Quality5
Quality4
Stimulate Personal History2
Represents Achievement1
Represents Interpersonal Tie2
Stimulate Personal History3
Represents Interpersonal Tie1
Happy4
Happy5
Happy3
Quality1
Quality2
Utilitarianism1
Facilitate Interpersonal Tie
Enjoy2
Enjoy1
Finance
Represents Achievement2
Appearance-related1
Appearance-related2
.812
.780
.745
.686
2
3
4
5
6
7
8
10
.774
.687
.613
.874
.711
.706
.660
.639
.672
.637
.631
.627
.627
.804
.727
.703
À.733
À.701
.872
.846
.819
.619
.732
.697
À.709
À.684
AVE
a
.573
.896
.482
.666
.522
.800
.408
.787
.556
.727
.514
.525
.632
.865
.511
.693
.468
.620
Note. Extraction method: Principal Component Analysis. Rotation method: Oblimin with Kaiser Normalization.
Table 9
Correlations for the three scales combined.
1
1.
2.
3.
4.
5.
6.
7.
8.
9.
Social approval
Materialism
Price/quality
Nostalgia
Covetousness
Craftsmanship
Escape
Prestige/status
Aesthetic beauty
2
3
4
5
6
7
8
9
1
.03
.11*
.24**
À.02
.06
.11*
.15*
1
.21**
.04
.14*
.18**
.12*
.29**
1
.07
À.15*
.46**
.40**
.30**
1
À.11
.14*
.17**
.21**
1
À.16**
À.16**
À.02
1
.37**
.41**
1
.45**
1
1
.13*
.35**
.40**
.16**
À.20**
.48**
.39**
.44**
Note. Statistical method: principle component analysis (SPSS).
*
Correlation is significant at the .05 level.
**
Correlation is significant at the .01 level.
thus, she recommended that a shorter version (15-item) be used instead. Unfortunately, we found that in the present sample
the 15-item version had construct reliability and discriminant validity problems as well.
We also found that the CFA on the PRS did not indicate good model fit and both convergent and discriminant validity tests
failed at the stringent level. We could not compare these results to Richins’ (1994) study because no model test or
psychometric tests were performed in that research.
The PERVAL scale also displayed poor model fit and although two subscales had construct reliability, the scale generally
failed reliability and discriminant validity tests. This does not support the previous reliability and discriminant validity
results reported by Sweeney and Soutar (2001) in a non-sport consumer sample.
In sum, the psychometric properties for all three scales indicated that the designated items did not represent the referent
constructs well in this data set. This may be due to the potential distinctiveness of LSM relative to other goods in the SEC
paradigm. These scales may measure search goods adequately, but the added value of the association with the team brand
for LSM might make LSM more similar to an experience good or credence good, thus potentially limiting the applicability of
the MVS, PRS, or PERVAL. Therefore, we performed a PCA on the combined items to determine whether we could discover
better constructs and to determine similarities among items across the three scales. The PCA indicated 14 dimensions with
eigenvalues greater than 1, but only 9 were interpretable; 5 that could be categorized as consumer values (CV) dimensions
D. Lee et al. / Sport Management Review 14 (2011) 89–101
98
Fig. 1. Hypothetical structure of relations among consumer values and perceived product attributes.
(Social Approval, Materialism, Covetousness, Prestige/Status, and Escape) and 4 that could be categorized as perceived product
attributes (PPA) dimensions (Price/Quality, Nostalgia, Craftsmanship, and Aesthetic Beauty). These nine dimensions combined
explained 55% of the total variance.
6.2. Consumer value dimensions
Factor 1 consists of the four items from the PERVAL social subscale referring to purchasing products to achieve Social
Approval and had good construct reliability and internal consistency. Although those items were designed to be product
related, they seem to be more like Consumer Values than Perceived Product Attributes. Holt’s (1995) idea supports this
supposition in that consumers seek object meanings through affiliating action. Richins’ (1994) and Sweeney and Soutar’s
(2001) suggestions are also consistent with our scheme in that products boost one’s social self-concept and this eventually
influences one’s social relationships (e.g., acceptance by others). Factor 1 seems to be conceptually related to the notion of
basking in reflected glory (BIRGing). In sport spectating situations, fans tend to psychologically associate themselves with
others who are successful (Cialdini et al., 1976; Wann & Branscombe, 1990).
Factor 2 consists of three items from the MVS scale: all from the Centrality subscale. Both the construct reliability and
internal consistency of this scale were a little below typical benchmarks. This indicates that these items need further
refinement. However, the content of this factor seems to be similar to the concept of Materialism, which was defined by Belk
(1984) as ‘‘the importance a consumer attaches to worldly possessions. At the highest levels of materialism, such possessions
assume a central place in a person’s life and are believed to provide the greatest sources of satisfaction and dissatisfaction’’
(p. 291). These results are consistent with Richins and Dawson’s (1992) findings, in that participants acknowledged that they
are likely to possess or acquire products solely for the joy of acquisition. Richins and Dawson stated that, ‘‘materialists view
themselves as successful to the extent they can possess products that project desired self-images’’ (p. 304). For instance,
college students may tend to possess or acquire quality licensed sport products in order to impress others as a sign of success.
Factor 5 consists of three items from the Happiness subscale of the MVS and shows adequate construct reliability and
internal consistency. Although these items originally were designed to represent happiness, they may refer to Covetousness.
These items seem to represent the desire to be able to own things that are not obtainable at the moment. For instance, one
item depicted the consumer’s desire to buy more things (I’d be happier if I could afford to buy more things). Another item was
D. Lee et al. / Sport Management Review 14 (2011) 89–101
99
‘‘My life would be better if I owned certain things that I don’t have.’’ Consumers who score highly on this subscale tend to feel
their life could be improved if they could just buy things that they want but cannot afford.
Factor 7 consists of four items from the PRS scale: two from the Enjoyment subscale and one each from the Utilitarianism
and the Facilitate-Interpersonal-Ties subscale. This factor indicates very good construct reliability and internal consistency.
These items seem to represent the consumer values of Escape, or the opportunity to spend time or share activities with other
people. For instance, one item indicated the consumer’s desire to find relaxation and entertainment and another item
represented freedom to do whatever the consumer wanted, (i.e., an escape from the confinements of a job). Individual
consumers tend to perceive the possession of the merchandise as an instrument to satiate their escape values. Accordingly,
this concept may be similar to the escape motive found in the spectator sports literature (Milne & McDonald, 1999; Trail &
James, 2001; Wann, 1995).
We named Factor 8 Prestige/Status. It consists of two items from the Finance and Represents Achievement subscales of the
PRS. The construct reliability and internal consistency are borderline at best. These items may indicate an evaluation of the
product relative to its social value that is ‘‘derived from the product’s ability to enhance social self-concept’’ (Sweeney &
Soutar, 2001, p. 211). Accordingly, individuals tend to judge a product’s worth in terms of its comparative perceived benefits
such as social prestige that reflects one’s social status.
6.3. Perceived product attribute dimensions
Factor 3 consists of two items from the PERVAL Price subscale and four items from the PERVAL Quality subscale and has good
internal consistency, but the construct reliability needs to be improved. This factor refers to the product being reasonably priced
and having good quality. Thus we named the dimension Price/Quality. This result is consistent with Dodds, Monroe, and
Grewal’s (1991) study, in that price becomes a yardstick to judge the quality of a product. The result is also consistent with the
findings of Sweeney and Soutar’s (2001) and Richins’ (1994; 2004) studies which show that financial aspects stimulate
consumers to purchase products. In addition to the price of products, sports consumers seem to be concerned about quality of
the merchandise they purchase. This interpretation is similar to Holt’s (1995) classification of baseball spectators based on their
consuming patterns and their evaluation of product prices. That is, the consumer compares the price of the product to the
perceived quality of the product, and then determines whether or not to make the purchase.
Factor 4 includes two items from the Represents Interpersonal Ties subscale of the PRS, and one item each from the
Personal History and Achievement subscales of the PRS. The internal consistency was adequate, but the construct reliability
indicates that the scale needs to be improved. This factor seems to represent the individual’s personal history including
personal skills, goals and achievements. The purchased products represent a personal experience because the products
induce memories of particular events, places, or persons (nostalgic appeal). This may be related to the concept of
identification in spectator sports. More specifically, individuals may want to remember or symbolize a historical moment
related to sports by associating themselves with the event, sport, or team/athlete (Branscombe & Wann, 1991; Foote, 1951).
Thus we name this factor Nostalgia.
Factor 6 consists of two items from the PERVAL Quality subscale and represents Craftsmanship. This indicates an
evaluation of the product relative to its utilitarianism aspects, in contrast to its hedonic value (Dhar & Wertenbroch, 2000).
Although only two items load on this factor and cause it to have poor internal consistency, it has adequate construct
reliability. Because the items are negatively worded they may differ solely because of method error. This scale needs
additional items and improved psychometrics, but it is retained for future study.
Factor 10 consists of two items from the Appearance-Related PRS subscale. These items refer to the Aesthetic Beauty of the
product and how the apparel made the wearer look. The external aesthetic features of a product are an important aspect of
perceived product attributes; however, an item that refers to improving the appearance of the consumer may be construed
as more of a consumer value. Thus, this factor may be a combination of both CV and PPA. This is also a dimension that needs
further evaluation as both the internal consistency and construct reliability were below typical benchmarks.
Factors 9, 11–14 are not interpretable because each has only one item that loaded above .5 on the factor. In addition,
Factors 9, 13, and 14 are very general in nature and discuss the importance of possessions. Factor 11 is related to practicality
of a product. Because products can be important for many reasons, this item is judged to be an umbrella concept and is not
included. Factor 14 should have loaded on Factor 5 (Covetousness), but probably did not because it was negatively worded.
6.4. Structural relationships among CVs and PPAs
The PCA correlation matrix indicated that all of the dimensions were distinct as none of the correlations were greater than
.32. However, the correlation matrix does not provide easily determinable evidence of the relationships other than the
bivariate correlations. The multidimensional scaling method provides support for extending the comprehensiveness of the
dimensions measuring consumption values that impact product purchase, in this specific case, licensed sport merchandise,
beyond the measures proposed by Richins (1994), Richins and Dawson (1992), and Sweeney and Soutar (2001). It also
provides additional information that supports the hypothetical structure of relations among CVs and PPAs. The factors are
clearly distinguishable on the two-dimensional space (Fig. 1). For example, based on the arbitrary vertical and horizontal
lines within the two-dimensional space, the value clusters located on the right side of the circle (i.e., Nostalgia, Aesthetic
Beauty, Price/Quality, and Craftsmanship) connote the perceived product attributes (PPA) of licensed sport products relative
100
D. Lee et al. / Sport Management Review 14 (2011) 89–101
perhaps to specific perceived attributes of the product. On the other hand, the value clusters located on the left side of the
circle (i.e., Escape, Social Approval, Prestige/Status, Covetousness, and Materialism) represent consumer values (CV), which are
beliefs that act as guiding principles toward purchase behavior of LSM. In addition, the constructs could be further classified
into subcategories based on contextual themes. For instance, the PPA dimension was classified into two sub-categories: a
symbolic category represented by Nostalgia and Aesthetic Beauty, and a functional/utilitarian category represented by Price/
Quality and Craftsmanship. The CV dimension was classified into two subcategories: a social category represented by Social
Approval, Prestige/Status, and Escape, and a hedonic category represented by Covetousness and Materialism.
In sum, these findings indicate the existence of at least two dimensions that measure drive for consumption of licensed
sport merchandise: CV and PPA. Furthermore, these dimensions are comprised of sub-dimensions with different categories.
The results also support a more comprehensive representation of consumption values than those proposed by Richins
(1994), Richins and Dawson (1992) and Sweeney and Soutar (2001) and thus theoretically should be able to predict
consumption behavior better.
The CV and PPA dimensions lend credibility to LSM’s capacity and means to provide added value to the users. This is
important evidence that differentiates LSM from other products and indicates that it may not fit easily within the SEC
paradigm as solely a search good, an experience good, or a credence good. It may be some combination of the three. More
specifically, consumption of LSM may offer an opportunity for consumers to be psychologically connected to their favorite
sport team, and thus it is endowed with added value (e.g., vicarious achievement) on top of its common utilitarian function
(e.g., as a garment). This premise is consistent with what we found in that various personal values and perceived product
attributes affected an individual’s perception of LSM. The multidimensional scaling results support this premise. The
participants indicated that they considered the utilities of LSM such as price, quality, and craftsmanship of the products (i.e.,
functional/utilitarian values) as important. At the same time, the participants also indicated that they considered many other
unique assets that LSM (e.g., a University of Florida’s football team jersey) offers but general consumer products (e.g., a dress
shirt) may not. For example, the participants indicated that they purchased LSM because the product has symbolic (e.g.,
nostalgic and/or association with the university athletic team), materialistic, and social (e.g., social acceptance and escape)
value that is important for the consumer. However, as noted below, considerably more work needs to be done.
6.5. Limitations of the study
This study may be limited by its sample (college students) from a face validity standpoint, but the sample is not likely to
negatively affect the reliability or construct reliability of these subscales, which is one of the foci of this research. In addition,
although use of samples from diverse populations would benefit this kind of study, it does not deteriorate from an attempt to
explain purchase behavior because college students often actively engage in merchandise buying, especially merchandise
indicating support for their school. Another potential limitation is the rationale regarding the number of the factors and
rotational scheme used in the PCA (Tabachnick & Fidell, 2001).
6.6. Recommendations
Based on these results, several things are apparent. First, even though the fit indices and construct validity measures of
the initial three scales (MVS, PRS, and PERVAL) were not sufficient, when the items were combined across all three scales, no
item loaded on a factor with an item from another scale. This could mean two things. One, because of different response
formats, items only loaded with similarly formatted items. Or, two, even though there was not necessarily good discriminant
validity within each scale, the subscales are distinct across scales. Second, there seem to be distinctions between personal
values and the perceived attributes of an object. Items did tend to load on factors that represented this distinction, with one
exception (the Aesthetic Beauty factor). Third, it is readily apparent that future research needs to develop more valid and
reliable scales to measure consumer values and perceived product attributes. In addition, it is evident that these items and
scales, although more comprehensive than the previous ones, still only explain a little over half of the total variance of
consumption values and product attributes for consuming LSM when all of the items were considered. This indicates that
there are additional items and dimensions that exist and need to be identified. Richins (1994), Richins and Dawson (1992),
and Sweeney and Soutar (2001) have provided an excellent starting point. However, for this sample, these scales did not
work adequately. Although Richins and Dawson suggested that Kahle, Beatty, and Homer (1986) oversimplified a ‘‘complex
psychological phenomena’’ (p. 308), it may be necessary to reexamine the List of Values (LOV) scale or to use the more
comprehensive list of personal values from other scholarly works including Rokeach (1973a, 1973b) and Schwartz (1992) to
determine the relevance of personal values on consumption of licensed sport merchandise. From the standpoint of perceived
product attributes dimensions, the constructs and items from this analysis may be sufficient with minor modifications to
create a scale representing the perceived worth of a consumer product.
References
Anderson, J. C., & Gerbing, D. W. (1988). Structural equation modeling in practice: A review and recommended two-step approach. Psychological Bulletin, 103, 411–
423.
Belk, R. W. (1984). Three scales to measure constructs related to materialism: Reliability, validity, and relationships to measures of happiness. Advances in
Consumer Research, 11, 291–296.
D. Lee et al. / Sport Management Review 14 (2011) 89–101
101
Bloch, P. H., & Richins, M. L. (1983). A theoretical model for the study of product importance perceptions. Journal of Marketing, 47, 69–81.
Branscombe, N. R., & Wann, D. L. (1991). The positive social and self concept consequences of sports team identification. Journal of Sport and Social Issues, 15, 115–
127.
Brochstein, M. (Ed.). (2006). The Sports Licensing Report. EPM Communications, Inc. (Online newsletter provider). Retrieved from />html/licensing/sports_licensing.html (29.10.06).
Cialdini, R. B., Borden, R. J., Thorne, A., Walker, M. R., Freeman, S., & Sloan, L. R. (1976). Basking in reflected glory: Three (football) field studies. Journal of Personality
and Social Psychology, 34, 366–375.
Clarke, K. R. (1993). Non-parametric multivariate analyses of changes in community structure. Australian Journal of Ecology, 18, 117–143.
Darby, M. R., & Karni, E. (1973). Free competition and the optimal amount of fraud. Journal of Law and Economics, 16, 67–88.
Dhar, R., & Wertenbroch, K. (2000). Consumer choice between hedonic and utilitarian goods. Journal of Marketing Research, 37, 60–71.
Dodds, W. B., Monroe, K. B., & Grewal, D. (1991). Effects of price, brand, and store information on buyers’ product evaluations. Journal of Marketing Research, 28,
307–319.
Ekelund, R. B., Jr., Mixon, F. G. J., & Ressler, R. W. (1995). Advertising and information: An empirical study of search, experience and credence goods. Journal of
Economic Studies, 22, 33–43.
Fink, J. S., Trail, G. T., & Anderson, D. F. (2002). An examination of team identification: Which motives are most salient to its existence? International Sports Journal,
6, 195–207.
Foote, N. N. (1951). Identification as the basis for a theory of motivation. American Sociological Review, 16, 14–21.
Ford, G. T., Smith, D. B., & Swasy, J. L. (1988). An empirical test of the search, experience and credence attributes framework. Advances in Consumer Research, 15,
239–244.
Fornell, C., & Larcker, D. F. (1981). Evaluating structural equation models with unobservable variables and measurement error. Journal of Marketing Research, 18,
39–50.
Franke, G. R., Huhmann, B. A., & Mothersbaugh, D. L. (2004). Information content and consumer readership of print ads: A comparison of search and experience
products. Journal of Academy of Marketing Science, 32(1), 20–31.
Funk, D. C., Mahony, D. F., & Ridinger, L. L. (2002). Characterizing consumer motivation as individual difference factors: Augmenting the sport interest inventory
(SII) to explain level of sport. Sport Marketing Quarterly, 11, 33–43.
Gutman, J. (1982). A means-end chain model based on consumer categorization processes. Journal of Marketing, 46, 60–72.
Hair, J. F., Jr., Anderson, R. E., Tatham, R. L., & Black, W. C. (1998). Multivariate data analysis (5th ed.). Upper Saddle River, NJ: Prentice-Hall Inc.
Helgeson, J. G., Kluge, E. A., Mager, J., & Taylor, C. (1984). Trends in consumer behavior literature: A content analysis. Journal of Consumer Research, 10, 449–454.
Holt, D. B. (1995). How consumers consume: A typology of consumption practices. Journal of Consumer Research, 22, 1–16.
Howard, D. R., & Crompton, J. L. (2004). Sport in the new millennium. Financing sport (2nd ed.). Morgantown, WV: Fitness Information Technology Inc.
Huang, P., Lurie, N. H., & Mitra, S. (2009). Searching for experience on the web: An empirical examination of consumer behavior for search and experience goods.
Journal of Marketing, 73(2), 55–69.
Kahle, L. R., Beatty, S. E., & Homer, P. (1986). Alternative measurement approaches to consumer values: The list of values (LOV) and values and life style (VALS).
Journal of Consumer Research, 13, 405–409.
Kline, R. B. (2005). Principles and practice of structural equation modeling. New York: The Guilford Press.
Kwon, H. H., & Armstrong, K. L. (2002). Factors influencing impulse buying of sport licensed merchandise. Sport Marketing Quarterly, 11, 151–163.
Kwon, H. H., Trail, G. T., & Anderson, D. (2006). Points of attachment (identification) and licensed merchandise consumption among American college students.
International Journal of Sport Management, 7, 347–360.
Milne, G. R., & McDonald, M. A. (1999). Sport marketing: Managing the exchange process. Sudbury, MA: Jones and Bartlett Publishers.
Nelson, P. (1970, March/April). Information and consumer behavior. Journal of Political Economy, 78, 311–329.
Nunnally, J. C., & Bernstein, I. H. (1994). Psychometric Theory (3rd ed.). New York: McGraw-Hill.
Pitts, R.E., Jr. & Woodside, A. G. (Eds.). (1984). Personal values and consumer psychology. DC: Heath and Company.
Reynolds, T. J., & Gutman, J. (1988). Laddering theory, method, analysis, and interpretations. Journal of Advertising Research, 28, 11–31.
Richins, M. L. (2004). The material values scale: Measurement properties and development of a short form. Journal of Consumer Research, 31, 209–219.
Richins, M. L. (1994). Valuing things: The public and private meanings of possessions. Journal of Consumer Research, 21, 504–521.
Richins, M. L., & Dawson, S. (1992). A consumer values orientation for materialism and its measurement: Scale development and validation. Journal of Consumer
Research, 19, 303–316.
Rokeach, M. (1973a). The nature of human values. New York: The Free Press.
Rokeach, M. (1973b). Understanding human values: Individual and societal. New York: The Free Press.
Schwartz, S. H. (1992). Universals in the content and structure of values: Theoretical advances and empirical tests in 20 countries. In Zanna, M. (Ed.). Advances in
experimental social psychology. Vol. 25 (pp.1–65). Orlando, FL: Academic
Schwartz, S. H., & Bilsky, W. (1990). Toward a theory of the universal content and structure of values: Extensions and cross-cultural replications. Journal of
Personality and Social Psychology, 58(5), 878–891.
Shank, M. D. (2002). Sports marketing: A strategic perspective (2nd ed.). Upper Saddle River, NJ: Prentice Hall.
Sloan, L. R. (1989). The motives of sports fans. In J. H. Goldstein (Ed.), Sports, games, and play: Social & psychological viewpoints (2nd ed., pp. 175–240). Hillsdale, NJ:
Lawrence Erlbaum Associates.
Sweeney, J. C., & Soutar, G. N. (2001). Consumer perceived value: The development of a multiple item scale. Journal of Retailing, 77, 203–220.
Tabachnick, B. G., & Fidell, L. S. (2001). Using multivariate statistics. Needham Heights, MA: Pearson Education Company.
The making of the $213 billion sports business industry. (1999, December 20–26). Sports Business Journal, 2, 24–25.
Trail, G. T., & James, J. D. (2001). The motivation scale for sport consumption: A comparison of psychometric properties with other sport motivation scales. Journal
of Sport Behavior, 24, 108–127.
Vinson, D. E., Scott, J. E., & Lamont, L. M. (1977). The role of personal values in marketing and consumer behavior. Journal of Marketing, 41, 44–50.
Wann, D. L. (1995). Preliminary validation of the Sport Fan Motivation Scale. The Journal of Sport & Social Issues, 20, 377–396.
Wann, D. L., & Branscombe, N. R. (1990). Die-hard and fair weather fans: Effects of identification on BIRGing and CORFing tendencies. Journal of Sport and Social
Issues, 14, 103–117.
Zeithaml, V. A. (1988). Consumer perceptions of price, quality and value: A means-end model and synthesis of evidence. Journal of Marketing, 51, 2–22.
.