Relation of Visual Function to Retinal Nerve Fiber Layer Thickness in Multiple Sclerosis
Bạn đang xem bản rút gọn của tài liệu. Xem và tải ngay bản đầy đủ của tài liệu tại đây (207.39 KB, 9 trang )
Relation of Visual Function to Retinal
Nerve Fiber Layer Thickness
in Multiple Sclerosis
Jennifer B. Fisher, BS,1 Dina A. Jacobs, MD,1 Clyde E. Markowitz, MD,1 Steven L. Galetta, MD,1
Nicholas J. Volpe, MD,1 M. Ligia Nano-Schiavi, CO, COA,1 Monika L. Baier, PhD,2
Elliot M. Frohman, MD, PhD,3 Heather Winslow, MD,3 Teresa C. Frohman, BA,3 Peter A. Calabresi, MD,4
Maureen G. Maguire, PhD,1 Gary R. Cutter, PhD,2 Laura J. Balcer, MD, MSCE1
Purpose: To examine the relation of visual function to retinal nerve fiber layer (RNFL) thickness as a
structural biomarker for axonal loss in multiple sclerosis (MS), and to compare RNFL thickness among MS eyes
with a history of acute optic neuritis (MS ON eyes), MS eyes without an optic neuritis history (MS non-ON eyes),
and disease-free control eyes.
Design: Cross-sectional study.
Participants: Patients with MS (n ϭ 90; 180 eyes) and disease-free controls (n ϭ 36; 72 eyes).
Methods: Retinal never fiber layer thickness was measured using optical coherence tomography (OCT; fast
RNFL thickness software protocol). Vision testing was performed for each eye and binocularly before OCT
scanning using measures previously shown to capture dysfunction in MS patients: (1) low-contrast letter acuity
(Sloan charts, 2.5% and 1.25% contrast levels at 2 m) and (2) contrast sensitivity (Pelli–Robson chart at 1 m).
Visual acuity (retroilluminated Early Treatment Diabetic Retinopathy charts at 3.2 m) was also measured, and
protocol refractions were performed.
Main Outcome Measures: Retinal nerve fiber layer thickness measured by OCT, and visual function test
results.
Results: Although median Snellen acuity equivalents were better than 20/20 in both groups, RNFL thickness
was reduced significantly among eyes of MS patients (92 m) versus controls (105 m) (PϽ0.001) and
particularly was reduced in MS ON eyes (85 m; PϽ0.001; accounting for age and adjusting for within-patient
intereye correlations). Lower visual function scores were associated with reduced average overall RNFL thickness in MS eyes; for every 1-line decrease in low-contrast letter acuity or contrast sensitivity score, the mean
RNFL thickness decreased by 4 m.
Conclusions: Scores for low-contrast letter acuity and contrast sensitivity correlate well with RNFL thickness as a structural biomarker, supporting validity for these visual function tests as secondary clinical outcome
measures for MS trials. These results also suggest a role for ocular imaging techniques such as OCT in trials that
examine neuroprotective and other disease-modifying therapies. Although eyes with a history of acute optic
neuritis demonstrate the greatest reductions in RNFL thickness, MS non-ON eyes have less RNFL thickness than
controls, suggesting the occurrence of chronic axonal loss separate from acute attacks in MS patients.
Ophthalmology 2006;113:324 –332 © 2006 by the American Academy of Ophthalmology.
Visual dysfunction is a leading cause of disability in
multiple sclerosis (MS).1,2 As many as 50% of patients
with MS experience visual loss as a presenting symptom,
and 80% develop some degree of visual impairment
during the course of their disease.1,3,4 Visual symptoms
in MS may be present even among patients with normal
Snellen acuities and in those with no history of acute optic
neuritis.5–10
Originally received: June 1, 2005.
Accepted: October 20, 2005.
Manuscript no. 2005-476.
1
Division of Neuro-ophthalmology, Departments of Neurology, Ophthalmology, and Biostatistics, University of Pennsylvania School of Medicine,
Scheie Eye Institute, Philadelphia, Pennsylvania.
2
Department of Biostatistics, University of Alabama, Birmingham,
Alabama.
3
Department of Neurology, University of Texas Southwestern Medical
Center, Dallas, Texas.
4
Department of Neurology, Johns Hopkins University School of Medicine,
Baltimore, Maryland.
Presented at: American Academy of Ophthalmology Annual Meeting,
October, 2005; Chicago, Illinois.
Supported in part by the National Institutes of Health, Bethesda, Maryland
(grant nos.: R01 EY 013273, R01 EY 014993) (LJB); National Multiple
Sclerosis Society, New York, New York (grant nos.: RG 3208-A-1, RG
3428A2/1, PP1115) (LJB); McNeill Foundation, Philadelphia, Pennsylvania (LJB); and Doris Duke Foundation, New York, New York (JBF).
No conflicting relationships exist.
Correspondence and reprint requests to Laura J. Balcer, MD, MSCE, 3 East
Gates Building, 3400 Spruce Street, Philadelphia, PA 19104. E-mail:
324
© 2006 by the American Academy of Ophthalmology
Published by Elsevier Inc.
ISSN 0161-6420/06/$–see front matter
doi:10.1016/j.ophtha.2005.10.040
Fisher et al ⅐ Retinal Nerve Fiber Layer Thickness in Multiple Sclerosis
Despite the importance of vision to disability and quality
of life in MS, the quantitative assessment of visual function
in clinical trials traditionally has been limited to nonstandardized tests of Snellen acuity, a method that does not
capture visual loss in most MS patients. The extent to which
vision may be affected by standard and novel disease-modifying therapies for MS is not yet known, and even the newest
clinical outcome measure, the MS Functional Composite
(MSFC), lacks a component for visual assessment.11–14
Recent cross-sectional and longitudinal studies have
demonstrated that low-contrast letter acuity (Sloan charts)
and contrast sensitivity (Pelli–Robson charts) have the
greatest capacity to capture visual dysfunction in MS patients.15,16 In addition, Sloan and Pelli–Robson chart tests
are clinically practical, demonstrate high degrees of interrater reliability,10,17 and correlate with visual evoked potential testing in MS patients.18,19 Sloan charts have been
incorporated into several recent MS clinical trials,15,16 and
Pelli–Robson testing was used as a primary outcome in the
Optic Neuritis Treatment Trial.20 –24 Testing for each of
these measures may be performed binocularly to capture
overall function with both eyes open,25–27 or with each eye
separately to reflect individual optic nerve function.
Correlation with biological markers of disease is one of
the most important considerations in the assessment of
validity for clinical outcome measures. Traditionally in MS,
standard brain magnetic resonance imaging (MRI) techniques have provided information regarding disease burden,
with emphasis on inflammation and demyelination. However, the capacity for MRI techniques to quantify precisely
axonal and neuronal loss within the brain has been limited
to research methods such as diffusion tensor imaging and
magnetic resonance spectroscopy. Furthermore, MRI provides essentially no information regarding chronic disease
in the anterior visual pathways. Although optic neuritis and
acute demyelination are important contributors to visual
dysfunction in MS, irreversible axonal and neuronal degeneration also represent final common pathways to permanent
visual loss.28
Optical coherence tomography (OCT) is a noninvasive
high-resolution technique that uses near infrared light to
measure the thickness of ocular structures, particularly the
retinal nerve fiber layer (RNFL).29 Optical coherence tomography has been used successfully to capture retinal
ganglion cell axon loss in early glaucoma and in other forms
of anterior visual pathway disease, including traumatic optic
neuropathy, chiasmal lesions, and acute optic neuritis.30 –35
In patients with glaucoma and visual field (VF) abnormalities, RNFL thickness has been shown to correlate significantly
with automated perimetry results.30,36 – 40 Optical coherence
tomography is a highly reliable technique for measuring
RNFL thickness. For example, one recent study demonstrated high levels of reproducibility for the third generation
of commercial OCT (OCT-3, Carl Zeiss Meditec, Inc.,
Dublin, CA) in eyes of normal subjects.41 Intraclass correlation coefficients calculated for RNFL thickness both before
and after pharmacologic pupillary dilation demonstrated high
degrees of test–retest and interobserver reliability (intraclass
correlation coefficients, 0.79 – 0.83). Intravisit and intervisit
standard deviations (SDs) were Ͻ3 m.
Unlike MRI measures of brain or optic nerve atrophy,
OCT provides a unique opportunity to measure a structure
within the central nervous system that consists of isolated
axons (because axons within the RNFL are not myelinated).
Accessibility of the retina for imaging and the capacity to
correlate directly RNFL thickness with visual function make
OCT a strong candidate biomarker for clinical trials of MS and
optic neuritis. Although pilot studies have demonstrated
reductions in overall average RNFL thickness in MS and in
acute optic neuritis,34,35 the relation of RNFL thickness to
visual function in heterogeneous MS cohorts has not been
established.
The purpose of our investigations was to examine the
relation of visual function to RNFL thickness as a structural
biomarker for axonal loss in MS. We also sought to compare RNFL thicknesses among MS eyes with a history of
acute optic neuritis (MS ON eyes), MS eyes without an optic
neuritis history (MS non-ON eyes), and eyes of disease-free
controls. Because the MS disease process affects multiple
regions of the central nervous system, we explored the relation
of RNFL thickness to measures of overall neurologic impairment.
Materials and Methods
Subjects
Patients and disease-free control subjects in the MS Vision Prospective Cohort Study,15 an ongoing investigation of visual outcome measures, were invited to participate. Multiple sclerosis was
diagnosed by standard clinical and neuroimaging criteria.42 Disease duration, disease-specific therapies (e.g., immunomodulatory
agents) and their duration, and MS disease phenotype (relapsing–
remitting, secondary progressive, primary progressive) were ascertained for each MS patient. Patients with comorbid ocular conditions not related to MS (ascertained by a detailed history and
examination) were excluded. A history of Ն1 episodes of acute
optic neuritis was determined for eyes of MS patients by selfreport and physician report and confirmed by medical record
review. Patients experiencing an acute attack of optic neuritis and
those whose most recent attack had occurred less than 1 month
prior were not included in these analyses. Optic disc swelling was
not noted among any study participants.
Disease-free control participants were recruited from among
staff and family members of patients and had no history of ocular
or neurologic disease. Patients and controls with refractive error in
the absence of other ocular comorbidities were invited to participate to best capture the ocular status of patients who may participate in MS trials. Although no absolute criteria for refractive error
were used for participation, one patient with MS was excluded on
the basis of severe congenital myopia (ϽϪ15.00 spherical equivalent [SE]). Multiple sclerosis patients were excluded if Snellen
visual acuity (VA) equivalents were worse than 20/200 in both
eyes, because this would preclude testing of low-contrast letter
acuity; control eyes were required to have acuities of 20/20 or
better. Institutional review board approval was obtained. All participants provided written informed consent, and the study was
conducted in accord with regulations of the Health Insurance
Portability and Accountability Act.
325
Ophthalmology Volume 113, Number 2, February 2006
Visual Function Testing
Participants underwent testing using the following: (1) lowcontrast letter acuity (low-contrast Sloan letter charts, which involve identification of gray letters of progressively smaller size on
a white/retroilluminated background at 2 m; 1.25% and 2.5%
contrast levels; Precision Vision, LaSalle, IL),15,16,43 (2) contrast
sensitivity (Pelli–Robson charts, which capture the minimum contrast level at which patients can perceive letters of a single large
size at 1 m; Lombart Instrument Co., Norfolk, VA),20,44 and (3)
high-contrast VA (Early Treatment Diabetic Retinopathy Study
[ETDRS] charts at 3.2 m; Lighthouse Low-Vision Products, Long
Island City, NY). Sloan charts have a standardized format based on
that of the ETDRS VA charts (5 letters per line).45,46 Each Sloan
chart corresponds to a different contrast level, and charts are
scored based on the number of letters identified correctly. This
format may allow Sloan charts to capture losses of contrast at
small letter sizes that have been reported in MS and other neurologic disorders.47
Pelli–Robson contrast sensitivity charts consist of 16 groups of
3 uppercase letters (triplets, or lines). Letters on this chart are of a
single large size (ϳ20/680 Snellen equivalent).44 Unlike the Sloan
charts, which measure threshold acuity at different levels of contrast, the Pelli–Robson chart provides a measure of contrast sensitivity at a single letter size. All testing was performed for each
eye separately as well as binocularly; binocular testing was included to provide a summary measure of overall visual functioning
with both eyes open.25
Monocular and binocular summary scores for visual function
tests were calculated as follows: (1) Sloan charts and ETDRS VA,
number of letters identified correctly (maximum, 70) and number
of lines correct (letters correct/5), and (2) Pelli–Robson charts, log
contrast sensitivity (maximum log score, 2.25 [48 letters]) and
number of lines correct (letters correct/3). Snellen equivalents
were also recorded for ETDRS VA measurements.
Before vision testing, participants underwent detailed refractions to minimize potential bias between patients and controls with
respect to correction of refractive error. Refractions were performed for each eye at 3.2 m (ETDRS chart R) and adjusted for the
different distances used for other vision tests. Testing was performed by trained technicians experienced in examination of patients for research studies. Although it was not feasible for the
examining technicians to be masked to MS versus control group
status, strict standardized protocols, including written scripts and
instructions for testing, were followed.
Optical Coherence Tomography
Optical coherence tomography was performed for both eyes of
each participant using OCT-3 with OCT 4.0 software (Carl Zeiss
Meditec). Using low-coherence interferometry, OCT generates
cross-sectional tomograms of the retina with an axial resolution of
Յ10 m.29 The fast RNFL thickness scan protocol was used
(computes the average of 3 circumferential scans 360° around the
optic disc, 256 axial scans, 3.4-m diameter). Optical coherence
tomography scanning was performed by trained technicians after
visual function testing. Scans were performed without flash photography to optimize patient comfort. If the participant’s pupils
were large enough to permit adequate OCT imaging (5-mm diameter), scanning was completed without the use of mydriatic eyedrops. Dilation has been shown to have little impact on OCT
values and reproducibility, and may not be consistently feasible in
the MS clinical trial setting.41 Pupils were dilated with 1% tropicamide if adequate scans could not otherwise be obtained. Good
scans were defined according to specifications in the OCT-3 users’
manual: signal strength of Ն7 (maximum, 10) and uniform bright-
326
ness across the scan circumference. In this cohort, all scans met
this requirement, and the median signal strength was 10 (range,
7–10). Internal fixation was used for all OCT scans, and a patch
was placed over the nontested eye to improve fixation.
Average overall RNFL thickness (averaged for peripapillary
retina 360° around the optic disc) and thickness values for each of
4 quadrants (temporal, superior, nasal, inferior) were recorded
from the OCT printouts for MS and disease-free control eyes.
Neurological Assessment
The Expanded Disability Status Scale (EDSS) and MSFC, measures used in MS clinical trials, were performed for MS patients to
characterize degrees of neurological impairment.12,48 The MSFC
includes quantitative tests of leg function/ambulation (Timed 25Foot Walk [T25FW]), arm function (9-Hole Peg Test [9HPT]), and
cognition (Paced Auditory Serial Addition Test with a 3-second
interstimulus interval [PASAT3]). The MSFC component and composite Z scores represent the number of SDs from a disease-free
control group mean score.15 Composite Z scores are calculated as
follows: MSFC Z score ϭ (ZT25FWϩZ9HPTϩZPASAT3)/3.0.
Statistical Methods
All data analyses were performed using Stata statistical software
(version 8.0, StataCorp, College Station, TX). Generalized estimating equation (GEE) models were used for primary analyses
that examined the relation of visual function to RNFL thickness.
Generalized estimating equation models are generalized linear
models that allow for specification of within-group correlations
when examining the capacity of one or several independent variables to predict a dependent variable. In this investigation, GEE
models were used to determine how well visual function scores
predicted average overall RNFL thickness, accounting simultaneously for age. Because both eyes of each MS patient and control
were included in this study, and eyes of the same patient would be
expected to have some degree of intercorrelation with respect to
visual function and RNFL thickness, GEE models allowed us to
adjust for these within-patient intereye correlations.
Generalized estimating equation models were also used to
compare patient (MS eyes, MS ON eyes, MS non-ON eyes) and
disease-free control groups with respect to RNFL thickness values
(average overall and 4 quadrants) and to examine the relation of
neurologic status to RNFL thickness. Indicator variables and interaction terms were used in models that examined patterns of
RNFL thickness across retinal quadrants in MS versus control eyes
as well as in MS ON and MS non-ON eyes. A type I error level of
␣ ϭ 0.05 was used for statistical significance.
Results
Ninety patients with MS (180 eyes) and 36 disease-free controls
(72 eyes) underwent vision testing and OCT imaging. Demographic and clinical characteristics are presented in Table 1. Because patients and disease-free controls in this convenience sample
differed with respect to age, statistical models used for analyses
included age as a covariate. Multiple sclerosis patients in our
cohort were similar to the United States MS population with regard
to age, gender, and race (88% Caucasian). Eighty percent of MS
patients (72/90) were using standard disease-modifying therapies
(median duration of current therapy, 3 years [range, Ͻ1–11]).
Degree of refractive error (SE), as measured by protocol refractions, did not differ significantly between MS and control group
eyes (P ϭ 0.71, GEE models accounting for within-patient intereye correlations).
Fisher et al ⅐ Retinal Nerve Fiber Layer Thickness in Multiple Sclerosis
Table 1. Characteristics of Patients with Multiple Sclerosis (MS) and Disease-Free Controls
Age (yrs)* (mean Ϯ standard deviation)
Gender [n (% female)]
MS disease duration (yrs) [median (range)]
MS disease phenotype† [n (% relapsing remitting)]
EDSS score‡ [median (range)]
MSFC Z score§ [mean Ϯ standard deviation]
Refractive error (spherical equivalent, by eyes)ʈ [median (range)]
Visual acuity (Snellen equivalent, by eyes) [median (range)]
Average overall retinal nerve fiber layer thickness (m, by eyes) [median (range)]
MS Patients
(n ؍90, 180 Eyes)
Disease-Free Controls
(n ؍36, 72 Eyes)
48Ϯ8
72 (80)
8 (Ͻ1–46)
76 (84)
2 (0–7)
Ϫ2.49Ϯ3.9
Ϫ0.75 (Ϫ8.00 to ϩ3.75)
20/16 (20/12.5–20/200)
Mean, 20/20
93 (36–129)
38Ϯ10
28 (78)
—
—
—
—
Ϫ0.5 (Ϫ7.125 to ϩ4.375)
20/16 (20/12.5–20/20)
Mean, 20/15
107 (85–131)
EDSS ϭ Expanded Disability Status Scale; MSFC ϭ MS Functional Composite.
*Age was significantly lower among disease-free controls in this convenience sample (PϽ0.0001, t test); therefore, all statistical models comparing MS
and control group eyes accounted simultaneously for participant age.
†
Remainder of cohort had secondary progressive MS phenotype.
‡
Assigned on an ordinal scale based on the neurological examination, and range in 0.5-increments from 0 (no abnormal findings or disability) to 7.0ϩ
(wheelchair used for mobility).
§
The MSFC includes quantitative tests of leg function/ambulation (Timed 25-Foot Walk [T25FW]), arm function (9-Hole Peg Test [9HPT]), and
cognition (Paced Auditory Serial Addition Test with a 3-second interstimulus interval [PASAT3]). Z scores represent the number of standard deviations
from a disease-free control group mean score, and are calculated as follows: MSFC composite Z score ϭ (ZT25FW ϩ Z9HPT ϩ ZPASAT3)/3.0.
ʈ
Degree of refractive error, as measured by protocol refractions, did not differ significantly between MS and control group eyes (P ϭ 0.71, generalized
estimating equation models accounting for within-patient intereye correlations).
Snellen acuity equivalents were 20/20 or better for both MS
and disease-free control eyes (Table 1). Although median ETDRS
VA scores did not differ from a clinical standpoint (difference of
3 letters, Ͻ1 line of acuity), scores for low-contrast letter acuity
and contrast sensitivity were significantly worse among eyes of
MS patients compared with disease-free controls (Table 2). Scores
were lower (worse) for the 1.25% contrast level (lower contrast)
compared with 2.5%, with greater differences between patients
and controls noted at the 1.25% level. Multiple sclerosis eyes with
a history of acute optic neuritis (MS ON eyes) had significantly
worse visual function than MS eyes without a history of acute
optic neuritis (MS non-ON eyes) for low-contrast letter acuity
(PՅ0.007) and contrast sensitivity (P ϭ 0.006). Eyes of MS
patients without a history of acute optic neuritis in either eye (MS
non-ON patient eyes) versus fellow eyes of MS patients with a
history of acute optic neuritis in one eye (MS ON patient fellow
Table 2. Comparison of Visual Function Test Scores for Eyes of Patients with Multiple Sclerosis (MS), Disease-Free Control Eyes,
and MS Eyes with a History of Acute Optic Neuritis (MS ON Eyes)
All MS Eyes
(n ؍180, 90 Patients)
High-contrast VA [ETDRS charts, no. of letters
correct, median (range)]†
Low-contrast letter acuity [Sloan charts, 1.25%
contrast level, no. of letters correct, median
(range)]‡
Low-contrast letter acuity [Sloan charts, 2.5%
contrast level, no. of letters correct, median
(range)]‡
Contrast sensitivity [Pelli–Robson chart, log
contrast, median (range)]§
Disease-Free Control Eyes
(n ؍72, 36 Patients)*
MS ON Eyes
(n ؍63)*
MS Non-ON Eyes
(n ؍108)
63 (0–70)
66 (58–70)
62 (0–70)
64 (8–70)
22 (0–41)
32 (15–42)
15 (0–35)
24 (0–41)
36 (0–49)
39 (26–48)
32 (0–44)
37 (0–47)
1.65 (0–1.95)
1.70 (1.45–1.95)
1.65 (0–1.85)
1.65 (1.2–1.95)
ETDRS ϭ Early Treatment Diabetic Retinopathy Study; VA ϭ visual acuity.
*Visual function test scores were significantly lower (worse) among MS eyes than among controls, accounting for age and adjusting for
within-patient intereye correlations (PՅ0.001 for all comparisons, generalized estimating equation models). Multiple sclerosis ON eyes had
significantly worse visual function than MS non-ON eyes for low-contrast letter acuity (PՅ0.007) and contrast sensitivity (P ϭ 0.006). Eyes of MS
patients without a history of acute ON in either eye vs. fellow eyes of MS patients with a history of acute ON in one eye (MS ON patient fellow
eyes) did not differ significantly with respect to visual function scores (scores were actually slightly higher, but not significantly so, for MS ON
patient fellow eyes; PՆ0.14, data not shown). Numbers of MS ON eyes ϩ MS non-ON eyes add to 171 because there were 9 MS eyes for which
history of acute ON was not known.
†
Charts have 5 letters per line; scores are expressed herein as number of letters identified correctly (range, 0 [0 lines, Ͻ20/250 Snellen equivalent]–70 [15
lines, 20/12.5 Snellen equivalent]).
‡
Low-contrast charts have a format similar to that of ETDRS VA charts (5 letters per line); scores are expressed herein as number of letters identified
correctly (range, 0 [0 lines]–70 [15 lines]). The 2.5% and 1.25% contrast levels were examined in this study.
§
Charts, as used in the Optic Neuritis Treatment Trial, consist of 16 groups of 3 large (ϳ20/680 equivalent at 1 m) letters (lines); scores are expressed
herein as log contrast (range, 0.00 [1 line/3 letters correct]–2.25 [16 lines/48 letters correct]).
327
Ophthalmology Volume 113, Number 2, February 2006
MS Eyes
RNFL Thickness (microns)
150
Disease-Free Control Eyes
130
p<0.001 *
110
p=0.34 †
90
70
50
Overall
Average
Temporal
Superior
Nasal
Inferior
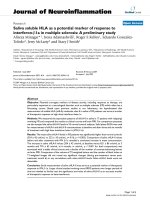
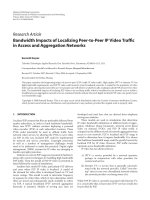
Figure 1. Mean values for overall average retinal nerve fiber layer (RNFL)
thickness (360° around the optic disc) and for RNFL thickness in temporal, superior, nasal, and inferior quadrants for patients with multiple
sclerosis (MS; n ϭ 90 [180 eyes]) and disease-free controls (n ϭ 36 [72
eyes]). *Average overall RNFL thickness values were significantly lower
for MS patients versus controls (PϽ0.001, generalized estimating equation
[GEE] models accounting for age and adjusting for within-patient intereye
correlations)†Mean RNFL thickness values varied significantly across retinal quadrants (PϽ0.0001), with mean thickness greater in the superior
and inferior quadrants. The mean thickness was greater for controls than
for MS patients in all quadrants, and the difference between patient groups
was of the same magnitude in each quadrant (P ϭ 0.34 for interaction
terms, GEE models).
eyes) did not differ significantly with respect to visual function
scores (scores were actually slightly higher, but not significantly
so, for MS ON patient fellow eyes [PՆ0.14, data not shown]).
Average overall RNFL thickness (average thickness for 360°
around the optic disc) was significantly reduced in MS eyes
(92Ϯ16 m) relative to eyes of disease-free controls (105Ϯ12
m) (PϽ0.001, GEE models accounting for age and adjusting for
within-patient intereye correlations) (Fig 1). Although, as expected, MS ON eyes (85Ϯ17 m) had significantly lower RNFL
thicknesses than MS non-ON eyes (96Ϯ14 m) (PϽ0.001), values
for MS non-ON eyes were also reduced compared with normal
controls (105 m, P ϭ 0.03). Using normative data included in the
OCT 4.0 processing software for OCT-3, only 40 of 180 eyes of
MS patients (22%) had overall average RNFL thickness values
that were abnormal in one or both eyes. However, the OCT 4.0
normative database considers the fifth percentile for age to be the
cutoff for abnormal values.49
Mean RNFL thickness values varied significantly across retinal
quadrants (PϽ0.0001), with mean thickness greater in the superior
and inferior quadrants. The mean thickness was greater for controls than for MS patients in all quadrants, and the difference
between subject groups was of the same magnitude in each quadrant (P ϭ 0.34 for interaction terms, GEE models). Within the MS
group, comparison of mean RNFL thickness between MS ON eyes
and MS non-ON eyes (Fig 2) showed that MS ON eyes had lower
mean RNFL thickness (PϽ0.001). The mean thickness was less
for MS ON eyes in all quadrants, with a suggestion that the
differences between these 2 patient groups were smallest in the
nasal quadrant (P ϭ 0.02 for interaction terms, GEE models).
To address the question of whether patients with a history of
acute optic neuritis that was unilateral may have actually had
involvement of the contralateral optic nerve based on reductions in
RNFL thickness, additional analyses were performed to compare
overall average RNFL thicknesses in eyes of MS patients without
a history of acute optic neuritis in either eye (MS non-ON patient
328
eyes) versus fellow eyes of MS patients with a history of acute
optic neuritis in one eye (MS ON patient fellow eyes). The overall
average RNFL thickness in MS ON patient fellow eyes (99 m)
was similar to that in MS non-ON patient eyes (95 m) (P ϭ 0.31,
GEE models accounting for age and adjusting for within-patient
intereye correlations). In contrast, eyes with a history of acute
optic neuritis (MS ON eyes, Fig 2) had significantly reduced
RNFL thickness compared with both groups of non-ON eyes (85
m, PϽ0.001).
Visual function scores were significant predictors of overall
average RNFL thickness among MS eyes (PϽ0.001 for all tests,
GEE models accounting for age and adjusting for within-patient
intereye correlations). As demonstrated in Table 3, lower visual
function scores were associated with reduced average overall
RNFL thickness. For every 1-line change in low-contrast letter
acuity and in contrast sensitivity scores, RNFL thickness differences of 4 m on average were noted, accounting for age. Spearman rank correlations between overall average RNFL thickness
and visual function scores were highly significant yet modest in
magnitude, suggesting that visual dysfunction may occur in some
patients in the absence of (or perhaps in advance of) RNFL axonal
loss (Spearman r [rs] ϭ 0.33 and PϽ0.0001 for low-contrast letter
acuity, rs ϭ 0.31 and PϽ0.0001 for contrast sensitivity, rs ϭ 0.26
and P ϭ 0.0005 for high-contrast VA). Unlike GEE models,
however, these simple correlations do not account for factors such
as age and disease duration, and do not allow for adjustment for
within-patient intereye correlations.
We also examined the relation between RNFL thickness and
more global aspects of disease in MS, including duration of disease
and scores for overall neurological impairment (EDSS and MSFC
[MSFC ϭ T25FW, 9HPT, and PASAT]). Average overall RNFL
170
MS ON Eyes
150
R NF L T h i ck n e s s (m i c r o n s )
170
MS non-ON Eyes
Disease-Free Control Eyes
130
p<0.001 *
110
p=0.03 †
90
70
50
Overall
Average
Temporal
Superior
Nasal
Inferior
Figure 2. Mean values for overall average retinal nerve fiber layer (RNFL)
thickness (360° around the optic disc) and for RNFL thickness in temporal, superior, nasal, and inferior quadrants for multiple sclerosis (MS) eyes
with a history of Ն1 episodes of acute optic neuritis (MS ON eyes [n ϭ
63]), MS eyes without an acute ON history (MS non-ON eyes [n ϭ 108]),
and disease-free control eyes (n ϭ 72). In a subanalysis comparing eyes of
MS patients without a history of acute optic neuritis in either eye (MS
non-ON patient eyes) and fellow eyes of MS patients with a history of
acute ON in one eye (MS ON patient fellow eyes), overall average RNFL
thickness in MS ON patient fellow eyes (99 m) was similar to that of MS
non-ON patient eyes (95 m) (P ϭ 0.31, generalized estimating equation
[GEE] models accounting for age and adjusting for within-patient intereye
correlations). *Significant differences in average overall RNFL thickness
between MS ON eyes and MS non-ON eyes were observed (PϽ0.001, GEE
models accounting for age and adjusting for within-patient intereye
correlations)†Multiple sclerosis non-ON eyes also had reduced average overall
RNFL thickness compared with disease-free control eyes (P ϭ 0.03).
Fisher et al ⅐ Retinal Nerve Fiber Layer Thickness in Multiple Sclerosis
Decrease in Average Overall RNFL
Thickness Associated
with 1-Line Decrease
in Visual Function
Score in MS Eyes
(n ؍180) (95% CI)*
Low-contrast letter acuity (Sloan
charts, 1.25%, 5 letters/line)
Low-contrast letter acuity (Sloan
charts, 2.5%, 5 letters/line)
Contrast sensitivity (Pelli–Robson
chart, 3 letters/line)
High-contrast VA (ETDRS charts,
5 letters/line)
3.8 (2.7–4.9)
3.1 (2.0–4.2)
4.4 (3.5–5.4)
2.9 (2.1–3.7)
CI ϭ confidence interval; ETDRS ϭ Early Treatment Diabetic Retinopathy Study; MS ϭ multiple sclerosis; VA ϭ visual acuity.
*Visual function scores significantly predicted overall average RNFL
thickness, accounting for age and adjusting for within-patient intereye
correlations (PϽ0.001 for all tests, generalized estimating equation models).
Data are cross-sectional from a single study visit and interpreted as the
number of microns reduction in average overall RNFL thickness (360°
around the optic disc) associated with a 1-line worsening of visual function
test score. For example, a 1-line (5 letters) decrease in low-contrast letter
acuity at the 1.25% level was associated with a 3.8-m reduction in RNFL
thickness among all MS eyes in this study.
thickness declined with increasing degrees of overall neurological
impairment and disability in our MS cohort and was significantly
associated with EDSS score (P ϭ 0.02 for linear trend across
EDSS tertiles, GEE models) (Fig 3). Multiple Sclerosis Functional
Composite scores and RNFL thickness were also significantly
related (P ϭ 0.001, GEE models), and RNFL thickness declined
with increasing disease duration (P ϭ 0.03).
Discussion
Results of these investigations demonstrate that low-contrast
letter acuity and contrast sensitivity, the two most promising
candidate visual outcome measures for MS, correlate well
with RNFL thickness. Although eyes with a history of acute
optic neuritis (MS ON eyes) demonstrate the greatest reductions in RNFL thickness, MS non-ON eyes are also
abnormal (including fellow eyes of MS patients with a history
of unilateral optic neuritis), supporting the occurrence of anterior visual pathway axonal loss in MS patients that occurs in
the absence of obvious attacks of acute optic neuritis. Retinal
nerve fiber layer thickness declines with increasing neurologic impairment and correlates with disease duration. Furthermore, our data strongly support a role for ocular imaging techniques such as OCT in trials that examine
neuroprotective and other disease-modifying therapies.
Although MRI is the technique of choice for assessing
overall disease burden and atrophy in MS, imaging of
RNFL thickness using OCT provides a unique opportunity
to measure a central nervous system structure that consists
of axons without myelin. Other important characteristics
that make RNFL thickness an appealing candidate biomar-
ker include (1) accessibility of the retina for imaging (reliable and feasible in many patients without pupillary dilation),41 (2) ability to acquire and analyze images quickly
and easily (ϳ5 minutes per eye, may be performed by
nonphysician personnel), (3) markedly reduced expense
compared with MRI techniques that examine optic nerve
morphology, and (4) capacity to correlate structure (RNFL
thickness) with its corresponding function (vision) directly.
Data on the impact of MS and acute optic neuritis on
RNFL thickness are beginning to emerge.34,35 A small pilot
study of patients with MS (n ϭ 14) revealed reductions in
overall average RNFL thickness in eyes with a history of
acute optic neuritis and in contralateral MS eyes without an
acute optic neuritis history.34 Although average overall
RNFL thickness for normal subjects was 111Ϯ11 m,
mean values were significantly lower for optic neuritis eyes
(60Ϯ11 m, history of acute optic neuritis Ն6 months
before study) and for contralateral non– optic neuritis eyes
of MS patients (83Ϯ10 m); values for these eyes in our
cohort were higher, perhaps due to a larger sample size and
differences in selection criteria. In series of patients with a
history of acute optic neuritis, decrements in RNFL thickness correlated with high-contrast VA, VF mean deviation,
and color vision.35 Future studies will examine the role of
OCT in detecting subtle RNFL edema, establishing rates
of decline in RNFL thickness, and detecting corticosteroid treatment response in patients with acute optic neuritis.
EDSS Tertile
Average Overall RNFL Thickness (microns)
Table 3. Association of Worsening in Visual Function Score
and Reduction in Retinal Nerve Fiber Layer (RNFL) Thickness
(m), Single Examination
p=0.02 for linear trend across EDSS tertiles * †
110
90
70
50
Score 0 - 1.5 (n=18)
Score 2.0 - 2.5 (n=17)
Score 3.0 - 7.0 (n=19)
Figure 3. Mean values for average overall retinal nerve fiber layer (RNFL)
thickness (360° around the optic disc) across categories (tertiles) for
patients with multiple sclerosis who underwent neurologic testing with the
Expanded Disability Status Scale (EDSS). Multiple sclerosis patients were
divided into 3 approximately equal groups to define EDSS tertiles. *Retinal nerve fiber layer thickness decreased with increasing EDSS scores
(P ϭ 0.02 for linear trend, accounting for age and adjusting for withinpatient intereye correlations), indicating greater degrees of axonal loss in
the anterior visual pathways of patients with greater degrees of neurological impairment†Tertile ranges represent (1) minimal abnormalities on
neurological examination with no disability (0 –1.5), (2) minimal disability in 1 or 2 domains of function (2.0 –2.5), and (3) moderate to severe
disability (3.0 –7.0). Expanded Disability Status Scale scores of 6.0, 6.5,
and 7.0 are assigned if a patient requires unilateral assistance (cane),
bilateral assistance (walker), or a wheelchair, respectively, for ambulation/
mobility.
329
Ophthalmology Volume 113, Number 2, February 2006
Analyses in our study demonstrated that fellow eyes of
MS patients with a history of unilateral acute optic neuritis
were no more likely to have RNFL axonal loss than were
eyes of MS patients with no history of acute optic neuritis in
either eye. At the same time, compared with disease-free
control eyes, RNFL thickness was reduced both in fellow
eyes of patients with unilateral optic neuritis and among MS
non-ON eyes, supporting the occurrence of axonal loss in
MS eyes even in the absence of attacks of acute optic
neuritis. Clinical manifestations of MS are caused not only
by the effects of acute demyelination on otherwise normal
axons, but also by axonal loss (both primary and by Wallerian degeneration), which is now known to occur within
the visual pathways and in other areas of the central nervous
system.28 Results of this study support previous observations that many MS patients with no history of acute visual
loss (painful or otherwise) complain that vision in one or
both eyes is not normal and have evidence of unilateral or
bilateral optic nerve dysfunction by clinical or electrophysiologic testing.5–10,15,16
Analogous to the RNFL data, scores for visual function
tests were reduced most markedly among eyes with a history of acute optic neuritis (Table 2), but also did not differ
significantly between fellow eyes of patients with a history
of unilateral optic neuritis and eyes of MS patients without
a history of optic neuritis in either eye. Patterns of RNFL
thickness seen in our investigation are supported by a recently published study of acute optic neuritis and fellow
eyes (n ϭ 25 patients).35 In that investigation, RNFL thickness in fellow eyes was lower than but not significantly
different from that in control eyes (94 vs. 103 m; P ϭ
0.09, 2-sample t test), whereas optic neuritis eyes demonstrated marked reductions in RNFL thickness versus controls (69 m, PϽ0.001). Multiple sclerosis patients without
a history of acute optic neuritis, however, were not included
in the study cohort.
In our MS cohort, worse visual function scores were
associated with reduced RNFL thickness. A 1-line decline
in vision score corresponded to a 4-m reduction in average
overall RNFL thickness (Table 3). Although visual function
scores were significant predictors of RNFL thickness, accounting for age, correlations were modest in magnitude.
This suggests that clinical tests of low-contrast letter acuity
and contrast sensitivity capture visual dysfunction that occurs in the absence of or perhaps in advance of axonal loss.
Reduction of visual function test scores without RNFL loss
may also reflect MS disease in optic radiations and occipital
lobes; lesions in these areas affect function in both eyes and
do not produce reductions in RNFL thickness. Low-contrast
letter acuity and contrast sensitivity are clinical outcomes
that detect visual pathway dysfunction, perhaps in advance
of irreversible neuronal/axonal degeneration when the potential for treatment response is greatest.
Retinal nerve fiber layer thickness is considered to be a
promising surrogate marker for optic nerve damage in glaucoma, a disorder that is, in part, defined by the presence of
axonal loss.50 However, because axonal degeneration and
clinical impairment in MS are not limited to the anterior
visual pathways, RNFL thickness has not been proposed as
a surrogate marker for disease in MS but represents an
330
attractive biomarker for observing patients with acute and
subclinical anterior visual pathway involvement.51
Although the relation of age to RNFL thickness remains
somewhat controversial, effects of normal aging on overall
RNFL thickness as measured by OCT were demonstrated in
a recent study.52 Among 144 normal subjects (144 eyes),
ranging in age from 16 to 84 years (mean, 46Ϯ18), the
following distribution of overall average RNFL thickness was
noted: 128Ϯ11 m (age Յ 30 years), 127Ϯ11 m (31–50
years), 120Ϯ10 m (51–70 years), and 114Ϯ9 m (Ͼ70
years). These results indicate an estimated decline in RNFL
thickness of 0.17% per year, and are consistent with histologic studies demonstrating 0.5% per year declines in human optic nerve fiber counts.28 Given the potential effects
of normal aging on RNFL thickness values, all statistical
models in our investigation included participant age as a
covariate.
Most patients in therapeutic trials for MS and optic
neuritis will be 50 years or younger and, thus, within a range
in which the effects of age on RNFL are only slight with
regard to absolute differences (see above discussion). Normative reference values based on age have been incorporated into the OCT 4.0 software.49 This normative database
has been approved by the Food and Drug Administration for
determining age-based reference values for RNFL thickness, and is represented by green zones on the OCT printout.
However, this normative database considers the fifth percentile
for age to be the cutoff for abnormal values. In our cohort of
MS patients, 40 of 180 eyes (22%) had average overall RNFL
thickness values that were lower than the fifth percentile for
age. As a result, this investigation and others have included
disease-free control subjects to provide additional normative data.34,41,53
Although changes in ocular media, such as cataracts or
placement of contact lenses (should be removed for OCT
imaging), may affect the quality of OCT scans, refractive
error itself (SE) did not correlate significantly with RNFL
thickness in recent investigations (r ϭ 0.09, P ϭ 0.28).29,52
Average macular thickness by OCT did not vary with degree of myopia in another recent study,54 and adding SE as
a covariate in our statistical models did not affect the
relation of RNFL thickness to visual function.
Among imaging modalities, OCT is comparable to both
scanning laser polarimetry (GDx with variable corneal compensation, Carl Zeiss Meditec) and confocal scanning laser
ophthalmoscopy (Heidelberg Retina Tomograph II, Heidelberg Engineering GmbH, Heidelberg, Germany) with respect to its capacity to discriminate between healthy eyes
and eyes with glaucomatous VF loss.31 Although comparable for detecting glaucomatous damage, some data suggest
that OCT may prove to be the preferred RNFL imaging
method in MS. The Heidelberg Retina Tomograph II has a
slower acquisition time and provides only an indirect measurement of the RNFL.29 GDx may be less sensitive for
detecting regional RNFL loss in the nasal and temporal
quadrants.55 This differential detection ability may be relevant in MS, particularly if longitudinal studies of acute optic
neuritis demonstrate anatomic patterns of RNFL loss. Further studies are underway to examine the role of variable
Fisher et al ⅐ Retinal Nerve Fiber Layer Thickness in Multiple Sclerosis
corneal compensation in GDx techniques for ensuring uniform detection of RNFL losses.
Data from previous cross-sectional and longitudinal
studies demonstrate that low-contrast letter acuity (Sloan
charts) and contrast sensitivity (Pelli–Robson charts) are
vision tests that best distinguish MS patients from diseasefree controls and, thus, best capture MS-related visual dysfunction. The potential to demonstrate clinical changes over
time was shown for Pelli–Robson charts in the Optic Neuritis
Treatment Trial and in ongoing longitudinal analyses of the
MS Vision Prospective Cohort Study for Sloan charts (Balcer,
unpublished data). Sloan charts have also been incorporated as
secondary outcomes in several recent MS clinical trials. Although Sloan chart and Pelli–Robson scores correlate with
global measures of brain atrophy, lesion volume, and magnetization transfer ratio (Neurology 64[suppl 1]:A35– 6, 2005),
the relation shown herein with RNFL thickness is of greater
magnitude and is consistent with a major contribution of anterior visual pathway disease to MS-related visual dysfunction.
Ongoing longitudinal studies of OCT in MS and optic neuritis
cohorts, and incorporation of ocular imaging as secondary
outcomes in clinical trials, will further examine patterns of
axonal degeneration and visual loss over time and will establish the role for OCT and other ocular imaging modalities as
structural biomarkers.
References
1. McDonald WI, Barnes D. The ocular manifestations of multiple sclerosis. 1. Abnormalities of the afferent visual system.
J Neurol Neurosurg Psychiatry 1992;55:747–52.
2. Warner J, Lessell S. Neuro-ophthalmology of multiple sclerosis. Clin Neurosci 1994;2:180 – 8.
3. Leibowitz U, Alter M. Optic nerve involvement and diplopia
as initial manifestations of multiple sclerosis. Acta Neurol
Scand 1968;44:70 – 80.
4. Sørensen TL, Frederiksen JL, Brønnum-Hansen H, Petersen
HC. Optic neuritis as onset manifestation of multiple sclerosis:
a nationwide, long-term survey. Neurology 1999;53:473– 8.
5. Regan D, Silver R, Murray TJ. Visual acuity and contrast
sensitivity in multiple sclerosis— hidden visual loss: an auxiliary diagnostic test. Brain 1977;100:563–79.
6. Balcer LJ. Multiple sclerosis and related demyelinating diseases. In: Miller NR, Newman NJ, Biousse V, Kerrison JB,
eds. Walsh and Hoyt’s Clinical Neuro-ophthalmology. Vol. 3.
6th ed. Philadelphia: Lippincott Williams & Wilkins; 2004:
3429 –525.
7. Cole SR, Beck RW, Moke PS, et al, Optic Neuritis Study Group.
The National Eye Institute Visual Function Questionnaire: experience of the ONTT. Invest Ophthalmol Vis Sci 2000;41:1017–21.
8. Kupersmith MJ, Nelson JI, Seiple WH, et al. The 20/20 eye in
multiple sclerosis. Neurology 1983;33:1015–20.
9. Balcer LJ, Baier ML, Kunkle AM, et al. Self-reported visual
dysfunction in multiple sclerosis: results from the 25-Item
National Eye Institute Visual Function Questionnaire (VFQ25). Mult Scler 2000;6:382–5.
10. Balcer LJ, Baier ML, Pelak VS, et al. New low-contrast vision
charts: reliability and test characteristics in patients with multiple sclerosis. Mult Scler 2000;6:163–71.
11. Cutter GR, Baier ML, Rudick RA, et al. Development of a
multiple sclerosis functional composite as a clinical trial outcome measure. Brain 1999;122:871– 82.
12. Rudick RA, Cutter G, Reingold S. The Multiple Sclerosis
Functional Composite: a new clinical outcome measure for
multiple sclerosis clinical trials. Mult Scler 2002;8:359 – 65.
13. Rudick RA, Antel J, Confavreux C, et al. Recommendations
from the National Multiple Sclerosis Society Clinical Outcomes Assessment Task Force. Ann Neurol 1997;42:379 – 82.
14. Cohen J, Cutter G, Lublin F, Schwid S. The MS Co-operative
Research (MS-CORE) Group: an alternate approach to fostering multicenter studies [letter]. Mult Scler 2004;10:332–3.
15. Balcer LJ, Baier ML, Cohen JA, et al. Contrast letter acuity as
a visual component for the Multiple Sclerosis Functional
Composite. Neurology 2003;61:1367–73.
16. Baier ML, Cutter GR, Rudick RA, et al. Low-contrast letter
acuity testing captures visual dysfunction in patients with
multiple sclerosis. Neurology 2005;64:992–5.
17. Rubin GS. Reliability and sensitivity of clinical contrast sensitivity tests. Clin Vis Sci 1988;2:169 –77.
18. Sisto D, Trojano M, Vetrugno M, et al. Subclinical visual
involvement in multiple sclerosis: a study by MRI, VEPs,
frequency-doubling perimetry, standard perimetry, and
contrast sensitivity. Invest Ophthalmol Vis Sci 2005;46:
1264 – 8.
19. Weinstock-Guttman B, Baier M, Stockton R, et al. Pattern reversal visual evoked potentials as a measure of visual pathway
pathology in multiple sclerosis. Mult Scler 2003;9:529 –34.
20. Trobe JD, Beck RW, Moke PS, Cleary PA. Contrast sensitivity and other vision tests in the Optic Neuritis Treatment Trial.
Am J Ophthalmol 1996;121:547–53.
21. Beck RW, Cleary PA, Anderson MM Jr, et al, Optic Neuritis
Study Group. A randomized, controlled trial of corticosteroids
in the treatment of acute optic neuritis. N Engl J Med 1992;
326:581– 80.
22. Beck RW, Kupersmith MJ, Cleary PA, Katz B. Fellow eye
abnormalities in acute unilateral optic neuritis: experience of
the Optic Neuritis Treatment Trial. Ophthalmology 1993;100:
691–7, discussion 697– 8.
23. Optic Neuritis Study Group. Visual function more than 10
years after optic neuritis: experience of the Optic Neuritis
Treatment Trial. Am J Ophthalmol 2004;137:77– 83.
24. Optic Neuritis Study Group. Visual function 5 years after
optic neuritis: experience of the Optic Neuritis Treatment
Trial. Arch Ophthalmol 1997;115:1545–52.
25. Rubin GS, Muñoz B, Bandeen-Roche K, West SK, SEE
Project Team. Monocular versus binocular visual acuity as
measures of vision impairment and predictors of visual disability. Invest Ophthalmol Vis Sci 2000;41:3327–34.
26. Newman NJ, Wolfe JM, Stewart MI, Lessel S. Binocular
visual function in patients with a history of monocular optic
neuritis. Clin Vis Sci 1991;6:95–107.
27. Pardhan S. Binocular performance in patients with unilateral
cataract using the Regan test: binocular summation and inhibition with low-contrast charts. Eye 1993;7:59 – 62.
28. Evangelou N, Konz D, Esiri MM, et al. Size-selective neuronal changes in the anterior optic pathways suggest a differential susceptibility to injury in multiple sclerosis. Brain 2001;
124:1813–20.
29. Jaffe GJ, Caprioli J. Optical coherence tomography to detect
and manage retinal disease and glaucoma. Am J Ophthalmol
2004;137:156 – 69.
30. Kanamori A, Nakamura M, Escano MF, et al. Evaluation of
the glaucomatous damage on retinal nerve fiber layer thickness measured by optical coherence tomography. Am J Ophthalmol 2003;135:513–20.
31. Medeiros FA, Zangwill LM, Bowd C, Weinreb RN. Comparison of the GDx VCC scanning laser polarimeter, HRT II
confocal scanning laser ophthalmoscope, and Stratus OCT
331
Ophthalmology Volume 113, Number 2, February 2006
32.
33.
34.
35.
36.
37.
38.
39.
40.
41.
42.
optical coherence tomography for the detection of glaucoma.
Arch Ophthalmol 2004;122:827–37.
Medeiros FA, Moura FC, Vessani RM, Susanna R Jr. Axonal
loss after traumatic optic neuropathy documented by optical
coherence tomography. Am J Ophthalmol 2003;135:406 – 8.
Monteiro ML, Leal BC, Rosa AA, Bronstein MD. Optical
coherence tomography analysis of axonal loss in band atrophy
of the optic nerve. Br J Ophthalmol 2004;88:896 –9.
Parisi V, Manni G, Spadaro M, et al. Correlation between morphological and functional retinal impairment in multiple sclerosis
patients. Invest Ophthalmol Vis Sci 1999;40:2520 –7.
Trip SA, Schlottmann PG, Jones SJ, et al. Retinal nerve fiber
layer axonal loss and visual dysfunction in optic neuritis. Ann
Neurol 2005;58:383–91.
Bowd C, Zangwill LM, Berry CC, et al. Detecting early
glaucoma by assessment of retinal nerve fiber layer thickness
and visual function. Invest Ophthalmol Vis Sci 2001;42:1993–
2003.
Wollstein G, Schuman JS, Price LL, et al. Optical coherence
tomography (OCT) macular and peripapillary retinal nerve
fiber layer measurements and automated visual fields. Am J
Ophthalmol 2004;138:218 –25.
Schuman JS, Hee MR, Puliafito CA, et al. Quantification of
nerve fiber layer thickness in normal and glaucomatous eyes
using optical coherence tomography. Arch Ophthalmol 1995;
113:568 –96.
Sanchez-Galeana CA, Bowd C, Zangwill LM, et al. Shortwavelength automated perimetry results are correlated with
optic coherence tomography retinal nerve fiber layer thickness
measurements in glaucomatous eyes. Ophthalmology 2004;
11:1866 –72.
Pieroth L, Schuman JS, Hertzmark, E, et al. Evaluation of
focal defects of the nerve fiber layer using optical coherence
tomography. Ophthalmology 1999;106:570 –9.
Paunescu LA, Schuman JS, Price LL, et al. Reproducibility of
nerve fiber thickness, macular thickness, and optic nerve head
measurements using StratusOCT. Invest Ophthalmol Vis Sci
2004;45:1716 –24.
McDonald WI, Compston A, Edan G, et al. Recommended
diagnostic criteria for multiple sclerosis: guidelines from the
International Panel on the Diagnosis of Multiple Sclerosis.
Ann Neurol 2001;50:121–7.
332
43. Lynch DR, Farmer JM, Rochestie D, Balcer LJ. Contrast letter
acuity as a measure of visual dysfunction in patients with
Friedreich ataxia. J Neuroophthalmol 2002;22:270 – 4.
44. Pelli DG, Robson JG, Wilkins AJ. The design of a new letter
chart for measuring contrast sensitivity. Clin Vis Sci 1988;2:
187–99.
45. Bailey IL, Lovie JE. New design principles for visual acuity
letter charts. Am J Optom Physiol Opt 1976;53:740 –5.
46. Ferris FL III, Kassoff A, Bresnick GH, Bailey I. New visual
acuity charts for clinical research. Am J Ophthalmol 1982;94:
91– 6.
47. Bodis-Wollner I, Diamond SP. The measurement of spatial
contrast sensitivity in cases of blurred vision associated with
cerebral lesions. Brain 1976;99:695–710.
48. Kurtzke JF. Rating neurologic impairment in multiple sclerosis:
an expanded disability status scale (EDSS). Neurology 1983;33:
1444 –52.
49. Patella VM. STRATUSOCT: Establishment of normative
reference values for retinal nerve fiber layer thickness measurements. Available at: />C125679E00525939/EmbedTitelIntern/Stratus OCT ndb paper/
$File/czm ndb paper.pdf. Accessed November 1, 2004.
50. Leung CK, Chan WM, Yung WH, et al. Comparison of
macular and peripapillary measurements for the detection of
glaucoma. Ophthalmology 2005;112:391– 400.
51. Katz R. Biomarkers and surrogate markers: an FDA perspective. NeuroRx 2004;1:189 –95.
52. Kanamori A, Escano MF, Eno A, et al. Evaluation of the effect
of aging on retinal nerve fiber layer thickness measured by
optical coherence tomography. Ophthalmologica 2003;217:
273– 8.
53. Varma R, Bazzaz S, Lai M. Optical tomography-measured
retinal nerve fiber layer thickness in normal Latinos. Invest
Ophthalmol Vis Sci 2003;44:3369 –73.
54. Lim MC, Hoh ST, Foster PJ, et al. Use of optical coherence
tomography to assess variations in macular retinal thickness in
myopia. Invest Ophthalmol Vis Sci 2005;46:974 – 8.
55. Monteiro ML, Medeiros FA, Ostroscki MR. Quantitative analysis of axonal loss in band atrophy of the optic nerve using
scanning laser polarimetry. Br J Ophthalmol 2003;87:32–7.