Định giá cổ phiếu công ty
Bạn đang xem bản rút gọn của tài liệu. Xem và tải ngay bản đầy đủ của tài liệu tại đây (1.27 MB, 14 trang )
Group 3 – Investment Analysist Expert
Manufactoring Sector, Textile Industry
Date : 30/10/2015
Ticker – HOSE : STK
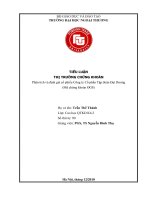
Current Price : VND 35,200 (09/10)
Recommendation : SELL
37,000
590
36,000
585
580
34,000
575
33,000
570
32,000
565
31,000
30,000
560
30/9/15
2/10/15
4/10/15
STK
6/10/15
8/10/15
VN-Index
STK COMPANY PROFILE
Average IPO Price
VND 24,124
Share Outstanding
42,305,336
Market Cap.
VND 1,020b
Dividend Yield
4.26%
Foreign Holdings
9.45%
Revenue (2014)
VND 1,458b
P/E
13.87
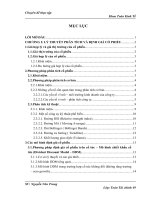
EARNING PER SHARE
3,500
50%
3,000
40%
2,500
30%
2,000
20%
1,500
10%
1,000
0%
500
-10%
-
-20%
2012A
2013A
EPS
2014A
Net Income Growth
CENTURY SYNTHETIC FIBER CORPORATION
Target Price : VND 26,800
Downside : -23.9%
HIGHLIGHTS
STK PRICE MOVEMENT
35,000
Ho Chi Minh Stock Exchange
With a target price of VND 26,800, we give a SELL recommendation
for STK’s shares. They are overvalued at present, which is an
unavoidable situation after any IPO. However, STK is considered as
a remarkable enterprise in the textile industry with :
Merits
Promising development outlook in a textile industry which is
benefiting by many advantages. The exporting value of the
industry is forecasted to grow steadily over years.
Expanding production capacity in response to the increasing
and diversifying demand of the international market.
Experienced Directors in development orientation and
management. Average years of experiences in the industry is
about 18 years per members.
When STK can take advantage of these opportunities and strengths,
our assumptions in valuation models will change in a positive
direction. And the negative changes will come from :
Concerns
The volatility of input and selling price makes sales of a
company that does not have a diversified pool of products as
STK will be unstable over years.
The potential competitors from outside with outstanding level
of capital and technology are available for investment in the
textile value chain.
High financial leverage with many foreign transactions force
STK to pay attention to financial expenses in their operation.
BUSINESS DESCRIPTION
Revenue
Century Synthetic JSC. (STK) was founded in 2000 as the first
domestic company producing polyeste filament, a kind of chemical
yarns.
STK has experienced a rapid and sound growth over 15 years and is
expanding customer network not only domestically but also over
the world.
STK officially becomes the first yarn producer to list on HOSE in
Q3/2015.
1,600
1,400
1,200
1,000
800
600
400
200
2010A
2011A
2012A
2013A
2014A
2015P
PRODUCTS
Source : STK
In textile industry, there are many types of yarns to be used for
weaving process. In terms of origin, we have natural yarns, synthetic
yarns and chemical yarns. In terms of structure, yarns include short
or long structure.
Net Income
150
125
100
Long yarns have firm structures than short yarns so they are strong
and good at color retention. Therefore, the current trend of textile
manufacturers are turning to the use of synthetic and chemical yarns
instead of cotton over years because of their valuable properties.
75
50
25
2010A
2011A
2012A
2013A
2014A
2015P
STK’s outputs are mainly Polyester Filament (long chemical yarns)
including DTY (Draw Textured Yarn : strong, tough, used in highquality products such as sports shoes, clothes,...) and FDY (Fully
Drawn Yarn: used in intermediate-quality products such as
curtains, canvas,...).
Source : STK
Revenue 2014 Breakdown by Products
12%
DTY
FDY
SUPPLY CHAIN
Source : STK
88%
Raw Materials
POY Spinning
PFY Spinning
Polyeste Chip
POY
PFY
(Imported from Taiwan,
South Korea and Germany)
(90% self-suppled,
10% imported)
(85% DTY, 15% FDY)
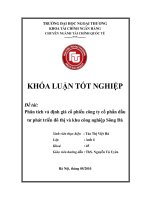
Crude Oil Price (USD/barrel)
160
140
120
100
80
60
40
20
0
2008
STK operates in “Yarn” process, particularly chemical yarns, in total
value chain of textile industry. Their products will be used in produce
fiber next in “Fiber” process which most of Vietnam textile company
operate in at present.
2009
2010
2011
2012
2013
Source : Bloomberg
2014
2015
Direct Customer
Domestic : Thanh Cong, Thai
Tuan, Formosa, Decotex,.
Foreign : YRC, Tongsiang,
Golden Empire, Huge Rock,
Universal, Pinewood.
Final Customer
Nike, Adidas,
Decathlon, Puma,
Reebok
Input : Polyeste Chip (PET chip) currently accounts for 70-75% of
the cost of goods sold of STK. PET chips are the derivatives of oil
production industry so the fluctuation in the current oil prices
definitely affects PET chip prices.
The oil price is on the downward trend to below 50USD/barrel
which would benefits the STK to lower the cost of goods sold.
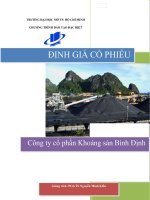
However, because the yarn prices must be adjusted to the PET
Chip price so, in general, the gross profit margin would not be
improved much.
Average Selling Price and PET Chip Price
(USD/kg)
3
In addition, USD exchange rate is getting higher with the
depreciation of other currencies would make the input materials
(mostly from import) fluctuate beside effects from oil price.
2.5
2
1.5
1
0.5
0
2008
2009
2010
2011
Average Selling Price
2012
2013
2014
PET Chip Pricces
Source : VCBS
Revenue 2014 Breakdown by Customers
23%
Domestic
Asia
50%
Europe
Source : STK
27%
Output : STK’s output includes DTY, FDY and POY (used for
spinning out DTY internally). STK targets to high- or
intermediate-quality products segment and thus, their revenue
primarily comes from DTY (over 90% of total revenue).
In addition to revenue, in term of customers, exporting sales,
mainly to Asia and Europe, account for 77% of their total revenue.
The remaining in total revenue was contributed by the domestic
market, which majority of the customers are exporting FDI
textile firms.
Compared to other domestic yarns firms, the production scale of
STK is still small (37,000 Tons / year) and meet only 0.09%
demand of long chemical yarn over the world while this demand
is rapidly increasing about 42% yoy. (Source: The fiber consulting
year 2015). Therefore, the growth “room” for STK is promisingly
large, which can uptake all STK’s high-quality output. It can be
said that expanding customer network is not a barrier to STK at
the moment.
CAPACITY
They have recently 3 plants including one in Northwest Cu Chi
Industrial Zone and two in Trang Bang Industrial Zone, Tay Ninh
with a total capacity of 44,500 tons yarns per year. STK is extending
two more plants also in Trang Bang:
Total capacity
(thousands tons)
60
50
• Plant 3rd with a designed capacity of 15,000 tons of DTY per year,
conducted in 2015 and 2016. In July of 2015, TB3 puts 9 machines
into operation which produced half of fully capacity. TB3 has total
capital of approximately VND 730 billions.
40
30
20
10
-
2010A
2011A
2012A
2013A
2014A
2015P
2016P
Source : STK & team estimation
2017P
• Plant 4nd will be started after TB3 operates at full capacity.
Designed capacity is 3,000 tons of DTY and 4,000 tons of FDY per
year.
COMPANY’S STRATEGY
Total produced & sold output
(thounsands tons)
35
30
25
20
15
10
5
2012A
2013A
Produced
Sold
Source : team estimation
2014A
• Expand investing in the production of DTY and FDY and customer
network, esspecially foreign clients to reduce the risk from
concentration of customers.
• Well-monitor the input price volatility to promptly make
appropriate adjustments to sale prices.
• Research and develop new products to produce distinctive
products from competitors.
• Expand over textile industry’s value chain to take more surplus in
production through the establish of Yarn – Fiber – Textile Unitex
Co. Ltd.
Shareholders Structure 2014
CORPORATE GOVERNANCE
SHAREHOLDERS STRUCTURE
Because STK is a newly listed company, the inside shareholders,
including the company's founders, still hold majority of shares (about
31.98%). Foreign entities only hold 9.56% shares.
18.96%
41.59%
BOARD OF DIRECTORS
31.33%
8.12%
Huong Viet Investment Consultant Corporation
Board of Directors
Vietnam Holding Limited
Others
Source : STK
Board of Directors’ Members
Members
The present chairman of the BoD is Mr. Dang Trieu Hoa, the CEO
founder, which helps him in strategic planning processes and
corporate governance by his experiences. In addition, two members
of the BoD, Ms. Dang My Linh and Dang Huong Cuong are also the
members of STK in the first days. With other experienced members,
they will make STK develop strongly and steadily.
However, the most notable member is Mr. Thai Tuan Chi, CEO
founder of Thai Tuan Textile, the STK’s longtime partner. With Mr.
Chi, STK will get the right directions in the investment and the
production to keep pace with the development of the textile
industry in Vietnam and over the world.
Independence
Position (from)
Experiences
Mr.Dang Trieu Hoa
No
Chairman (2005)
CEO Founder, 20 years experienced
Mrs.Dang My Linh
No
Member (2005)
Co-Founder, 20 years experienced
Mr.Dang Huong Cuong
No
Member (2005)
Co-Founder, Manager of Asia Pan Co. LTD
Mr.Thai Tuan Chi
No
Member (2007)
CEO Founder of Thai Tuan®
Mr.Lee Chien Kuan
Yes
Member (2008)
Taiwanese Textile Expert
Mrs.Cao Thi Que Anh
Yes
Member (2015)
Ex-Chairman & CFO of VISecurities JSC.
Source : Team analysis
R&D ACTIVITIES
The R&D activities of STK are not flagged by the lack of investment
capital and the technology transfers from foreign partners, especially
German partners to develop specialized products for the different
requirements from customers.
SWOT ANALYSIS
STRENGHTS
•Competitive skills with much experiences
•Having economics of scale
•Marketing effectiveness
•Brand awareness
•Good corporate governance
OPPORTUNITIES
•Demand for the product is on the rise.
•Potential markets following agreements like AEC, TPP,..
•Benefits from import and export tax policies.
WEAKNESS
•Having a strong reliance on imported raw material
•The scale of production is relatively small
•Not having a distinctive product from the lack of
investment in R&D activities
THREATS
•Potential competitors.
•Exchange rate and input prices fluctuations.
•Unexpected Inflation
INDUSTRY OVERVIEW
International Textile Exports
(billions USD)
THE CHARACTERISTICS OF THE INTERNATIONAL
TEXTILE INDUSTRY
500
Business cycle : On the trend of development after the bilateral
and multilateral trade agreements between the nations and areas
were signed.
Industry concentration : low due to low barriers to entrance the
industry.
Macroeconomics sensitivity : The textile industry has the high
proportion of export (about 70%) and that implies a vulnerable
state of the industry toward the fluctuations of macroeconomic
factors.
2013
Value chain : The value chain of the textile industry bears the
influence of the consumers. There are many stages carried out in
different countries in the process of making the final product. In
that value chain, the manufacturers with well-known brands,
considerable wholesalers and retailers play a key role in
Exporting
establishing the production web and navigate the bulk
consumption through the strong brands and the dependence on
global processing strategies. The value chain of the textile industry
typically include five basic stages:
450
400
350
300
250
200
150
100
50
0
2009
2010
2011
Fiber
2012
Textile
Source : WTO
Textile Value Chain
Textile
Fiber
Yarn
Raw
material
R
a
w
m
at
eri
al
Vietnam textile export (billion USD)
23
35%
30%
18
25%
14
20%
15%
9
10%
5
5%
-
0%
2005 2006 2007 2008 2009
2010
Export
2011
2012
2013
2014
Growth rate
Source : Bloomberg
Textile Product
Synthetic Yarn
Cotton Fiber
1,000
2,000
2020
3,000
2015
Source : 36/2008/QD-TTg
4,000
VIETNAM TEXTILE INDUSTRY
As cellphones and electric components, textile industry is the exportdriven industry of Vietnam in recent years. In 2013, Vietnam textile
products reached 180 nations with the total exporting value of 17.9
billion USD, accounted for more than 13.6% total trade value of
Vietnam and 10.5% GDP. The growth rate of the industry in the
period 2008 – 2013 is 14.5%, which has brought Vietnam into the 1st
position in the worlds having fastest textile industry growth rate and
the 7th largest textile exporter.
THE DEMAND DRIVER OF TEXTILE INDUSTRY LEADS TO
A HUGE PROMOTION TO YARNS PRODUCERS
Proportion target in textile export
0
1. Provide the raw materials including natural cotton, oil, etc,..
2. Manufacture the inputs; the outputs of this process is yarn and
fiber, handled by weaving company.
3. Design the patterns for the products; produce the finished
goods; handled by textile companies
4. Export handled by commercial intermediaries.
5. Marketing and distribution channels.
5,000
The fact that textile industry is currently on the new trend of
development is not only true in the whole world but also in Vietnam.
The industry goes in line with the population growth as well as other
human factors. According to Statista.com, the fashion and clothing
business will have the average growth rate about 5% annually in the
period 2012-2015 and will reach the scale of 2,110 billions USD in 2025.
This will be the driving force that will push the textile industry in
general and the yarns producers in particular.
Vietnam export to
USA (2014)
13%
Textile & Garment
8.70%
Joinery
Seafood
11.30%
Others
67%
Vietnam textile export (billion USD)
CAGR : 11.75%
45
40
35
30
25
20
15
10
5
0
2014
2015
2016
2017
Export
2018
2019
2020
Growth Rate
Source : Vinatex
Yarns demand (million tons)
Firms in textile industry
4% 3%
THE MARKET OF YARN FIRMS
17%
70%
Yarn
Fiber
Textile
Dyeing
Supporting
1%
15%
84%
Private
Government
A TPP Beneficary : The most notable agreement in 2015 is the
Trans - Pacific Partnerships with the participation of 12 countries
in the Asia - Pacific arae, including the two largest textile markets
in the world, USA and Japan. With the TPP, the current import
tariffs for textile products (about 17%) will be reduced to 0%, which
25%
is the biggest opportunity ever for Vietnam's textiles industry.
Besides, The suppliers can be determined through the value chain
20%
of the textile industry – yarn production firms. In recent years, the
15%
amount of yarn and fiber produced domestically is not enough to
meet the need of the weaving and knitting enterprises so they
10%
have to import a large amount of yarn and fiber from China and
5%
India who do not participate in the TPP. This causes the legal
0%
conflicts about the origin of the products according to the TPP.
That is, exporting clothing and fashion products into a TPP’s
country requires them to have a minimum domesticalization (from
other TPP’s countries) ratio. Thus, weaving and knitting firms in
Vietnam have to import the source of yarn and fiber from the
TPP’s countries. This will be the chance for the chemical fiber
industry of our country. However, the challenges are that the FDI
firms, especially which are investing into China, will change the
investment decision towards Vietnam, creating an intensive
competition for market share with STK in particular and with all
yarn production firms in general.
In addition, the trend of using chemical yarns replacing for cotton
and natural yarns is followed by the textile company worldwide due
to their valuable properties of the chemical structures. Therefore, the
price of chemical fibers is increasing with the used quantity
compared to cotton.
Source : The Fiber Year 2014
6%
Many bilateral and multilateral trade agreements nowadays are
promoting enterprises to reduce the reliance on the domestic human
and other factors and to seek for many other potential markets
outside the borders.
FDI
Source : Ministry of Foreign affairs
As analyzed above, with the yarn market, we can consider this market
as a monopoly competitive market for all the firms in the industry.
The yarn products of companies have some differences in quality and
they are only the world-price receiver meanwhile the demand is
steadily getting higher. The firm with a larger scale of production will
get the higher economic profit.
Demand of the yarn industry comes from the next stage in the value
chain of the textile industry- the weaving the textile stage. As
analyzed above, the demand of the textile industry is increasing
sharply and steadily which also represents the growth in the output
of yarn production subsectors.
COMPARATIVE ADVANTAGES OF STK
Compared with other domestic yarn firms, the scale of production of
STK is still relatively small (37.000 tons of yarns annually) and can only
meet 0.09% the need for chemical yarn over the world. Meanwhile,
the need for chemical yarn is rising intensively and this year has
witnessed a surge of 42% in demand compared to 2014 (Source:
fiber year consulting 2015). Thus, the potential development of STK
is still promising and straightforward, and output products with high
quality could nearly be absorbed by the domestic as well as
international markets. For that reason, the competition between
yarns producers is not an uncertainty at this point.
Yarn production firms
Formosa
Selling Price
PVTEX
STK
DTH
In the fiber industry of Vietnam, there are five main competitors but
the one with the same market segment as well as production scale
with STK is Hung Nghiep Formosa Ltd. Petrochemical, Textile and
Fiber JSC. (PVTEC) is the affiliate of Petrolimex Corp. They
constructioned Dinh Vu Polyeste Yarn factory to produce PET Chip
from oil for themselves. The designed capacity of this factory is about
150.000 tons of yarns annually but it has yet put into use for 3 years
after fully constructed.
Hualon
Quality
Source : Team calculation
Porter Five’s Force Analysis
(0 -> 5 : No to High Threat to STK)
Barriers to
entrance
Intensity of
Competitive
Rivalry
STK also has to consider the potential competitors in the future from
FDI area. These competitors can invest into fiber production and also
weaving and knitting to take all of value added in every stages of the
supply chain.
Bargaining
Power of
Customers
Threat of
Substitutes
Bargaining
Power of
Suppliers
Source : Team analysis
2012A
Growth Rates (%)
Revenue
EBIT
EAT
Profitability
Net Profit Margin
EBIT Margin
Return on Asset (ROA)
Return on Equity (ROE)
Solvency
D/E Ratio
Financial Leverage
Liquidity
Current Ratio
Quick Ratio
Coverage
EBIT/Interest Expense
CFO/Interest-bearing Debt
Activity
Receivable Turnover
Days Receivable Outstanding
Inventory Turnover
Days Inventory Outstanding
Payable Turnover
Days Payable Outstanding
Cash Conversion Cycle
Asset Turnover
FINANCIAL ANALYSIS
2013A
2014A
2015F
2016F
2017F
2018F
2019F
32.19%
-2.34%
-11.64%
0.31%
34.21%
42.62%
1.66%
31.93%
23.18%
19.64%
19.64%
25.27%
14.87%
14.87%
16.95%
3.89%
3.89%
5.43%
4.00%
4.00%
6.79%
7.66%
10.17%
8.28%
17.94%
5.12%
7.52%
7.26%
14.79%
7.28%
10.06%
8.52%
15.72%
8.82%
13.05%
7.39%
17.44%
9.24%
13.05%
8.06%
19.43%
9.40%
13.05%
9.34%
19.87%
9.54%
13.05%
9.92%
18.44%
9.80%
13.05%
10.65%
17.72%
67.48%
2.17
57.07%
2.04
34.53%
1.84
91.52%
2.36
93.68%
2.41
64.98%
2.13
42.28%
1.86
25.56%
1.66
1.33
0.48
1.42
0.65
2.62
1.53
3.71
2.43
3.29
2.01
3.39
2.11
3.64
2.36
3.85
2.57
6.22
0.16
7.88
0.43
19.33
0.74
8.25
0.36
10.44
0.40
12.59
0.56
16.49
0.77
23.22
1.18
12.98
28.11
4.75
76.87
5.78
63.19
41.79
1.08
14.16
25.78
6.07
60.17
6.38
57.24
28.70
1.42
13.05
27.98
6.78
53.81
6.19
59.01
22.78
1.17
13.04
28.00
6.80
53.68
6.66
54.84
26.84
0.84
13.04
28.00
6.80
53.68
7.59
48.11
33.57
0.87
13.04
28.00
6.80
53.68
7.41
49.26
32.41
0.99
13.04
28.00
6.80
53.68
6.97
52.38
29.29
1.04
13.04
28.00
6.80
53.68
6.97
52.35
29.33
1.09
REVENUE & PROFIT
180%
160%
140%
120%
100%
80%
60%
40%
20%
0%
-20%
2010
800
700
600
500
400
300
200
100
From 2010 to 2013,
o Revenue : STK had a very good growth with 30% CAGR thanks
to continuously expanding production (Plant 1st, 2nd). In
particular, the lack of natural cotton in 2010 and 2011 caused
Revenue
Net Income
EBIT Margin
huge demand for alternative materials such as synthetic and
chemical yarns, which makes STK’s sales and reputation
improved significantly.
o Net Income : However, net income was not promisingly with 3%. CAGR. The main reason of opposite growth direction
between revenue and net income was the difference between
2011
2012
2013
2014
2015
2016
2017
2018
2019
the volatility of input and output prices. The upside magnitude
Source : Team calculation and projection
of raw material prices was higher than the downside one of the
output selling prices, which caused gross profit margin
Input and Output Prices
decrease from 23% in 2010 to 12% in 2013.
From 2013 to 2014,
o Revenue : grew slowly because the capacity of existing plants
has been reached to the maximum.
o Net Income : with an impressive growth of 43% yoy. More stable
output quality, suitable procurements and sales plans made
gross profit margin improve to 15% in 2014 and thus, net profit
margin increased from 5% to 7% in 2014.
Source : Prospectus 2015
Target and actual performance in 2015,
o Target : STK set up the target revenue of VND 1695 billions
Revenue and Net Income of Q2 (billions)
(+16% yoy) and net income 148.8 billions (+9% yoy) due to 6%
downside of selling prices and the operation of Plant 3rd with
50% of capacity.
o Actual : However, the predictions of BoD seem to be relatively
underestimated because in the first half of 2015, PET chip price
fell nearly 20% (Prospectus 2015) and average selling price
decreased 11%. Revenue until Q2/2015, thus, seriously declines
(-12.75% yoy) but net income increases slightly due to the lower
of cost of goods sold.
STK’s Performance
0
Q2/2011
Q2/2012
Q2/2013
Revenue
Q2/2014
Q2/2015
Net Income
Source : STK
STK and peers group
(TCM, GMC, GIL, TNG, EVE)
Asset Turnover
: STK
Financial Leverage
Current Ratio
0
2
4
Source : STK and peers
6
LIQUIDITY & SOLVENCY
Liquidity : current ratios and quick ratios have improved over years
and are better than others in the textile industry (2.23 to 1.91). The
reason comes not only from well management of funds and
receivables but also from overdrafts from Eximbank to meet
working capital needs, which can be used as a very useful source
of funds in order to avoid interest expense
Solvency : capital structure has been improved by reducing
interest-bearing debts. This improvements are necessary to meet
the requirements of Eximbank before STK continues to borrow
more to finance the construction of Plant 3rd and 4th in the future.
With these loans, we suggest that the financial leverage in 20152017 period will increase.
ACTIVITY
Capital Structure
(billions)
2,500
Total asset turnover : In the period 2012-2014, STK gradually used
more effectively firm’s total assets reflecting the economics of
scale in an ongoing rapid development. However, the turnover
from firm’s asset is still lower than the average of peers. In the
future, because the total investments of the Plant 3 rd and 4th are
very high, the total assets will grow faster than the revenue. This
can make the asset turnover fall below 1 unless they have no more
effective customer expansion and price control policy.
Other turnovers :
o Receivables turnover : significantly higher than peers’ average
(13.9 to 9.1). It indicates that STK has a tighter policy about
receivables from customers, which can damage sales contracts
2019
from the partners who use a high operating leverage.
o Inventory turnover : significantly higher than peers’ average (6.3
to 4.2). It indicates that STK does not have enough stock in hand
for sale, especially for large orders, which can damage their
revenue and reputation.
2,000
1,500
1,000
500
2012
2013
2014
2015
2016
Total Equity
2017
2018
Total Liabilities
Source : team calculation and projection
ROE DECOMPOSITION
2012A
2013A
2014A
2015P
2016P
2017P
2018P
2019P
EBIT Margin
Interest Burden
Tax Burden
Asset Turnover
Financial Leverage
10.1%
86.5%
87.0%
1.08
2.17
7.5%
87.2%
78.1%
1.42
2.04
10.0%
92.8%
77.9%
1.17
1.84
13.0%
86.7%
77.9%
0.84
2.36
13.0%
91.2%
79.0%
0.99
2.13
13.0%
93.7%
78.0%
1.04
1.86
13.0%
96.2%
78.0%
1.09
1.66
Return on Equity (ROE)
17.94%
14.79%
15.72%
17.44%
13.0%
89.5%
79.0%
0.87
2.41
19.43%
19.87%
18.44%
17.72%
ROE & ROA
of STK compared to peers
30%
25%
20%
15%
10%
5%
0%
STK
TCM
GIL
ROE
GMC
TNG
ROA
Source : Team calculation
EVE
EBIT Margin : improved in 2014 due to the larger gap between
input and selling prices. It will be stable at 13% in the future with
our assumptions (in Valuation)
Interest Burden : improved in 2013 and 2014 when interest
pressure was reduced and will decrease when STK use long-term
debt to finance the Plant 3rd and 4th.
Tax Burden : from 2016 to 2019, STK will have a tax advantage from
the operation of the Plant 3rd and 4th.
Asset Turnover : as analized above, because the total capital
expenditures are very high, the total assets will grow faster than
the revenue so this ratio will decrease below 1 until revenue reachs
higher.
Financial Leverage : STK finances their capital expenditures mainly
by long-term debt. Thus, the financial leverage from 2015 to 2017
will increase significantly.
All of ratio above will compose to ROE of STK business. In conlusion,
ROE will be better off from 2015 to 2017 when STK has tax
advantages, higher financial leverage and stable EBIT Margin. Beyond
the period, ROE will decrease because most of long-term debt will
have paid down in order to lower financial leverage.
VALUATION
Target Price : VND 26,800
We derive the target price mainly from 5-year Discounted Cash Flow
Model. We also give a Price Multiples and a Monte Carlo stimulation
to support for our recommendation.
Discounted Cash Flow Model
(in millions except per share)
DISCOUNTED CASH FLOW MODEL (DCF MODEL)
FCFF
Enterprise value
Cash & marketable securities
Investment in affiliates
Total Debt
Equity value
No. of shares outstanding
Rounded Equity value per share
Market premium / (discount) to fair value
1,821,527
61,160
7,688
(754,790)
1,135,585
42.305
26,800
(21.1%)
Capital Expenditures Projections
(in billions)
Capex as % of
revenue
Capex for the Plant
3rd and 4th
Total Capex
2015P
2016P
2017P
2018P
2019P
2.0%
2.0%
2.0%
3.0%
3.0%
525
336
27
0
0
554
371
67
63
66
Long-term Debt Schedule
(in billions)
2015P
2016P
2017P
2018P
2019P
207
513
(34)
686
683
138
(34)
786
786
(161)
624
624
(161)
463
463
(150)
312
Beginning
Additional borrowing
(Pay down)
Ending
Cash Flow
(in billion)
600
400
200
(200)
(400)
(600)
(800)
2015P
2016P
2017P
Net Change in Cash
CFO
Recommendation : SELL
2018P
2019P
CFI
CFF
WACC Calculation
Peers' average unlevered beta
0.9
Relevered Beta
1.29
Risk-Free Rate (Rf) (VN)
6.5%
Equity Risk Premium
11.8%
Cost of equity
21.7%
Cost of debt after tax
7.8%
WACC
16.8%
A DCF Model was used to estimate the intrinsic value of STK’s share
price due to the predictability of cash flows in the relationship of
growth and profitability. The primary model is projected for 5 years
because of STK’s strategies, which is heavily dependent on expanding
production to meet the huge demand from inside and outside
market. This model is driven by Net Operating Profit After Tax
(NOPAT) as a proxy to estimate Free Cash Flow to Firm (FCFF). We
do not use Free Cash Flow to Equity (FCFE) to discount because STK’s
capital structure has a high level of debt.
We will describe some adjustments to estimate FCFF such as Capital
Expenditures, Long-tern Debt Schedule and our assumptions.
Capital Expenditures : We project STL’s capital expenditures from
2015 to 2019 included :
o Fixed amounts as 2% from 2015 to 2017 and 3% from 2018 to
2019 for expanding production in high growth phase.
o Total investment for the Plant 3rd and 4th
Long-term Debt Schedule : We amortized existing debts and new
debt for future expansion.
Our assumptions :
o Crude oil maintain around at the level of 50USD/barrel for 5
years and thus average selling prices will be affected only by
the demand driver.
o PET Chip depreciates 25% in 2015 and STK will maintain a
proper selling margin for 8% and higher.
o SG&A expenses decrease due to the application of SAP ERP.
o Unitex Co. LTD. will not create any dividends until 2019.
o STK will not purchase more software licenses.
o Because the capital structure for the Plant 4th is uncertain, we
assume that it will be as same as the Plant 3 rd (30% of Equity
and 70% of debt)
The DCF Model is the most sensitive to the following factors :
Weighted Average Cost of Capital (WACC) : 16.8% is a appropriate
discount rate for future cash flow.
o Beta : Because STK is newly listed, we derive beta from PurePlay Method with a peers group.
o Risk-free rate : rate of 10-year Vietnam government Bond.
o Equity Risk Premium : rate from credit rating B1 of Vietnam
(according to Damodaran).
38,000
36,000
Long-term growth rate : we applied CAGR of 5% for STK’s longrun development due to Vietnam GDP’s average historical growth
rate and industry outlook of Statista.com (as mentioned above)
HOLD
34,000
We also offer “HOLD” recommendation due to changes in our
assumptions that in the best case, STK will reach the target revenue
in 2015 and/or selling prices will increase much more.
32,000
30,000
28,000
SELL
26,000
PRICE MULTIPLES
24,000
22,000
20,000
30/9/15
2/10/15
4/10/15
6/10/15
8/10/15
Price Multiples
LTM EV/EBITDA
Price
LTM P/B
Price
LTM P/E
Price
Average Share Price
6.9x
22,252
1.7x
26,440
11.1x
28,162
25,600
(Discount)
(27.3%)
Monte Carlo Statistics
Mean
Median
Standard Deviation
Skewness
Kurtosis
Coeff. of Variation
Minimum
Maximum
Range Width
25th percentile
75th percentile
12%
10%
8%
6%
4%
2%
0%
25,293
25,538
3,874
-0.3880
3.19
0.1532
6,624
36,724
30,100
22,853
28,018
We construct a proper peers group in order to estimate the intrinsic
value of STK share. The group contains two Indian firms, one
American firm and one Vietnamese firm that have the same or almost
same business with STK.
The average of three multiples approaches including EV/EBITDA, P/B
and P/E leads us to a target price of VND 25,600 with 27.3% discount
to current trading price. It supports for our recommendation.
MONTE CARLO STIMULATION
A Monte Carlo Stimulation was utilized in analyzing the potential
outcomes of STK’s growth prospects. This method stimulates a range
of random outcomes for the multiple variables affecting the intrinsic
value of STK’s share price.
We defined some key factors that are vital to the DCF Model given
its sensitivity to each input by determining their probability
distribution, mean and standard deviation. 20,000 stimulations were
run which accounted for each possibility of a feasible change in
mentioned factors. This stimulation leads to a mean target price of
VND , and of overall outcomes fall between our range of derived
target prices, which affirms our SELL recommendation.
INVESTMENT RISK
MACROECONOMICS RISK (MR)
Risk Matrix
MEDIUM
OR
MR
FINANCIAL RISK (FR)
CR
LOW
Probability
HIGH
FR SR
LOW
MEDIUM
Impact
Vietnam is currently on the trend of globalization so the economic
factors affecting STK’s business are not only from domestic but also
from outside where the consumers and suppliers of STK are. A rise
in the import tariffs of raw material as well as technical barriers from
exporting market will affect directly to STK’s inputs and outputs.
HIGH
Source : Team analysis
STK is using a high financial leverage (as other textile firms) with the
loans in both VND and USD, which leads to financial risks not only
from the fluctuation of interest rate but also from exchange rate.
State Bank of Vietnam has just lowered the interest rate on USD
deposits, which, however, is not enough to mitigate the risk from
Greenback. This risk will cause the financial expense (especially the
interest expense) to increase sharply and make net income worse.
SUPPLY CHAIN RISK (SR)
Risk
MR
FR
SR
CR
OR
Mitigation factors
Update and forecast
economics changes
Hedging interest and
foreign exchange
Negotiate short purchase
contracts and long sale
contracts
Customer and reputation
expansion, diversifying
output
Management labour
security
Nation and value of new textile
projects in Vietnam (in millions USD)
1200
As analized before, PET Chip, a derivative from oil, accounts for more
than 70% of COGS. The recent fluctuations in crude oil will affect the
input prices of STK impactfully if they are not be able to actively
manage this risk. Besides, the output prices, i.e. the yarns prices, have
to be adjusted to PET Chip and prices of other yarns and fibers but
they should keep a proper profit margin for steady development.
COMPETITIVE RISK (CR)
The competition status among yarns firms is not so intensive because
the demand of the whole market is still large and each company has
different market segments. Unfortunately, some potential
competitors of STK are the FDI enterprises in the situation that they
are intending to invest for their own yarns and fibers supply to
enhance the supply chain for themselves. It will reduce the domestic
market’s dependence on the products of STK, which indicates the
decrease of yarns demand.
OPERATING RISK (OR)
1000
This risk which is seemed to be a feature risk of manufacturing firms
comes from natural disasters (storm, flood, earthquake), the
vandalism and accidents that can cause significant damages in the
asset and labour. It can also damage the reputation of STK. In
addition, the fact that some staffs and workers do not comply to the
production regulation can reduce the quality of the products and
services.
800
600
400
200
0
China
Hong Kong
Source : GSO
Others
APPENDIX
INCOME STATEMENTS
Fiscal year
in millions VND
2012A
2013A
2014A
2015P
2016P
2017P
2018P
2019P
Fiscal year end date
31/12/2012
31/12/2013
31/12/2014
31/12/2015
31/12/2016
31/12/2017
31/12/2018
31/12/2019
Revenue
1,099,210
1,453,047
1,457,517
1,481,671
1,772,686
2,036,295
2,115,418
2,200,035
COGS
(924,734)
(1,275,820)
(1,244,748)
(1,207,562)
(1,444,739)
(1,659,581)
(1,724,066)
(1,793,029)
Gross Profit
174,476
177,228
212,769
274,109
327,947
376,715
391,352
407,006
SG&A Expenses
(62,203)
(67,827)
(66,935)
(81,492)
(97,498)
(111,996)
(116,348)
(121,002)
Other expenses
(446)
(185)
747
760
909
1,044
1,085
1,128
Operating profit (EBIT)
111,827
109,216
146,581
193,377
231,358
265,763
276,089
287,133
Interest income
3,632
7,091
2,126
2,741
3,022
2,700
4,433
6,578
Interest expense
Other non-operating
expense
Pretax profit
(17,965)
(13,859)
(7,584)
(23,430)
(22,162)
(21,115)
(16,740)
(12,364)
(733)
(7,207)
(4,959)
(4,959)
(4,959)
(4,959)
(4,959)
(4,959)
96,761
95,241
136,164
167,730
207,259
242,389
258,824
276,388
Income Taxes
(12,559)
(20,840)
(30,057)
(37,025)
(43,524)
(50,902)
(56,941)
(60,805)
Net income
84,202
74,400
106,107
130,705
163,734
191,487
201,883
215,583
No. of shares
27.0
31.1
41.8
45
47
47
47
47
Basic EPS
3,118
2,396
2,538
2,926
3,482
4,072
4,293
4,584
REVENUE BY PRODUCTS
in millions VND
Fiscal year
2012A
2013A
2014A
2015P
2016P
2017P
2018P
2019P
Fiscal year end date
31/12/2012
31/12/2013
31/12/2014
31/12/2015
31/12/2016
31/12/2017
31/12/2018
31/12/2019
1,096,635
1,348,812
1,324,000
1,356,100
1,645,859
1,803,441
1,875,579
1,950,602
23.0%
(1.8%)
2.4%
21.4%
9.6%
4.0%
4.0%
103,235
133,517
125,571
126,827
232,854
239,840
249,433
3909.1%
29.3%
(6.0%)
1.0%
83.6%
3.0%
4.0%
1,452,047
1,457,517
1,481,671
1,772,686
2,036,295
2,115,418
2,200,035
32.1%
0.4%
1.7%
19.6%
14.9%
3.9%
4.0%
DTY
% growth
FDY
2,575
% growth
Total
% growth
1,099,210
APPENDIX
BALANCE SHEET
in millions VND
Fiscal year
2012A
2013A
2014A
2015P
2016P
2017P
2018P
2019P
31/12/2012
31/12/2013
31/12/2014
31/12/2015
31/12/2016
31/12/2017
31/12/2018
31/12/2019
Cash & equivalents ST &
LT market. securities
24,099
75,562
148,164
224,542
198,500
247,668
306,397
362,440
Accounts receivable
84,653
102,610
111,723
113,662
135,987
156,209
162,279
168,770
Inventory
194,752
210,312
183,507
177,583
212,462
244,056
253,539
263,681
Other current assets
8,930
15,810
20,024
20,356
24,354
27,975
29,062
30,225
Deferred tax assets
867
1,058
1,899
1,930
2,310
2,653
2,756
2,866
Property, plant & equipment
651,191
568,677
737,645
1,185,013
1,414,566
1,327,888
1,238,443
1,153,112
Intangible assets
8,439
8,965
6,466
3,726
985
0
0
0
0
0
0
7,469
7,469
7,469
7,469
7,469
43,647
42,477
35,523
35,523
35,523
35,523
35,523
35,523
Total assets
1,016,578
1,025,471
1,244,951
1,769,804
2,032,155
2,049,441
2,035,469
2,024,085
Accounts payable
192,009
202,036
143,401
138,952
166,244
190,965
198,386
206,321
Other payables & deferred
revenue
30,877
30,605
191,779
195,581
233,995
268,791
279,235
290,405
Fiscal year end date
Investment in affiliates
Other non current assets
Short-term debt
36,751
71,091
25,927
0
0
0
0
0
Long term debt
279,916
216,007
207,106
685,870
789,322
626,143
462,964
310,947
7,778
2,669
1,921
0
0
0
0
0
Total liabilities
547,331
522,408
570,135
1,020,403
1,189,560
1,085,899
940,585
807,673
Common stock and APIC
315,060
315,426
463,080
458,593
458,593
458,593
458,593
458,593
Treasury stock
(11,754)
(11,827)
(11,827)
0
0
0
0
0
Retained earnings
164,722
198,245
222,345
289,591
382,785
503,732
635,074
756,602
Bonus and Welfare fund
Financial Reserve Fund
Total equity
Balance check
1,219
1,219
1,219
1,219
1,219
1,219
1,219
1,219
469,248
503,063
674,817
749,403
842,597
963,544
1,094,886
1,216,414
0
(0)
(0)
(0)
(0)
(0)
(0)
(0)