Linking Policies and Implementation to Learning Outcomes
Bạn đang xem bản rút gọn của tài liệu. Xem và tải ngay bản đầy đủ của tài liệu tại đây (1.04 MB, 34 trang )
Chapter 7
Linking Policies and Implementation
to Learning Outcomes
Introduction
This chapter focuses on analyzing student learning outcomes in Shanghai and
examines how varying characteristics and education practices across schools are
correlated with student learning outcomes, as measured by the 2012 Programme
for International Student Assessment (PISA) results. PISA is designed to measure the cognitive skills of 15-year-olds, mainly in math, science, and reading.
The 2012 PISA also included for the first time a module on “problem-solving
skills,” which is paid particular attention to in this chapter (box 7.1).
Shanghai’s Performance on PISA 2012
A total of 5,177 students from 155 schools in Shanghai participated in PISA
2012 (tables 7.1 and 7.2). Sampling was done in strict accordance with
Organisation for Economic Co-operation and Development (OECD) protocol
and quality assurance to generate a representative sample of 1
5-year-olds in
school in Shanghai.
Shanghai continued to be the top performer on all three major domains of
PISA (mathematics, reading, and science) in 2012. Its mean mathematics score
of 613 points, representing a 4.2 percent annualized increase from 2009, is 119
points above the OECD average, the equivalent of nearly three years of schooling.
Its mean score of 570 points in reading represents an annualized improvement
of 4.6 percent since 2009 and is equivalent to more than a year and a half of
schooling above the OECD average of 496 points. Its mean score in science, 580,
is more than three-quarters of a proficiency level above the OECD average of
501 points.
Furthermore, Shanghai also had the largest proportion of top performers
(proficient at level 5 or 6) in mathematics (55.4 percent), reading (25.1 percent),
and science (27.2 percent). Particularly, with 30.8 percent of students attaining
level 6 in mathematics, Shanghai is the only PISA participant with more students
How Shanghai Does It •
101
102
Linking Policies and Implementation to Learning Outcomes
Box 7.1 Definitions of PISA Domains
Reading literacy: An individual’s capacity to understand, use, reflect on, and engage with
written texts, so as to achieve one’s goals, to develop one’s knowledge and potential, and to
participate in society.
Mathematical literacy: An individual’s capacity to identify and understand the role that
mathematics plays in the world, to make well-founded judgments, and to use and engage
with mathematics in ways that meet the needs of that individual’s life as a constructive, concerned, and reflective citizen.
Scientific literacy: An individual’s scientific knowledge and use of that knowledge to identify
questions, to acquire new knowledge, to explain scientific phenomena, and to draw
evidence-based conclusions about science-related issues; understanding of the characteristic
features of science as a form of human knowledge and enquiry; awareness of how science
and technology shape our material, intellectual, and cultural environments; and willingness to
engage in science-related issues, and with the ideas of science, as a reflective citizen.
Problem-solving skills: The problem-solving assessment of PISA 2012 was designed to focus
as much as possible on cognitive processes and generic skills rather than domain-specific
knowledge. Problem-solving competence is defined as an individual’s capacity to engage in
cognitive processing to understand and resolve problem situations where a method of solution is not immediately obvious. It includes the willingness to engage with such situations to
achieve one’s potential as a constructive and reflective citizen.
Source: OECD 2013, 4, 17.
Table 7.1 Number of Schools in PISA 2012 Shanghai Sample
Type of school
Number of schools
Junior secondary school
Mixed senior secondary school
General senior secondary school
Model or experimental
Ordinary
Vocational secondary school
Total
60
23
40
21
19
32
155
Source: Data from OECD 2012, PISA 2012 database ( />Note: PISA = Programme for International Student Assessment.
at this top level than at any other level. Moreover, Shanghai is one of the most
equal education systems among the PISA participants. For example, it has the
highest proportion of resilient students (19.2 percent), that is, disadvantaged
students who perform among the top 25 percent of students across all participating countries and economies after controlling for socioeconomic status. The
strength of the relationship between mathematics performance and socioeconomic status is also below the OECD average.
How Shanghai Does It • />
103
Linking Policies and Implementation to Learning Outcomes
Table 7.2 Number of Students in PISA 2012 Shanghai Sample, by Type of School and
Program
Program
Type of school
Junior secondary/general
Senior secondary/general
Senior secondary/vocational
Total
Number of students
Junior secondary school
Mixed senior secondary school
General senior secondary school
General
Vocational
Mixed
Vocational secondary school
1,899
433
31a
1,381
4a
346
1,083
5,177
Source: Data from OECD 2012, PISA 2012 database ( />Note: PISA = Programme for International Student Assessment.
a. These students attend a general junior secondary program in a general secondary school, or they attend a general senior
secondary program in a vocational secondary school.
Table 7.3 Performance on Mathematics, Science, Reading, and Problem Solving, by Program
and Ordinary versus Model
PISA scores
Subject
Junior
Senior secondary Senior secondary
secondary
general
vocational
Ordinary
Model
Shanghai
Mathematics
S.E.
Science
S.E.
Reading
S.E.
592
6.27
566
5.69
554
5.49
684
3.71
636
3.12
623
3.08
540
4.78
520
4.15
515
3.95
662
5.79
625
3.81
608
3.05
718
6.26
657
5.56
649
5.44
613
3.29
580
3.03
570
2.86
Problem solving
S.E.
514
6.01
593
4.33
493
4.83
578
6.93
616
7.06
536
3.29
Source: Data from OECD 2012, PISA 2012 database ( />Note: PISA = Programme for International Student Assessment; S.E. = standard error.
Comparing Performance between Programs
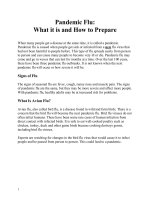
Among 15-year-olds in Shanghai, students attending senior secondary general
programs achieved the highest scores on all four PISA domains (mathematics,
science, reading, and problem solving), followed by those attending junior secondary programs (table 7.3).
The gap between general and vocational senior secondary students is particularly large. In fact, the average scores of vocational senior secondary students are
lower than those of general junior secondary students on all four domains
(figure 7.1).
Among senior secondary general program students, those attending model or
experimental schools scored higher than those attending ordinary schools on all four
domains. If model or experimental school students are compared with vocational
school students, the largest gap in performances is 178 points (on mathematics).
How Shanghai Does It •
104
Linking Policies and Implementation to Learning Outcomes
Figure 7.1 Performance on Mathematics, Science, Reading, and Problem Solving, by Program and
Ordinary versus Model
800
700
PISA scores
600
500
400
300
200
100
0
Mathematics
Reading
Science
Lower secondary
Upper secondary/vocational
Upper secondary/general
Ordinary
Problem solving
Model
Shanghai
Source: Data from OECD 2012, PISA 2012 database ( />Note: PISA = Programme for International Student Assessment.
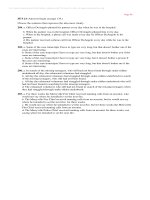
Comparative data from the 2012 OECD report reveal that between-school
variation explains 47 percent of the total variation in mathematics performance
among students in Shanghai for PISA 2012, slightly higher than Hong Kong SAR,
China (40 percent); Taiwan, China (40 percent); the Republic of Korea (39 percent); and Singapore (37 percent); but lower than Japan (53 percent) (figure 7.2).
Additionally, it was found that as much as 58.8 percent of the betweenschool difference in Shanghai is explained by study programs (lower vs. upper
level and vocational vs. general orientation), much higher than the OECD average (40 percent) and other education systems in the region (for example,
7.6 percent in Hong Kong SAR, China; 13 percent in Japan; and 35 percent in
Korea and Taiwan, China).
The following sections first compare the student and school characteristics
between programs, then investigate, within each program (junior secondary,
senior secondary general, and senior secondary vocational), how school-level
characteristics are associated with student performance.
Comparing Individual and Family Background Characteristics between
Programs
Individual and family characteristics of students attending junior secondary, general senior secondary, and vocational senior secondary programs differ significantly
from each other (table 7.4). A total of 56 percent of general senior secondary
How Shanghai Does It • />
105
Linking Policies and Implementation to Learning Outcomes
Figure 7.2 Percentage of Total Variation in PISA Mathematics Performance Explained by Between-School
Variation and Study Programs (junior or senior secondary level, vocational or general)
Finland
Iceland
Sweden
Norway
Denmark
Estonia
Spain
Canada
Poland
United States
New Zealand
Latvia
Russian Federation
Australia
United Kingdom
Portugal
Lithuania
Greece
Cyprus
Malaysia
Mexico
Colombia
Switzerland
Jordan
Montenegro
Singapore
OECD average
Korea, Rep.
Macao SAR, China
Uruguay
Taiwan, China
Hong Kong SAR, China
Israel
Thailand
Costa Rica
Chile
Brazil
Argentina
Croatia
United Arab Emirates
Romania
Peru
Serbia
Shanghai
Qatar
Austria
Slovak Republic
Tunisia
Luxembourg
Czech Republic
Italy
Belgium
Vietnam
Indonesia
Bulgaria
Germany
Japan
Slovenia
Liechtenstein
Hungary
Turkey
Netherlands
0
10
20
30
40
50
60
Between-school variation explained by students’ study programs
Between-school variation not explained by students’ study programs
Source: Data from OECD 2012, PISA 2012 database ( />Note: OECD = Organisation for Economic Co-operation and Development; PISA = Programme for International Student Assessment.
How Shanghai Does It •
70
106
Linking Policies and Implementation to Learning Outcomes
Table 7.4 Comparing Individual and Family Characteristics by Program
PISA
variable
Junior
secondary
Senior secondary
general
Senior secondary
vocational
Ordinary
Model
All
programs
female
WEALTH
HEDRES
CULTPOS
PARED
0.48
−0.87
−0.15
0.41
12.46
0.56
−0.53
0.20
0.68
13.80
0.51***
−0.91***
−0.14***
0.22***
11.89***
0.56
−0.62
0.10
0.65
13.31
0.58
−0.47*
0.29*
0.73
14.30***
0.51
−0.76
−0.03
0.46
12.79
preschool
0.85
0.93
0.85***
0.93
0.93
0.88
Source: Data from OECD 2012, PISA 2012 database ( />Note: See variable descriptions in table 7A.1. PISA = Programme for International Student Assessment.
*p < 0.05, **p < 0.01, ***p < 0.001.
students are girls, a higher proportion than in vocational senior secondary and
junior secondary programs. General senior secondary students, on average, come
from wealthier families with more home educational resources and cultural possessions and higher parental education levels than those attending vocational
senior secondary programs. Parents of general senior secondary students have on
average almost two more years of education than those of vocational senior secondary students in Shanghai. About 93 percent of general senior secondary school
students have attended preschool for at least a year, compared with 85 percent of
vocational senior secondary students and general junior secondary students.
Among general senior secondary students, those attending model or experimental schools enjoy more family wealth and home educational resources.
Parents of model or experimental school students have almost an additional year
of education compared with those of ordinary school students. Family cultural
possessions and proportion of students attending preschool do not differ significantly between ordinary and model or experimental school students.
Comparing School Characteristics
About 90 percent of the junior secondary schools and vocational senior secondary schools are public.1 The proportion of public schools is lowest among
mixed secondary schools (76 percent), whereas all general senior secondary
schools are public.
All of the private schools represented in Shanghai PISA 2012 are categorized
as government-independent because they receive less than 50 percent of their
core funding from the government. Among the private school student population in Shanghai, 36 percent attend private schools with no funding from the
government; an equal percentage attend schools that rely completely on student
fees. Half of private school students attend schools that receive about
10–30 percent of funding from government; 5.8 percent attend schools that
receive approximately 45 percent of their core funding from the government. In
contrast, funding sources seem to vary among public schools: among public
school students in Shanghai, only 60 percent attend schools that do not charge
How Shanghai Does It • />
107
Linking Policies and Implementation to Learning Outcomes
Figure 7.3 Distribution of Students by Percentage of Funding from Government versus Student Fees
b. Funding from student fees
50
0.
60
40
0.
30
0.
20
0.
0.
0
10
Weighted proportion of students
Weighted proportion of students
Public schools
0.
20
0.
30
0.
40
0.
50
0.
60
0.
60
0.
50
0.
40
0.
30
0.
20
0.
10
100
95
90
85
80
75
70
65
60
55
50
45
40
35
30
25
20
15
10
5
0
0.
0.
0
10
Percentage of funding from student fees
100
95
90
85
80
75
70
65
60
55
50
45
40
35
30
25
20
15
10
5
0
0.
60
0.
50
0.
40
0.
30
0.
20
0.
10
Percentage of funding from government
a. Funding from government
Private schools
Source: Data from OECD 2012, PISA 2012 database ( />
student fees as a funding source. As shown in figure 7.3, panel a, a small proportion of public schools in Shanghai actually receive less than half of their core
funding from the government. And 3 percent of the public school student population in Shanghai in fact attends public schools that receive more than half of
their core funding from student fees (figure 7.3, panel b).
Admissions policies differ significantly among the four types of schools:
17 percent of junior secondary schools still consider academic performance or
recommendations from feeder schools for admission. Academic performance or
recommendations from feeder schools is required for admission to the vast
majority (92 percent) of general secondary schools, but only for 60 percent of
vocational secondary schools. This means that the variation in student performance across and within senior secondary programs is not only related to school
quality, but also to the admission process that sorts students according to their
academic performance before they enter senior secondary school. Considering
that the PISA was administered not long after the 15-year-olds entered senior
secondary programs, the correlations presented in the following sections can be
interpreted both as “what school characteristics predict better student performance” and as “what kinds of schools attract better-performing students?”
The main difference between general and vocational secondary schools lies in
teaching resources: the student-to-teacher ratio is as high as 17 in vocational
secondary schools, in contrast with 9 in general secondary schools. Moreover, on
average 99 percent of the teachers in general senior secondary schools hold tertiary qualifications, compared with 92 percent in vocational senior secondary
How Shanghai Does It •
108
Linking Policies and Implementation to Learning Outcomes
schools. In addition, more creative extracurricular activities are available at senior
secondary schools and mixed secondary schools than at junior secondary schools.
Curiously, measures of student- and teacher-related factors affecting school
climate are lowest in vocational schools but highest in general secondary schools
(table 7.5). Given that both measures are based on principals’ reporting (see
table 7A.1 for detailed definitions of the two measures), it is likely that, instead
Table 7.5 Comparing Characteristics of Different Types of Schools
PISA variable
Junior secondary
school
Mixed
secondary
General
high
Vocational
high
Total
Organization, competition, and policy
public
0.90
compete
0.73
0.76
0.89
1.00
0.86
0.91***
0.87
0.91
0.82
academic
abg_math
0.17
0.95
0.61
0.95
0.92
0.92
0.60***
0.93
0.53
0.94
Teacher
STRATIO
PROPQUAL
TCMORALE
Shortage_scie
Shortage_math
Shortage_read
11.52
0.93
0.10
0.38
0.36
0.33
11.61
0.96
−0.01
0.37
0.46
0.42
9.27
0.99
0.01
0.25
0.27
0.27
17.23***
0.92***
−0.35
0.45
0.42
0.32
12.22
0.95
−0.04
0.36
0.36
0.32
Resources
SCMATEDU
SCMATBUI
COMPWEB
CLSIZE
CREACTIV
0.22
−0.18
0.98
38.63
1.74
0.01
−0.39
0.96
39.23
2.55
0.34
0.10
0.99
38.11
2.76
−0.10
−0.19
0.86
41.59
2.46***
0.15
−0.14
0.95
39.25
2.30
Autonomy
RESPRES
RESPCUR
−0.29
−0.71
−0.28
−0.87
−0.46
−0.77
−0.03
0.29
−0.27
−0.52
0.20
0.68
0.39
0.81
0.17
0.57
0.10
0.41
0.19
0.61
Climate
STUDCLIM
TEACCLIM
0.53
−0.61
−0.08
−1.00
0.89
−0.23
−1.06
−1.16
0.18
−0.69
Leadership
LEADCOM
LEADINST
LEADPD
LEADTCH
−0.32
−0.13
−0.08
−0.80
−0.32
−0.11
−0.33
−0.71
−0.26
−0.24
−0.29
−0.81
−0.69
−0.44
−0.54
−0.87
−0.39
−0.23
−0.28
−0.80
Accountability
Ppressure
scoretrack
Source: Data from OECD 2012, PISA 2012 database ( />Note: See variable descriptions in table 7A.1. PISA = Programme for International Student Assessment.
*p < 0.05, **p < 0.01, ***p < 0.001.
How Shanghai Does It • />
109
Linking Policies and Implementation to Learning Outcomes
of measuring the actual extent of disruption, the two variables indicate how
aware principals are of disruptive student behaviors and teaching practices. Thus,
caution should be exercised in interpreting these results.
Among general secondary schools, the only statistically significant difference
between ordinary and model or experimental schools lies in the student-to-teacher
ratio and class sizes (table 7.6): model or experimental schools have relatively
Table 7.6 Comparing Characteristics of Ordinary versus Model or Experimental
Secondary Schools
PISA variable
Ordinary
Model or experimental
1.00
0.83
0.94
0.94
1.00
0.89
0.90
0.89
Teacher
STRATIO
PROPQUAL
TCMORALE
Shortage_scie
Shortage_math
Shortage_read
8.80
1.00
−0.11
0.23
0.35
0.28
9.71*
0.99
0.14
0.26
0.21
0.26
Resources
SCMATEDU
SCMATBUI
COMPWEB
CLSIZE
CREACTIV
0.25
−0.11
0.99
35.25
2.62
0.44
0.30
0.98
40.87***
2.89
Autonomy
RESPRES
RESPCUR
−0.52
−0.90
−0.41
−0.66
0.17
0.57
0.16
0.58
Climate
STUDCLIM
TEACCLIM
0.47
−0.15
1.30
−0.31
Leadership
LEADCOM
LEADINST
LEADPD
LEADTCH
−0.32
−0.31
−0.36
−0.99
−0.20
−0.17
−0.23
−0.63
Organization, competition, and policy
public
compete
academic
abg_math
Accountability
Ppressure
scoretrack
Source: Data from OECD 2012, PISA 2012 database ( />Note: See variable descriptions in table 7A.1. PISA = Programme for International Student Assessment.
*p < 0.05, ** p < 0.01, ***p < 0.001.
How Shanghai Does It •
110
Linking Policies and Implementation to Learning Outcomes
higher student-to-teacher ratios (10) and larger class sizes (41) than ordinary
secondary schools. The greater local demand for model schools in general perhaps explains these differences. This variation also seems to indicate that smaller
class size and student-to-teacher ratios themselves do not automatically translate
to learning achievement. Model or experimental school principals reported
higher levels of student-related factors that affect school climate, suggesting that
they might be more aware of student disruptive behaviors.
Estimating Mathematical, Reading, and Scientific Literacy
How are different school characteristics associated with students’
mathematical, reading, and scientific literacy? For each program (junior
secondary, senior secondary general, and senior secondary vocational), PISA
scores are estimated on the three domains (mathematics, science, and reading) using school characteristics, controlling for individual and family background characteristics. Given that students were sorted into general versus
vocational programs through zhong kao at the end of ninth grade and not
long before PISA was administered, separate regression models for each
program are estimated (junior secondary, senior secondary general, and
senior secondary vocational). In interpreting the results, we do not intend to
draw any causal inferences from the estimates; rather, we aim to characterize
schools with better- versus worse-performing students. We also emphasize
that the relationship can be interpreted both ways: better-quality schools
produce better student performance, but they also admit better-performing
students to start with.
Junior Secondary
After controlling for student and family background characteristics, differences
in junior secondary students’ mathematics, reading, and science scores are associated mainly with public vs. private administration of the junior secondary
schools: private junior secondary school students, on average, perform better than
public school students on all three domains, and the differences are statistically
significant for mathematics and reading scores.
Measures of teachers and teaching resources do not seem to explain variances
in junior secondary school student performance except that better-performing
schools on the reading test are more likely to report shortages of teachers of
Chinese. Among indicators of school resources, creative extracurricular activities
available at school are related to better performances of students across all three
domains.
Lower-performing junior secondary schools tend to be more autonomous in
determining student assessment policies, textbooks, course content, and offerings,
whereas the curricula for higher-performing junior secondary schools are determined mainly by regional, local, or national educational authorities. The negative
association between autonomy in curriculum and performance is statistically
significant for mathematics but not for reading or science (table 7.7).
How Shanghai Does It • />
111
Linking Policies and Implementation to Learning Outcomes
Table 7.7 Estimates of Mathematical, Reading, and Scientific Literacy Using School
Characteristics, Junior Secondary
PISA
variable
Mathematics
Reading
Science
Coefficient Standard error Coefficient Standard error Coefficient Standard error
Organization, competition, and policy
public
−67.73
15.552***
compete
−4.00
12.631
academic
5.70
12.995
abg_math
−12.89
15.591
mixed
−16.04
11.003
−61.05
−3.42
6.18
13.018***
10.196
11.888
−28.98
−8.56
6.08
12.954
10.338
9.192
−14.68
9.546
−13.79
9.826
Teacher
STRATIO
PROPQUAL
TCMORALE
Shortage
−1.12
−8.26
6.13
7.46
0.827
47.532
3.679
9.688
−0.29
7.58
2.47
20.50
1.029
41.106
3.470
9.482*
−1.12
−1.76
3.35
5.30
0.907
42.584
3.602
8.318
Resources
SCMATEDU
SCMATBUI
COMPWEB
CLSIZE
CREACTIV
0.65
1.83
34.64
0.15
13.18
4.576
5.420
45.579
0.387
4.188**
4.98
−2.79
23.91
0.19
10.88
4.139
5.236
47.153
0.366
3.810**
−1.12
2.56
51.95
0.26
13.06
3.969
4.910
48.990
0.455
3.550***
Autonomy
RESPRES
RESPCUR
0.10
−13.84
7.588
6.857*
0.99
−8.14
6.451
7.644
10.11
−11.80
8.840
6.582
Accountability
Ppressure
9.73
scoretrack
−3.32
9.897
9.856
9.54
−9.86
8.457
8.855
7.33
−7.54
8.215
9.389
Climate
STUDCLIM
TEACCLIM
4.30
−5.66
2.976
4.123
4.29
−4.96
2.176
3.120
3.68
−5.40
2.798
3.721
Leadership
LEADCOM
LEADINST
LEADPD
LEADTCH
N
R2
−9.02
−0.72
−3.01
5.99
2190
0.349
7.741
7.643
5.491
8.443
−3.69
−2.17
−5.06
5.31
2190
0.368
6.088
7.424
5.236
7.173
−7.09
−2.81
−0.66
2.10
2190
0.343
5.430
6.990
5.292
7.164
Source: Data from OECD 2012, PISA 2012 database ( />Note: See variable descriptions in table 7A.1. All models control for individual and family background characteristics, as well as
grade-level fixed effects. PISA = Programme for International Student Assessment.
*p < 0.05, **p < 0.01, ***p < 0.001.
How Shanghai Does It •
112
Linking Policies and Implementation to Learning Outcomes
Senior Secondary General
Among measures of school resources, quality of school educational resources is
significantly and positively related to reading scores in general senior secondary
schools (table 7.8). Echoing the previous finding that model or experimental
secondary schools have larger class sizes than ordinary ones, among general
secondary school students, a one unit (student) increase in class size is associated with a 1.5 point higher score on mathematics and reading, after controlling for individual and family background characteristics. Among four
dimensions of school leadership measures, levels of teacher participation in
school leadership are positively and significantly associated with mathematical
and reading literacy.
After controlling for individual and other school characteristics, students from
mixed secondary schools perform significantly worse across all three domains
than those from nonmixed general secondary schools. Furthermore, ability
grouping between mathematics classes is associated with lower performance
among secondary school students.
Senior Secondary Vocational
For vocational school students, reading scores do not seem to be significantly
correlated with school-level characteristics after controlling for individual and
family characteristics (table 7.9). Mathematics performance is, on the one hand,
correlated with school accountability to parents: students attending schools that
face pressure from parents score on average 41 points higher on mathematics. On
the other hand, vocational schools with lower mathematics scores report significantly more student-related factors affecting school climate.
Science performance is significantly and positively related to several measures of school resources, including quality of physical infrastructure, class size,
and availability of extracurricular creative activities at vocational senior secondary schools.
Individual and Family Background Characteristics
To demonstrate the correlation with individual and family background
characteristics, school fixed effects models are used to estimate student performance (table 7.10).2 We find a highly significant correlation between background characteristics and performance across all domains.
Girls perform worse on mathematics and science and better on reading
compared with boys. Wealth is negatively correlated with performance. In
comparison, more family educational resources and cultural possessions are
associated with better performance. Similar results are found in other
OECD countries, suggesting that on the one hand, family wealth can
improve performance by providing more educational and cultural resources,
but on the other hand, weakens students’ incentives to learn and reduces the
cost of leisure relative to education (Spiezia 2011). Parental education is also
positively related to performance. Finally, students who have attended at
least a year of preschool have a significant advantage across all domains over
How Shanghai Does It • />
113
Linking Policies and Implementation to Learning Outcomes
Table 7.8 Estimates of Mathematical, Reading, and Scientific Literacy Using School
Characteristics, Senior Secondary General Students
PISA
variable
Mathematics
Organization, competition, and policy
public
18.99
30.902
compete
11.52
19.660
academic
1.63
12.044
abg_math
−37.59
10.819***
mixed
Reading
−31.88
13.880*
2.29
22.04
5.53
−34.02
Teacher
STRATIO
PROPQUAL
TCMORALE
Shortage
1.58
67.55
4.62
1.46
Resources
SCMATEDU
SCMATBUI
COMPWEB
CLSIZE
CREACTIV
4.80
2.23
35.98
1.51
13.70
6.134
5.720
54.906
0.752*
7.936
10.34
−4.16
39.21
1.56
5.60
Autonomy
RESPRES
RESPCUR
15.38
−7.24
12.577
11.760
12.15
10.74
Accountability
Ppressure
scoretrack
Climate
STUDCLIM
TEACCLIM
Leadership
LEADCOM
LEADINST
LEADPD
LEADTCH
N
R2
Science
Coefficient Standard error Coefficient Standard error Coefficient Standard error
1.266
156.502
6.063
9.339
1.94
105.35
2.31
5.69
24.317
14.438
9.225
8.429***
1.336
142.942
4.616
6.187
10.75
10.08
6.36
−23.30
28.403
14.761
11.155
8.910*
0.84
122.46
4.76
13.22
1.368
192.002
5.024
9.939
4.586*
4.417
55.913
0.581**
5.280
3.99
2.73
42.62
0.44
7.74
5.450
4.480
58.661
0.819
6.038
5.69
−4.74
10.328
8.418
7.16
−5.66
10.809
8.502
10.180
9.858
13.02
−0.56
7.868
7.816
2.17
5.78
8.867
8.086
2.33
−2.58
4.479
5.623
−1.17
0.62
3.456
4.523
0.22
−0.71
3.307
4.908
−5.69
4.03
–11.82
21.34
1632
0.227
9.102
7.428
9.151
8.198*
−0.52
3.67
–7.12
15.08
1632
0.215
7.573
6.067
7.612
6.772*
−6.79
4.27
–5.92
6.43
1632
0.176
7.589
6.196
7.151
7.871
Source: Data from OECD 2012, PISA 2012 database ( />Note: See variable descriptions in table 7A.1. All models control for individual and family background characteristics, as well as
grade-level fixed effects. PISA = Programme for International Student Assessment.
*p < 0.05, **p < 0.01, ***p < 0.001.
How Shanghai Does It •
114
Linking Policies and Implementation to Learning Outcomes
Table 7.9 Estimates of Mathematical, Reading, and Scientific Literacy Using School
Characteristics, Senior Secondary Vocational
PISA
variable
Mathematics
Reading
Science
Coefficient Standard error Coefficient Standard error Coefficient Standard error
Individual and family characteristics
female
−17.10
5.186**
WEALTH
−12.17
4.016**
HEDRES
6.06
3.220
CULTPOS
5.13
3.061
PARED
1.95
0.831*
preschool
28.33
7.672***
Organization, competition, and policy
public
−67.85
56.197
compete
−37.81
33.852
academic
−0.51
18.558
abg_math
−7.20
29.901
20.60
−6.69
5.57
3.69
1.98
21.86
4.875**
3.400
2.222*
2.394
0.726**
5.478***
−13.83
−9.53
5.29
7.73
1.84
16.30
4.995**
3.508**
2.329*
2.472**
0.636**
5.975**
12.79
−9.39
5.29
40.016
26.961
12.087
−0.32
30.28
4.17
36.582
28.534
15.045
Teacher
STRATIO
PROPQUAL
TCMORALE
Shortage
1.13
159.09
0.21
19.37
0.800
116.643
4.696
13.152
0.98
14.65
5.01
11.71
0.580
106.227
4.668
11.603
0.82
59.53
4.54
20.03
0.704
89.438
4.411
11.047
Resources
SCMATEDU
SCMATBUI
COMPWEB
CLSIZE
CREACTIV
1.95
1.68
13.07
−0.05
6.39
4.251
4.743
48.016
1.362
10.015
3.53
−1.61
7.32
0.79
4.83
4.123
3.710
27.565
0.696
8.278
−0.44
8.81
4.75
1.87
17.34
4.118
4.263*
26.475
0.930*
6.748*
Autonomy
RESPRES
RESPCUR
16.53
2.53
10.885
4.756
3.17
−3.62
7.573
4.366
−4.68
−6.86
7.341
4.783
18.154*
9.330
4.69
7.12
15.448
7.186
7.85
0.68
11.951
6.799
7.046*
5.260
−2.90
−0.79
6.834
4.414
−0.63
−3.89
7.340
4.822
2.51
14.17
−4.49
1.89
1070
0.166
7.646
13.496
9.420
6.245
−5.14
5.80
13.76
−10.48
1070
0.155
8.032
12.774
8.678
7.180
Accountability
Ppressure
41.82
scoretrack
−5.05
Climate
STUDCLIM
TEACCLIM
−14.71
7.12
Leadership
LEADCOM
LEADINST
LEADPD
LEADTCH
N
R2
−14.10
13.78
8.43
5.95
1070
0.156
9.693
18.216
13.505
9.848
Source: Data from OECD 2012, PISA 2012 database ( />Note: See variable descriptions in table 7A.1. All models control for individual and family background characteristics, as well as
grade-level fixed effects. PISA = Programme for International Student Assessment.
*p < 0.05, **p < 0.01, ***p < 0.001.
How Shanghai Does It • />
115
Linking Policies and Implementation to Learning Outcomes
Table 7.10 Estimates of Mathematical, Reading, and Scientific Literacy Using Individual and
Household Background Characteristics, Controlling for School Fixed Effects
PISA
variable
female
WEALTH
HEDRES
CULTPOS
PARED
preschool
N
R2
Mathematics
Reading
Science
Coefficient Standard error Coefficient Standard error Coefficient
−17.89
−6.96
4.62
6.11
1.40
31.12
4892
0.54
2.268***
1.664***
1.560**
1.630***
0.426**
3.879***
13.27
−5.49
4.19
4.94
1.21
21.30
4892
0.54
1.650***
1.633**
1.238**
1.222***
0.367**
3.265***
Standard error
−15.53
−5.87
4.95
8.40
1.44
16.36
4892
0.54
2.101***
1.417***
1.301***
1.250***
0.374***
3.151***
Source: Data from OECD 2012, PISA 2012 database ( />Note: See variable descriptions in table 7A.1. All models control for fixed effects and grade-level fixed effects.
PISA = Programme for International Student Assessment.
*p < 0.05, **p < 0.01, ***p < 0.001.
those who have not: the differences range from 16 points in science to as
many as 31 points in mathematics, even after controlling for gender and
other family background characteristics.
Problem-Solving Skills
Shanghai ranks sixth on overall problem-solving skills on PISA 2012. As displayed in figure 7.4, students in Singapore, Korea, and Japan, followed by students in Hong Kong SAR, China, and Macao SAR, China, score higher in
problem solving than students in all other participating countries and economies.
Disaggregation of data reveals that students in Hong Kong SAR, China; Japan;
Korea; Macao SAR, China; Shanghai; Singapore; and Taiwan, China, perform
strongest on problems that require understanding, formulating, or representing
new knowledge, compared with other types of problems. At the same time, students in Brazil, Ireland, Korea, and the United States perform strongest on interactive problems that require students to uncover some of the information
needed to solve the problem, compared with static problems for which all information is disclosed at the outset (OECD 2014).
Estimating Problem-Solving Skills Using School Characteristics
The same set of school-level characteristics is used to estimate problem-solving
scores (Model 1), controlling for student and family background (table 7.11).
The problem-solving assessment of PISA 2012 was designed to focus as
much as possible on cognitive processes and generic skills rather than domainspecific knowledge (OECD 2014). However, because the same cognitive processes
can also be used in mathematics, science, and reading, problem-solving scores
are positively correlated with the other three domains. For students in Shanghai,
as much as 71 percent of the problem-solving score reflects skills that are also
How Shanghai Does It •
116
Linking Policies and Implementation to Learning Outcomes
Figure 7.4 Problem Solving, Mean Score, PISA 2012
Singapore
Korea, Rep.
Japan
Macao SAR, China
Hong Kong SAR, China
Shanghai (China)
Taiwan, China
Canada
Australia
Finland
England (United Kingdom)
Estonia
France
Netherlands
Italy
Czech Republic
Germany
United States
Belgium
Austria
Norway
Ireland
Denmark
Portugal
Sweden
Russian Federation
Slovak Republic
Poland
Spain
Slovenia
Serbia
Croatia
Hungary
Turkey
Israel
Chile
Cyprus
Brazil
Malaysia
United Arab Emirates
Montenegro
Uruguay
Bulgaria
Colombia
OECD average
0
100
200
300
400
500
600
Sources: Data from OECD 2012, PISA 2012 database ( OECD 2014.
Note: OECD = Organisation for Economic Co-operation and Development; PISA = Programme for International Student Assessment.
measured in at least one of the three regular assessment domains; 64.8 percent of
the variance in problem-solving scores is associated with more than one regular
domain, and 5.8 percent of the variance is uniquely associated with mathematics
(OECD 2014). Because problem-solving skills are highly correlated with performance in the mathematics, reading, and science domains, which are related to
school-level characteristics, to account for omitted variable bias, mathematics,
reading, and science scores are controlled for in the full models (Model 2) used to
estimate problem-solving scores.
For junior secondary students, after controlling for math, reading, and science
scores, problem-solving skills are significantly and positively related to quality of
How Shanghai Does It • />
Table 7.11 Estimates of Problem-Solving Skills Using School Characteristics
Junior secondary
Model 1
PISA variable
Coefficient
Standard
error
Individual and family background
female
−34.73
3.101***
WEALTH
3.59
2.585
HEDRES
9.38
2.331***
CULTPOS
1.63
2.287
PARED
2.05
0.784*
preschool
30.56
5.182***
Organization, competition, and policy
public
−34.43
19.102
compete
−2.38
10.367
academic
−2.56
11.124
mixed
−4.40
12.634
Senior secondary general
Model 2
Model 1
Senior secondary vocational
Model 2
Model 1
Model 2
Coefficient
Standard
error
Coefficient
Standard
error
Coefficient
Standard
error
Coefficient
Standard
error
Coefficient
Standard
error
−34.83
7.64
2.08
−6.48
0.29
0.64
3.229***
1.554***
1.434
1.481***
0.403
3.268
−36.48
2.24
4.41
−6.33
3.06
27.59
3.052***
2.774
2.149*
2.757*
0.887**
6.839***
−28.86
6.02
2.49
−6.66
0.51
11.99
3.371***
2.028**
1.581
1.732***
0.711
4.790*
−29.34
−2.56
8.43
−3.30
2.00
31.42
5.236***
3.719
2.599**
2.659
0.705**
6.494***
−30.51
5.38
3.20
−6.59
0.29
9.20
4.052***
1.961**
1.394*
1.493***
0.516
4.385*
23.39
1.21
−8.82
7.92
13.083
11.182
10.201
12.276
11.86
31.84
3.05
−23.69
29.761
14.114*
14.629
13.202
1.45
17.22
−3.18
3.30
22.571
10.892
11.955
10.237
−103.47
−32.46
18.89
0.851
37.025
4.176
0.002
3.13
167.40
9.01
0.23
1.495*
152.501
6.041
4.057
1.43
130.03
5.83
1.85
1.733
103.232
4.681
4.459
−1.35
−34.89
−3.53
−5.00
5.788
7.291
−1.36
8.83
5.782
6.102
−10.45
−8.42
Teacher
STRATIO
PROPQUAL
TCMORALE
TCSHORT
0.04
−36.62
6.94
0.00
0.961
42.847
5.178
0.002
1.00
−24.82
3.46
0.00
Resources
SCMATEDU
SCMATBUI
8.04
−5.67
4.305
5.176
7.84
−5.90
3.294*
3.528
2.90
9.07
34.691**
18.600
13.366
−53.80
−0.44
13.14
41.634
27.297
19.956
0.858
92.405
6.864
9.602
−2.24
−173.50
−5.15
−6.79
1.047*
97.933
5.862
8.049
9.136
5.451
−11.51
−8.02
8.133
5.582
table continues next page
117
118
Table 7.11 Estimates of Problem-Solving Skills Using School Characteristics (continued)
Junior secondary
Model 1
Senior secondary general
Model 2
Coefficient
Standard
error
Coefficient
COMPWEB
CLSIZE
CREACTIV
54.06
0.49
8.01
51.119
0.501
4.433
31.38
0.40
−1.38
Autonomy
RESPRES
RESPCUR
9.15
−1.52
8.490
8.247
Accountability
Ppressure
scoretrack
3.26
−4.17
4.99
−12.30
PISA variable
Climate
STUDCLIM
TEACCLIM
Leadership
LEADCOM
1.38
LEADINST
12.01
LEADPD
−4.89
LEADTCH
−2.67
Main domain performance
Mathematics
Reading
Science
N
2224
Standard
error
Model 1
Senior secondary vocational
Model 2
Coefficient
Standard
error
Coefficient
52.898
0.513
3.745
19.86
0.33
7.10
41.137
1.072
9.612
−19.53
−0.88
0.50
11.03
6.72
6.268
4.264
11.34
−10.34
11.146
10.693
10.428
10.580
−5.56
−1.12
7.921
10.931
17.60
−2.28
4.971
6.463
1.11
−6.70
4.155
5.766
7.918
6.480
6.775
6.366
6.27
13.63
−1.63
−7.08
8.485
6.198*
6.300
6.265
0.52
0.40
−0.09
2224
0.047***
0.067***
0.055
Model 1
Model 2
Coefficient
Standard
error
Coefficient
63.312
0.876
6.127
−1.81
−1.26
13.22
35.836
0.955
9.819
−20.23
−1.38
13.54
3.67
−3.94
7.915
6.416
1.58
27.07
10.149
7.721
4.65
−7.28
11.810
7.668
35.78
−23.57
17.350*
10.338*
5.34
−26.30
13.622
10.103*
3.74
−6.59
4.813
5.936
2.20
−4.38
3.102
3.771
−7.80
14.71
6.678
7.613
−0.08
11.22
7.195
8.100
−0.02
−10.02
−5.10
14.28
10.276
7.642
7.643
10.939
4.29
−12.85
3.74
−0.23
7.516
7.655
5.396
9.165
13.37
−34.37
21.60
1.74
11.561
16.177
10.871
10.118
17.33
−54.36
26.43
−0.97
12.987
12.138***
10.689*
7.687
0.49
0.41
−0.07
1070
0.040***
0.076***
0.064
1632
0.48
0.36
−0.01
1632
Standard
error
0.047***
0.067***
0.058
Source: Data from OECD 2012, PISA 2012 database ( />Note: See variable descriptions in table 7A.1. All models contain grade-level fixed effects. PISA = Programme for International Student Assessment.
*p < 0.05, **p < 0.01, ***p < 0.001.
1070
7.352
8.400**
−9.42
26.90
Standard
error
30.225
0.656*
13.641
6.621
8.146**
Linking Policies and Implementation to Learning Outcomes
school educational resources, as well as to principals’ instructional leadership,
measured by how often principals promote teaching practices based on recent
educational research, praise teachers, and draw teachers’ attention to the importance of pupils’ development.
For general senior secondary students, although student-to-teacher ratios and
competition from other schools seem to be related to higher problem-solving
scores in Model 1, the relationship seems to be accounted for in part by performances on mathematics, reading, and science, given that the coefficients become
small and no longer statistically significant once performance on the three regular
domains is controlled for in Model 2.
The most interesting results are found among vocational senior secondary
students. After controlling for student and family background, public school
students score as much as 103 points lower on problem-solving skills than do
private school students. The gap seems to be accounted for in part by performance in mathematics, reading, and science, seeing as the size of the coefficient
is halved and no longer statistically significant once differences in the three main
domains are accounted for. Holding mathematics, reading, and science performance constant, student-to-teacher ratio and class size are negatively correlated
with problem-solving scores.
Vocational schools whose curriculum and assessment policies are determined
by school councils, principals, or teachers, as opposed to national, regional, or
local educational authorities, score higher on problem-solving skills, even after
controlling for mathematical, reading, and scientific literacy.
Between the two accountability measures, vocational schools faced with
parental pressure score higher on problem solving, but the difference goes away
once mathematical, reading, and scientific literacy are accounted for. In comparison, vocational schools whose academic performance is tracked by an education
authority score lower on problem solving, and the difference remains even after
accounting for mathematical, reading, and scientific literacy.
Among various dimensions of school leadership, vocational schools with better problem-solving performance see principals more often promoting institutional improvements and professional development, but less often demonstrating
instructional leadership (by promoting teaching practices, praising teachers, and
drawing teachers’ attention to the importance of pupils’ development).
Among student and family background characteristics, girls in every type of
program score lower than boys on problem solving, and the size of the difference
does not seem to change much after differences in mathematical, reading, and
scientific literacy are accounted for. This finding suggests that girls’ disadvantages
in problem-solving skills might be independent of their lower mathematics and
science performance observed before.
Family wealth only has a significant and positive effect on problem solving
after adjusting for performance in the three main domains. Similarly, family cultural possessions have a negative and significant correlation with problem-solving
scores after we control for mathematics, reading, and science scores. The positive
relationship between home educational resources and problem-solving skills is
How Shanghai Does It •
119
120
Linking Policies and Implementation to Learning Outcomes
no longer statistically significant once mathematical, reading, and scientific
literacy are accounted for, except for vocational school students. Students who
have attended at least a year of preschool score higher on problem solving in all
three types of programs, but the advantage goes away once differences in
mathematical, reading, and scientific literacy are accounted for.
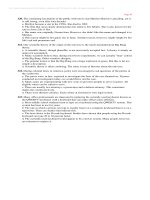
Problem Solving by Nature and Process: Comparing Problem-Solving Skills
by Nature, Process, and Program
This section takes an in-depth look at problem-solving skills by nature of the
problem situation and the different problem-solving processes, as measured by
PISA 2012 (box 7.2). First the solution rates3 on each specific type of problem
are compared. Then logistic regression models are used to predict the solution
rates with the same set of school characteristics.
Senior secondary general school students have the highest solution rates on
both static and interactive problems (figure 7.5). Vocational students have
Box 7.2 Definitions and Implications of the Nature and Processes of Problem
Solving
PISA 2012 defines problem-solving competence as an individual’s capacity to engage in cognitive processing to understand and resolve problem situations where a method of solution is
not immediately obvious. It includes the willingness to engage with such situations in order to
achieve one’s potential as a constructive and reflective citizen.
Nature of the problem situation
• Static problems: Information disclosed to the student at the outset is sufficient to solve the
problem. These are the typical textbook problems encountered in schools.
• Interactive problems: Interaction with the problem situation is a necessary part of the
solving activity. These are the types of problems encountered in most contexts outside of
schools. To excel in interactive tasks, it is not sufficient to possess the problem-solving
skills required by static, analytical problems; students must also be open to novelty, tolerate doubt and uncertainty, and dare to use intuition (“hunches and feelings”) to initiate a
solution.
Problem-solving processes
Knowledge-acquisition tasks require students to generate and manipulate the information in a
mental representation. The movement is from concrete to abstract, from information to
knowledge. Students who are strong on these tasks are good at generating new knowledge;
they can be characterized as quick learners, who are highly inquisitive (questioning their own
knowledge, challenging assumptions), generating and experimenting with alternatives, and
good at abstract information processing.
box continues next page
How Shanghai Does It • />
121
Linking Policies and Implementation to Learning Outcomes
Box 7.2 Definitions and Implications of the Nature and Processes of Problem Solving (continued)
• Exploring and understanding involves exploring the problem situation by observing it,
interacting with it, searching for information, and finding limitations or obstacles; and demonstrating understanding of the information given and the information discovered while
interacting with the problem situation.
• Representing and formulating involves using tables, graphs, symbols, or words to represent aspects of the problem situation; and formulating hypotheses about the relevant
factors in a problem and the relationships between them, to build a coherent mental representation of the problem situation.
Knowledge-utilization tasks require students to solve a concrete problem. The movement is
from abstract to concrete, from knowledge to action. Students who are good at tasks whose
main cognitive demand is “planning and executing” are good at using the knowledge they
have; they can be characterized as goal-driven and persistent.
• Planning and executing involves devising a plan or strategy to solve the problem, and executing it. It may involve clarifying the overall goal, and setting subgoals.
• Monitoring and reflecting involves monitoring progress, reacting to feedback, and reflecting on the solution, the information provided with the problem, or the strategy adopted. It
combines both knowledge-acquisition and knowledge-utilization aspects.
Source: Adapted from OECD 2014.
Figure 7.5 Solution Rates on PISA Items Measuring Different Natures and Processes of
Problem Solving, by Program
By process
Monitoring and reflecting
Planning and executing
Exploring and understanding
By nature
Representing and formulating
Interactive
Static
0
10
20
30
40
50
60
70
Percent
All Shanghai
Model
Ordinary
Upper secondary general
Upper secondary vocational
Lower secondary
Source: Data from OECD 2012, PISA 2012 database ( />Note: PISA = Programme for International Student Assessment.
How Shanghai Does It •
80
90
122
Linking Policies and Implementation to Learning Outcomes
significantly lower solution rates on interactive problems, even compared with
junior secondary students. Among general senior secondary students, model or
experimental school students have significantly higher solution rates than ordinary school students on both types of problems.
Senior secondary general students also have higher solution rates on all four
types of problems measuring different problem-solving processes, while vocational students have the lowest solution rates. The gap is particularly pronounced
(a 32 percentage point difference) on items involving “representing and formulating.” Model secondary school students have higher solution rates on all four
kinds of problem-solving processes than do ordinary secondary school students,
and the advantage is most pronounced on “monitoring and reflecting” questions
(12 percentage point difference).
Estimating Odds Ratio for Success, by Nature and Process
Nature of Problems: Static versus Interactive
PISA tested students on problem-solving tasks of two distinctive natures: the
static problems are typical “textbook” problems that can be solved by using information disclosed at the outset, whereas interactive problems often require
students to uncover the information necessary for solving the problem.
Despite the distinctive natures of the problem-solving tasks, the regression
models seem to demonstrate similar associations with school-level characteristics
(table 7.12). For example, for both static and interactive problems, public school
students have 34 percent lower odds of receiving full credit. Mixed secondary
school students also have a disadvantage on both static and interactive problem
solving.
Teacher qualities do not seem to have a significant relationship with either
static or interactive problem solving, except that higher teacher morale is
associated with slightly higher odds of students succeeding in solving static
problems.
Among school resource measures, the more creative extracurricular activities
available at a school, the more likely students are to succeed in solving either
type of problem. In addition, larger class size is related to slightly higher odds of
succeeding on static problem solving.
Schools with better performance on interactive problems also report more
student-related factors that disrupt school climate, consistent with the descriptive findings that principals of better-performing schools might be more aware of
students’ disruptive behaviors. Teacher-related factors that affect school climate
are associated with a lower probability of students successfully solving either
type of problem.
Among background characteristics, girls are significantly less likely to succeed
in problem solving than boys, regardless of the nature of the problems. Home
educational resources are associated with higher odds of solving interactive
problems, whereas cultural possessions are associated with higher odds of solving
static problems. Students who have attended preschool for at least a year are
more likely to solve interactive problems than those who have not.
How Shanghai Does It • />
123
Linking Policies and Implementation to Learning Outcomes
Table 7.12 Estimates of Odds Ratios for Success, by Nature of Problem
Static
PISA variable
Coefficient
Interactive
Standard error
Coefficient
Standard error
Individual and family background
female
0.71
WEALTH
1.07
HEDRES
1.01
CULTPOS
1.11
PARED
1.00
preschool
1.15
0.046***
0.064
0.047
0.046*
0.015
0.136
0.73
1.06
1.09
0.97
1.02
1.37
0.048***
0.049
0.043*
0.037
0.012
0.160*
Organization, competition, and policy
public
0.66
compete
0.99
academic
1.13
mixed
0.78
0.126*
0.093
0.111
0.066**
0.66
0.98
1.02
0.81
0.115
0.110
0.085
0.073*
Teacher
STRATIO
PROPQUAL
TCMORALE
TCSHORT
1.00
0.90
1.11
1.00
0.008
0.503
0.053*
0.000
1.00
1.20
1.01
1.00
0.007
0.624
0.035
0.000
Resources
SCMATEDU
SCMATBUI
COMPWEB
CLSIZE
CREACTIV
1.01
0.96
1.14
1.01
1.17
0.056
0.049
0.333
0.004*
0.060**
0.99
1.06
1.35
1.00
1.11
0.034
0.042
0.383
0.004
0.049*
Autonomy
RESPRES
RESPCUR
1.01
0.96
0.069
0.049
1.08
1.00
0.058
0.046
Accountability
Ppressure
scoretrack
1.06
0.99
0.111
0.075
1.10
0.95
0.085
0.073
Climate
STUDCLIM
TEACCLIM
1.06
0.91
0.038
0.036*
1.08
0.89
0.034*
0.033**
Leadership
LEADCOM
LEADINST
LEADPD
LEADTCH
0.90
0.98
0.94
1.04
0.060
0.066
0.064
0.069
1.05
1.03
0.94
1.02
0.058
0.057
0.050
0.054
Program
General high
Vocational high
N
1.93
0.82
1,145
0.230***
0.119
1.81
0.74
1,145
0.194
0.089*
Source: Data from OECD 2012, PISA 2012 database ( />Note: See variable descriptions in table 7A.1. PISA = Programme for International Student Assessment.
*p < 0.05, **p < 0.01, ***p < 0.001.
How Shanghai Does It •
124
Linking Policies and Implementation to Learning Outcomes
After accounting for student and school characteristics, attending a general
secondary school almost doubles the odds of solving static problems over junior
secondary schools, and the difference is statistically significant. In comparison,
vocational school students are much less likely, on average, than junior secondary
school students to solve interactive problems, and the difference is statistically
significant.
Problem-Solving Process
The various items on the PISA problem-solving test also distinguish between
knowledge-acquisition and knowledge-utilization tasks, each of which
incorporate two problem-solving processes. Knowledge-acquisition tasks,
corresponding to “exploring and understanding” and “representing and formulating” processes, require students to generate new, abstract knowledge by
processing and manipulating information. Knowledge-utilization tasks, in
contrast, correspond to “planning and executing” and require students to use
abstract knowledge to solve concrete problems. In addition, items that
involve “monitoring and reflecting” tasks test students on both knowledge
acquisition and knowledge utilization.
Among knowledge-acquisition tasks, the odds ratio for items involving
“representing and formulating” does not seem to vary by school characteristics after controlling for background characteristics and the fixed effects of
different programs (table 7.13). For items requiring “exploring and understanding” processes, several school-level characteristics are associated with
higher success rates: students from schools that use academic criteria for
admission (achievement or recommendations from feeder schools) are more
Table 7.13 Estimates of Odds Ratio for Success, by Problem-Solving Process
Representing and
formulating
Planning and
executing
Monitoring and
reflecting
Coefficient
Standard
error
Coefficient
Standard
error
Coefficient
Standard
error
Individual and family background
female
0.54
0.047***
WEALTH
1.10
0.077
HEDRES
1.09
0.056
CULTPOS
1.05
0.058
PARED
1.04
0.019*
preschool
1.17
0.195
0.84
1.09
1.04
1.02
0.99
1.27
0.069*
0.063
0.051
0.056
0.015
0.183
0.75
1.04
1.07
0.97
1.01
1.35
0.065**
0.061
0.054
0.038
0.014
0.173*
0.83
1.02
0.99
1.12
1.02
1.53
0.075*
0.069
0.060
0.066
0.018
0.218**
Organization, competition, and policy
public
0.76
0.166
compete
0.92
0.162
academic
0.98
0.118
mixed
0.79
0.106
0.61
0.96
1.27
0.87
0.163
0.113
0.135*
0.084
0.72
1.16
0.94
0.81
0.093*
0.094
0.072
0.070*
0.59
0.80
1.06
0.72
0.119*
0.096
0.116
0.082**
PISA variable
Coefficient
Standard
error
Exploring and
understanding
table continues next page
How Shanghai Does It • />
125
Linking Policies and Implementation to Learning Outcomes
Table 7.13 Estimates of Odds Ratio for Success, by Problem-Solving Process (continued)
Representing and
formulating
PISA variable
Coefficient
Standard
error
Exploring and
understanding
Coefficient
Standard
error
Planning and
executing
Monitoring and
reflecting
Coefficient
Standard
error
Coefficient
Standard
error
Teacher
STRATIO
PROPQUAL
TCMORALE
TCSHORT
1.01
3.11
1.04
1.00
0.012
2.223
0.057
0.000
0.99
0.79
1.07
1.00
0.009
0.490
0.055
0.000
1.00
0.71
1.05
1.00
0.008
0.285
0.038
0.000*
1.00
0.76
0.99
1.00
0.009
0.486
0.054
0.000**
Resources
SCMATEDU
SCMATBUI
COMPWEB
CLSIZE
CREACTIV
0.98
1.01
1.39
1.00
1.11
0.052
0.059
0.563
0.007
0.072
1.05
0.97
1.49
1.01
1.17
0.049
0.056
0.432
0.005
0.067*
0.98
1.08
1.10
1.00
1.10
0.039
0.045
0.254
0.003
0.047*
0.93
1.06
1.58
1.00
1.18
0.046
0.056
0.495
0.004
0.065**
Autonomy
RESPRES
RESPCUR
1.21
0.92
0.143
0.070
1.02
1.04
0.073
0.056
1.00
0.99
0.041
0.043
1.08
0.97
0.084
0.068
Accountability
Ppressure
scoretrack
1.15
0.99
0.131
0.108
1.14
0.89
0.124
0.090
0.93
1.00
0.068
0.065
1.30
0.99
0.145*
0.091
Climate
STUDCLIM
TEACCLIM
1.09
0.90
0.056
0.053
1.10
0.88
0.045*
0.044*
1.07
0.90
0.029*
0.029**
1.02
0.97
0.046
0.052
Leadership
LEADCOM
LEADINST
LEADPD
LEADTCH
1.01
1.08
0.89
1.02
0.098
0.094
0.078
0.084
0.99
0.94
1.01
0.99
0.064
0.075
0.064
0.067
0.99
0.97
0.99
1.03
0.047
0.055
0.050
0.042
1.03
1.19
0.86
1.01
0.100
0.100*
0.063*
0.091
Program
General high
Vocational high
N
2.28
0.72
1145
0.375***
0.149
1.67
0.77
1145
0.219***
0.103
1.78
0.94
1145
0.183***
0.119
1.96
0.64
1145
0.251***
0.104**
Source: Data from OECD 2012, PISA 2012 database ( />Note: See variable descriptions in table 7A.1. PISA = Programme for International Student Assessment.
*p < 0.05, **p < 0.01, ***p < 0.001.
likely to succeed; creative extracurricular activities available in school are also
associated with higher success ratios.
Similar to findings on interactive problem solving, schools that report more
student-related factors affecting school climate actually have better performance
on both “exploring and understanding” and “planning and executing” tasks,
whereas reported teacher-related factors are associated with lower success rates
How Shanghai Does It •