bar chart Biểu đồ cột
Bạn đang xem bản rút gọn của tài liệu. Xem và tải ngay bản đầy đủ của tài liệu tại đây (242.12 KB, 10 trang )
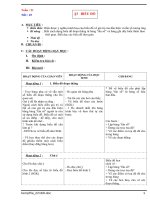
Reasons for Choosing a University
How do foreign students choose which university to go to in the UK?
The graph below, from an excellent set of exercises from OneStopEnglish.com gives some of the
reasons for choosing a university. Bar charts giving reasons why foreign students choose to study in
the UK. (Click for the Acrobat download from OneStopEnglish).
Unscramble the sentences
Here are the fifteen sentences, ready for you to paste into word and unscramble. You will have to
delete some, put them into paragraphs and add some extra or linking information.
1. The chart shows 11 __________ first year students from overseas chose a particular university.
2. Good language support comes __________at 20 percent.
3. Language of tuition is top of the survey __________95%.
4. At 95 percent of the sample, Language of tuition is the main __________a university.
5. The survey of 1,000 first year overseas students __________at universities in the UK.
6. Good language support at 20% is the factor __________least when making a choice about which
university to attend.
7. Language of tuition __________a reason by nearly five times as many students as Good
language support, at 95% and 20% respectively.
8. The top three reasons are Language of tuition, Quality of teachers, Up-to-date teaching facilities,
__________.
9. According to the graph, the main reason __________ the language of tuition.
10. The various factors __________ into two groups, namely those related to teaching and nonteaching related.
11. While around 95 percent of the students gave the language of tuition as the main reason for
choosing a university, __________ modern teaching methods.
12. The cost of accommodation at 80 percent __________ the cost of tuition at around 75 percent.
13. Eighty percent of the sample mentioned the cost of accommodation as a reason for choosing a
university __________for the cost of tuition.
14. __________the cost of accommodation and the cost of tuition than Location at 80% and 75%
respectively.
15. Good language support was stated by only 20 percent of the sample as a reason for choosing a
university __________at 30 percent.
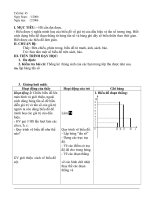
Reasons for Choosing a University
The chart shows 11 reasons why first year students from overseas chose a
particular university.
The survey of 1,000 first year overseas students was carried out at universities
in the UK.
The top three reasons are language of tuition, quality of teachers, up-to-date
teaching
facilities, respectively. Language of tuition comes top of the survey at 95%.
Another
important reason is teaching facilities. About 90% of students mentioned this
as a reason. The third top reason was the quality of the staff. This also
accounted for 90% of student choices. The reputation of the university was also
a crucial factor. About 70% of the respondents picked this as a reason for their
choice of school. Non-teaching related reasons were also important. Cost was a
major factor. More than three-quarters of the students said that cost of tuition
was an important reason for choosing a college. A similar number picked a
college based on accommodation costs. The friendliness of a university was
given as a reason by two-thirds of students.
Some factors were relatively unimportant. These included good language
support, at
only 20% of students, and modern teaching methods, at 30%.
In conclusion, the reasons for choosing a particular university can be divided
into
teaching-related reasons and non-teaching reasons, but the most important
factors
are language, the quality of the staff and facilities, and cost.
The chart shows 11 reasons why first year students from overseas chose a particular university. The
survey of 1,000 first year overseas students was carried out at universities in the UK. The top three
reasons are language of tuition, quality of teachers, and up-to-date teaching facilities.
According to the graph, the main reason is the language of tuition. At 95 percent of the sample, it
was the main reason most students gave for choosing a university. The second biggest factor was
quality of teachers, at 90%, followed by facilities, also at 90%.
Non-teaching factors were also important. Tuition costs were quoted as a reason by 75%, and
location was mentioned by 70% of students. The cost of accommodation is also an important factor
for 80% of respondents. Almost two-thirds of students said that the friendliness of the university
was important.
In conclusion the various factors can be divided into two groups, namely those related to teaching
and non-teaching related. However, the most important are the language and the teachers.
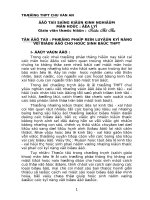
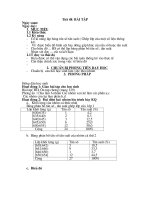
Bar Chart: Changes in Meat Consumption, USA, 1950
to 2000.
The chart shows changes in the quantities of meat and poultry (chicken turkey, etc) eaten in the
USA between 1950 and 2000.
The graph shows changes in the amount of chicken and beef eaten in the USA over the last 50
years. Overall, beef consumption is declining, while Americans are eating more and more chicken.
The biggest change in the graph is the increase in poultry consumption. This soared from just 12
kilograms per person per year in 1950 to almost 50 kilograms in 2000, increasing four times. The
biggest increase was between 1990 and 2000, when it jumped almost by half, from just 35 kilos to
almost 50kg. That was the period when poultry consumption overtook beef for the first time.
The other trend in the graph is the decline in beef consumption. Although more beef was eaten in
2000 than in 1950, at 40 kilos per person per year compared to 32 kilos in 1950, there has been a
big drop since 1970. Sales of beef peaked in 1970 at almost 50kg and have declined steadily since
then.
In conclusion, Americans are eating much more meat overall than they were in 1950, but the
proportion of chicken and turkey products has increased sharply, while beef consumption is
declining in importance.
195 words
Literacy Rates: Suggested Answer
Bar Chart: Literacy Rates, 1990 and 2000.
The chart shows literacy rates for men and women in selected countries in 1990 and 2000.
The graph shows changes in literacy rates in different countries between 1990 and 2000, for men
and women. Overall more and more people are able to read, and there have been significant
improvements for women, although they lag behind men in literacy.
The most obvious trend in the graph is that women have lower literacy rates in most of the countries
in the graph. For example, in Bangladesh in 1990, 45% of men could read and write, but only 25%
of women. The difference was even bigger in Pakistan, with 50% of men being literate but only
20% of women. Even in Kuwait and China, slightly more men than women could read and write.
The second biggest trend in the graph is the improvement in literacy between 1990 and 2000. In all
countries shown, figures for both men and women improved. The biggest change was in Pakistan,
from 49% of men in 1990 to 57% over the ten year period. Even in countries with relatively high
literacy rates, such as China or Brazil, there were significant increases for men.
However, the increases in literacy rates for women were much higher. In Egypt, the percentage of
non-illiterate women jumped from 35% to 44%, and in Pakistan from 20% to 28% over the decade.
In conclusion, almost all the countries in the graph have a long way to go before achieving 100%
literacy rates, and women in particular need support in order to increase their reading ability.
However, all countries improved over the ten years, and women appear to be catching up even in
the lowest countries.
Bar Graph: Women, number of babies, and
education: Suggested Answer 1
The graph shows figures for the number of children that women have depending on their education
level. Overall, as women become more educated, they have fewer children.
A main trend in the graph is that family size varies widely. In Niger, family size for women with no
education is 7.8. In contrast, in Guatemala, the number of children for women who have completed
secondary education is as low as 2.6, and a similar pattern call be seen in Haiti. Four of the
countries in the graph, Kenya, Pakistan, the Philippines and Jordan have almost the same number of
children for women with secondary education, at about 3.5 kids.
However, the main pattern in the graph is that there are huge differences inside countries depending
on the education of women. For example, in Niger, women without education have 7.8 children, but
women who have completed secondary school have only 4.6 children. The gap is even bigger in
Guatemala. Women without education have almost three times the number of children, at 7.1
compared to only 2.6. There are also huge differences in Yemen and Haiti. In some of the other
countries, the difference is not so great. For instance, in Jordan, the difference in family size
between women with no education and secondary is only 1 child.
Overall, although there are big differences between countries, the biggest difference is made by
education.
Bar Chart: Who Uses the Internet?
The chart shows the percentage of Internet users by age between 1998 and 2000.
Write a short description of the graph.
Complete the sentences
1.
2.
3.
4.
5.
In 1998, less than one Internet user in twenty was ___________
The majority of users in 1998 were ___________
Children _______________ for only 2% of users in 1998.
Between 1998 and 1999, the proportion of children using the Internet ___________.
The percentage of older adults using the internet _________________ between 1998 and
1999.
6. Overall, there was a steady _________________ in the percentage of 16- 30 year olds using
the Internet.
7. By 2000, older users __________________ ten percent of the total number.
8. Together, children and older users comprised almost ________________ of the total number
of Internet users.
Bar Chart: Money spent per week on Holidays, by
age.
The chart shows spending in pounds per week by age on holidays in the UK and holidays abroad (in
other countries) in the UK in 2002.
The graph shows spending per week on holidays inside and outside the UK by different age groups
in the UK. Overall, middle-aged travelers spend the most on vacations.
The biggest spenders on overseas holidays are the 50-64 age group. They spent over £15 a week,
compared to £14 for the next group (30-49 years olds) and £12 a week for the 65-74 year olds. The
lowest spending group on overseas holidays were elderly adults, at less than £4 a week.
All age-groups spent much more on overseas holidays than on domestic tourism. For young adults,
the difference in spending was very noticeable. They spent less than £2 a week on UK holidays, but
almost £10 visiting overseas locations. Travelers in the 50-64 year old age group spent five times as
much on traveling to foreign destinations as they did on travel in the UK, at £15 compared to just
£3. Only in the elderly age-group was the difference less marked, although the group which spent
most on UK travel was the 65-74 year old age group, at £4.
In conclusion, spending on both UK and foreign travel appears to rise up to age 64, but declines
sharply after.
Bar Chart: Money spent per week on public
transport, by age, UK, 2002.
The chart shows spending in pounds per week by age on public transport (rail, bus and taxi) in the
UK in 2002.
Public transport expenditures for British commuters (model answer)
This bar chart illustrates how many pounds sterling five age groups in Britain spent
weekly on three forms of public transport in 2003. Overall, the older people get, the less
they spend.
First, the youngest, those under 30, spent about 6.3 pounds per week on taxis. The group
age 30-50 spent almost as much, and those 50-65 marginally less, around 5.9 quid. In
contrast, the 65-75 year olds put out less than half that and the eldest group only about
1.5 pounds weekly. Turning to rail transport, again the youngest group allotted the most
for this form of transport, nearly 4 pounds weekly. The two groups covering 30-65 years
averaged approximately 2.2 while those over 65 spent, again, about half that. Finally, bus
took the smallest proportion of the transportation budget, roughly 1.7 quid for people up to
65. The last two groups spent slightly more on bus than train.
To sum up, cabs took the lion’s share of the transportation budget for all. In general, those
of working age spend significantly more on public transport than the elderly.
Marriages, Divorce, & Remarriage
The graph shows statistics for first marriages, divorces and remarriages in the UK.
Write a short description of the chart.
From: />Download in Excel (Right-click, save to your desktop)
More detail
Here is a more detailed version of the information above:
Here is the official description of the graph above, from the UK National Statistics office.
Changes in household and family patterns reflect changes in the partnering and marital status of the
population over time. Marriage is still the usual form of partnership between men and women.
However, the total number of marriages in the United Kingdom has fallen from a peak in 1972. In
1997 there were 310 thousand marriages, among the lowest figures recorded during the twentieth
century.
The number of first marriages has decreased substantially since its peak in 1970. In 1997 there were
181 thousand first marriages for both partners, less than half the number in 1970.
Slightly over two-fifths of marriages in 1997 were remarriages for either or both partners. Early in
the twentieth century remarriage was relatively uncommon, but since the 1960s the number of
remarriages has increased. While most of the few remarriages at the turn of the century in England
and Wales involved a widow or widower, more recently at least one partner remarrying has usually
been divorced. These trends were notably accentuated following the implementation of the Divorce
Reform Act 1969 in 1971