An examination of the effects of motivation and satisfaction on destination loyalty: a structural model Yooshik Yoona,, Muzaffer Uysalb
Bạn đang xem bản rút gọn của tài liệu. Xem và tải ngay bản đầy đủ của tài liệu tại đây (275.29 KB, 12 trang )
ARTICLE IN PRESS
Tourism Management 26 (2005) 45–56
An examination of the effects of motivation and satisfaction on
destination loyalty: a structural model
Yooshik Yoona,*, Muzaffer Uysalb
b
a
Department of Tourism Management, Pai Chi University, 439-6 Doma-2Dong, Seo-Gu, Daejeon 302-735, South Korea
Department of Hospitality & Tourism Management, Virginia Polytechnic Institute and State University, 362 Wallace Hall,
Blacksburg, VA 24061-0429, USA
Received 14 November 2001; accepted 29 August 2003
Abstract
This study offers an integrated approach to understanding tourist motivation and attempts to extend the theoretical and empirical
evidence on the causal relationships among the push and pull motivations, satisfaction, and destination loyalty. The research model
investigates the relevant relationships among the constructs by using a structural equation modeling approach. Consequently,
destination managers should establish a higher tourist satisfaction level to create positive post-purchase tourist behavior, in order to
improve and sustain destination competitiveness.
r 2003 Elsevier Ltd. All rights reserved.
Keywords: Tourist motivation; Satisfaction; Destination loyalty; Structural equation modeling
1. Introduction
In an increasingly saturated marketplace, the success
of marketing destinations should be guided by a
thorough analysis of tourist motivation and its interplay
with tourist satisfaction and loyalty. A review of tourism
literature reveals an abundance of studies on motivation
and satisfaction, but destination loyalty has not been
thoroughly investigated. Primarily, the tourism studies
to date have addressed and examined the constructs of
motivation and satisfaction independently. The causal
relationships with travel motivation, satisfaction, and
destination loyalty have been only conceptually or
superficially discussed. Additionally, conceptual clarification, distinctions, and logical linkages among the
constructs have been lacking.
A review of the literature on motivation reveals that
people travel because they are ‘‘pushed’’ into making
travel decisions by internal, psychological forces, and
‘‘pulled’’ by the external forces of the destination
attributes (Crompton, 1979; Dann, 1977; Uysal &
Jurowski, 1994). Accordingly, satisfaction with travel
*Corresponding author. Tel.: +82-42-520-5876.
E-mail addresses: (Y. Yoon),
(M. Uysal).
0261-5177/$ - see front matter r 2003 Elsevier Ltd. All rights reserved.
doi:10.1016/j.tourman.2003.08.016
experiences, based on these push and pull forces,
contributes to destination loyalty. The degree of
tourists’ loyalty to a destination is reflected in their
intentions to revisit the destination and in their
recommendations to others (Oppermann, 2000). Thus,
information about tourists’ loyalty is important to
destination marketers and managers.
This study offers an integrated approach to understanding tourist motivation and attempts to extend the
theoretical and empirical evidence on the causal
relationships among the push and pull motivations,
satisfaction, and destination loyalty. A research model is
proposed and tested in the study. The model investigates
the relevant relationships among the constructs by using
a structural equation modeling approach. In order to
provide a theoretical background for the proposed
model, the authors, first review tourist motivation
literature and discuss the concepts of push and pull
motivations, and then provide a discussion of tourist
satisfaction and destination loyalty. It is hoped that the
results derived from the model will serve as the basis for
the development of destination marketing strategies.
One expected advantage of an improved understanding of these causal relationships is that a solid
psychological process or mechanism in the development
of loyalty could be demonstrated. Obviously, tourists
ARTICLE IN PRESS
Y. Yoon, M. Uysal / Tourism Management 26 (2005) 45–56
46
have their own internal and external reasons for
traveling (McGehee, Loker-Murphy, & Uysal, 1996).
However, only one motivation force or both could have
positive or negative relationships with travel satisfaction. It would be of interest to discuss if external sources
of motivation have more effect on the level of
satisfaction than do internal sources. Travel satisfaction
has been generally used as an assessment tool for the
evaluation of travel experiences (Bramwell, 1998; Ross
& Iso-Ahola, 1991). Tourists’ positive experiences of
service, products, and other resources provided by
tourism destinations could produce repeat visits as well
as positive word-of-mouth effects to potential tourists
such as friends and/or relatives (Bramwell, 1998;
Oppermann, 2000; Postma & Jenkins, 1997). Recommendations by previous visits can be taken as the most
reliable information sources for potential tourists.
Recommendations to other people (word-of-mouth)
are one of the most often sought types of information
for people interested in traveling. This systematic
examination of causal relationships among the constructs could facilitate a clearer understanding of the
nature of behavior and intentions. Even if the constructs
have been widely applied in studies related to tourists,
there are still research challenges in the sense of
discovering and investigating the causal relationships
among the constructs of push and pull motivation,
satisfaction, and destination loyalty.
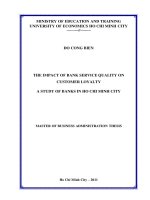
2. The proposed hypothetical model
Fig. 1 depicts the hypothetical causal model. Each
component of the model was selected on the basis of the
literature review. Previous studies reveal that customer
loyalty is influenced by customers’ satisfaction (Bitner,
1990; Dick & Basu, 1994; Oliver, 1999), and satisfaction
is affected by travel motivation (Mannell & Iso-Ahola,
1987; Ross & Iso-Ahola, 1991; Fielding, Pearce, &
Hughes, 1992). The hypothesized causal relationships
between satisfaction and destination loyalty is referred
to as tourism destination loyalty theory. In this study, as
most of the tourist motivation studies have dealt with
push (internal forces) and pull motivation (external
forces), the hypothetical model breaks down motivation
Push
Motivation
Travel
Satisfaction
Pull
Motivation
Fig. 1. Proposed hypothetical model.
Destination
Loyalty
into two constructs: push travel motivation, and pull
travel motivation. Subsequently, the model examines the
structural, causal relationships among the push and pull
tourist motivations, satisfaction, and destination loyalty. Hypothetically, motivation influences tourist satisfaction with travel experiences, which then affects
destination loyalty. The theoretical underpinning of this
model is discussed in the following section.
3. Theoretical overview of constructs
3.1. Motivation
Motivation has been referred to as psychological/
biological needs and wants, including integral forces
that arouse, direct, and integrate a person’s behavior
and activity (Dann, 1981; Pearce, 1982; Uysal & Hagan,
1993). Since a paradigm of tourism is always related to
human beings and to human nature, it is a complex
proposition to investigate why people travel and what
they want to enjoy. Many disciplines have been utilized
to explain phenomena and characteristics related to
motivation. In psychology and sociology, the definition
of motivation is directed toward emotional and cognitive motives (Ajzen & Fishbein, 1977) or internal and
external motives (Gnoth, 1997). An internal motive is
associated with drives, feelings, and instincts. An
external motive involves mental representations such
as knowledge or beliefs. From an anthropological point
of view, tourists are motivated to escape the routine of
everyday life, seeking authentic experiences (MacCannell, 1977). From socio-psychological points of view,
motivation is classified into seeking and avoidance
dimensions (Iso-Ahola, 1982).
In tourism research, this motivation concept can be
classified into two forces, which indicate that people
travel because they are pushed and pulled to do so by
‘‘some forces’’ or factors (Dann, 1977, 1981). According
to Uysal and Hagan (1993), these forces describe how
individuals are pushed by motivation variables into
making travel decisions and how they are pulled or
attracted by destination attributes. In other words, the
push motivations are related to the tourists’ desire, while
pull motivations are associated with the attributes of the
destination choices (Cha, McCleary, & Uysal, 1995;
Crompton, 1979; Dann, 1981; Oh, Uysal, & Weaver,
1995). Push motivations are more related to internal or
emotional aspects. Pull motivations, on the other hand,
are connected to external, situational, or cognitive
aspects.
Push motivations can be seen as the desire for escape,
rest and relaxation, prestige, health and fitness, adventure and social interaction, family togetherness, and
excitement (Crompton, 1979). Tourists may travel to
escape routine and search for authentic experiences. Pull
ARTICLE IN PRESS
Y. Yoon, M. Uysal / Tourism Management 26 (2005) 45–56
motivations are those that are inspired by a destination’s
attractiveness, such as beaches, recreation facilities,
cultural attractions, entertainment, natural scenery,
shopping, and parks. These destination attributes may
stimulate and reinforce inherent push motivations
(McGehee et al., 1996). Several studies have been
conducted using these perspectives (Iso-Ahloa, 1982;
Pyo, Mihalik, & Uysal, 1989; Yuan & McDonald,
1990).
Iso-Ahola (1982) argued that individuals perceive a
leisure activity as a potential satisfaction-producer for
two major reasons. The activity may provide certain
intrinsic rewards, such as a feeling of mastery and
competence, and it may provide an escape from the
routine environment. Similarly, Kippendorf (1987)
found that tourists are motivated by ‘‘going away from
rather than going toward something’’ and that tourist
motivation is self oriented.
In the above major studies, it is generally accepted
that push and pull motivations have been primarily
utilized in studies of tourist behavior. The discoveries
and issues undoubtedly play a useful role in attempting
to understand a wide variety of different needs and
wants that can motivate and influence tourist behavior.
Nevertheless, the results and effects of the motivation
studies of tourist behavior require more than an
understanding of their needs and wants.
In tourism destination management, maximizing
travel satisfaction is crucial for a successful business.
The evaluation of the physical products of destination
(instrumental performance) as well as the psychological
interpretation of a destination product (expressive
attributes) are necessary for human actions (Swan &
Combs, 1976; Uysal & Noe, 2003), which could be
represented as travel satisfaction and destination loyalty. Since the expressive is more related to emotion,
whereas instrumental performance is more cognitively
oriented, expressive experiences truly motivate and
contribute to satisfaction. Instrumental performance
includes maintenance attributes which, if absent, could
create dissatisfaction. Both concepts can be examined
within the context of a tourism system representing two
major components of the market place, namely, demand
(tourist) and supply (tourism attractions). It has been
suggested that the instrumental and expressive attributes
work in combination to produce overall satisfaction
(Jurowski, Cumbow, Uysal, & Noe, 1996; Uysal & Noe,
2003).
4. Satisfaction construct
Undoubtedly, satisfaction has been playing an important role in planning marketable tourism products
and services. Tourist satisfaction is important to
successful destination marketing because it influences
47
the choice of destination, the consumption of products
and services, and the decision to return (Kozak &
Rimmington, 2000). Some researchers have also looked
at comparison of standards used in service quality and
satisfaction and provided different measures of service
quality and satisfaction (Ekinci, Riley, & Chen, 2001;
Liljander, 1994). An understanding of satisfaction must
be a basic parameter used to evaluate the performance
of destination products and services (Noe & Uysal,
1997; Schofield, 2000). Among the tourism literature, an
assessment of tourist satisfaction has been attempted
using various perspectives and theories. Most of the
studies conducted to evaluate consumer satisfaction
have utilized models of expectation/disconfirmation
(Chon, 1989; Francken & Van Raaij, 1981; Oliver,
1980), equity (Fisk & Young, 1985; Oliver & Swan,
1989), norm (Cadotte, Woodruff, & Jenkins, 1987), and
perceived overall performance (Tse & Wilton, 1988).
The following section presents the models that are
commonly used for assessing consumer satisfaction.
First of all, according to the expectation-disconfirmation model contributed by Oliver (1980), consumers
develop expectations about a product before purchasing. Subsequently, they compare actual performance
with those expectations. If the actual performance is
better than their expectations, this leads to positive
disconfirmation, which means that the consumer is
highly satisfied and will be more willing to purchase the
product again. If the actual performance is worse than
expectations, this leads to negative disconfirmation,
which means that the consumer is unsatisfied and will
likely look for alternative products for the next
purchase. Chon (1989) found that tourist satisfaction
is based on the goodness of fit between his/her
expectation about the destination and the perceived
evaluative outcome of the experience at the destination
area, which is simply the result of a comparison between
his/her previous images of the destination and what he/
she actually sees, feels, and achieves at the destination.
Oliver and Swan (1989) were interested in equity
theory. Consumer satisfaction can be seen as a relationship between the costs of what the consumer spends and
the rewards (benefits) he/she anticipates. Here, price,
benefits, time, and effort are major factors in determining satisfaction (Heskett, Sasser, & Schlesinger, 1997).
Thus, it can be said that if tourists receive benefits or
value based on their time, effort, and money for travel,
the destination is worthwhile.
Latour and Peat (1979) suggested the norm theory.
Norms serve as reference points for judging the product,
and dissatisfaction comes into play as a result of
disconfirmation relative to these norms. Several authors
replaced ‘norm’ with ‘ideal standard’ in the literature
(Sirgy, 1984). Francken and van Raaij (1981) hypothesized that leisure satisfaction is determined by the
consumers’ perceived disparity between the preferred
ARTICLE IN PRESS
48
Y. Yoon, M. Uysal / Tourism Management 26 (2005) 45–56
and actual leisure experiences, as well as the perceptions
of barriers (both internal and external) that prevented
the consumer from achieving the desired experience.
This theory uses some form of ‘‘comparison standard’’.
Consumers compare a product they have purchased
with other products. Tourists can compare current
travel destinations with other alternative destinations
or places visited in the past. The difference between
present and past experiences can be a norm used to
evaluate tourist satisfaction. Therefore, comparing
current travel destinations with other, similar places
that they may have visited can assess the satisfaction of
tourists.
Tse and Wilton (1988) developed a perceived performance model. According to this model, consumer
dissatisfaction is only a function of the actual performance, regardless of consumers’ expectations. In other
words, the actual performance and initial expectations
should be considered independently, rather than comparing performance with past experiences. Therefore, in
this model, tourists’ evaluation of their satisfaction with
travel experiences is considered, regardless of their
expectations. This model is effective when tourists do
not know what they want to enjoy and experience and
do not have any knowledge about their destination
circumstances, and only their actual experiences are
evaluated to assess tourist satisfaction.
In summary, as seen in the above discussion, the
evaluation of tourist satisfaction needs to be considered
in multiple dimensions. Tourists may have varying
motivations for visiting particular destinations, and also
may have different satisfaction levels and standards.
Therefore, a model that integrates the approaches used
by previous models may be most effective in assessing
tourist satisfaction.
5. Destination loyalty
Repeat purchases or recommendations to other
people are most usually referred to as consumer loyalty
in the marketing literature. The concept and degree of
loyalty is one of the critical indicators used to measure
the success of marketing strategy (Flavian, Martinez, &
Polo, 2001). Similarly, travel destinations can be
considered as products, and tourists may revisit or
recommend travel destinations to other potential
tourists such as friends or relatives. However, the study
of the usefulness of the concept of loyalty and its
applications to tourism products or services has been
limited, even though loyalty has been thought of as one
of the major driving forces in the competitive market
(Dimanche & Havitz, 1994).
In the last decade, tourism or leisure researchers have
incorporated the concept of consumer loyalty into
tourism products, destinations, or leisure/recreation
activities (Backman & Crompton, 1991; Baloglu, 2001;
Iwasaki & Havitz, 1998; Lee, Backman, & Backman,
1997; Mazanec, 2000; Pritchard & Howard, 1997; Selin,
Howard, & Cable, 1988). Generally, loyalty has been
measured in one of the following ways: (1) the
behavioral approach, (2) the attitudinal approach, and
(3) the composite approach (Jacoby & Chestnut, 1978).
The behavioral approach is related to consumers’
brand loyalty and has been operationally characterized
as sequence purchase, proportion of patronage, or
probability of purchase. It has been debated that the
measurement of this approach lacks a conceptual
standpoint, and produces only the static outcome of a
dynamic process (Dick & Basu, 1994). This loyalty
measurement does not attempt to explain the factors
that affect customer loyalty. Namely, tourist loyalty to
the products or destinations may not be enough to
explain why and how they are willing to revisit or
recommend these to other potential tourists.
In the attitudinal approach, based on consumer brand
preferences or intention to buy, consumer loyalty is an
attempt on the part of consumers to go beyond overt
behavior and express their loyalty in terms of psychological commitment or statement of preference. Tourists
may have a favorable attitude toward a particular
product or destination, and express their intention to
purchase the product or visit the destination. Thus,
loyalty measures consumers’ strength of affection
toward a brand or product, as well as explains an
additional portion of unexplained variance that
behavioral approaches do not address (Backman &
Crompton, 1991).
Lastly, the composite or combination approach is an
integration of the behavioral and attitudinal approaches
(Backman & Crompton, 1991). It has been argued that
customers who purchase and have loyalty to particular
brands must have a positive attitude toward those
brands. However, this approach has limitations in that
not all the weighting or quantified scores may apply to
both the behavioral and attitudinal factors, and they
may have differing measurements. Even some researchers have discounted only the behavioral or attitudinal
approach, and have suggested integrating the two
(Backman & Crompton, 1991; Iwaskaki & Havitz,
1998). Thus, the reviewed literature suggests that a full
understanding of loyalty need to consider both motivation and satisfaction constructs simultaneously.
6. Study site and sample
The data for this study were collected by a
self-administered questionnaire method in Northern
Cyprus, located on the Mediterranean Sea. Northern
Cyprus offers archeological and historical sites with
natural beauty and warm sandy beaches. The pre-tested
ARTICLE IN PRESS
Y. Yoon, M. Uysal / Tourism Management 26 (2005) 45–56
questionnaire was initially developed in two languages:
English and Turkish. A total of five hundred questionnaires were distributed to the tourists staying in the
most well known hotels in Northern Cyprus.
7. Questionnaire design and research variables
In order to measure tourist motivation, this study
utilizes pull and push motivation variables. The push
motivation construct that is related to internal motivations consists of 24 items, while the pull motivation
construct that is associated with external forces includes
28 items. Both of the motivation variables were
developed on the basis of a review of the related
literature and were modified to apply to the research site
and target population. A four point Likert-type scale
was used as the response format for the motivation
variables, with assigned values ranging from 1 being
‘‘Not at all important,’’ to 4 being ‘‘Very important.’’
Four different questions were developed to apply
consumer satisfaction theories into actual satisfaction
with travel experiences in Northern Cyprus. These are:
(1) how does Northern Cyprus, in general, rate
compared to what you expected? (1=much worse than
I expected, and 5=much better than I expected); (2)
Was this visit worth your time and effort? (1=definitely
not worth it, and 5 definitely well worth it); (3) Overall,
how satisfied were you with your holiday in Northern
Cyprus? (1=not at all satisfied, and 4=very satisfied);
and (4) how would you rate Northern Cyprus as a
vacation destination compared to other similar places
(islands/countries) that you may have visited? (1=much
worse, and 5=much better).
Three indicators measured tourist destination loyalty
as the ultimate dependent construct. These are two
indicators related to revisitation and one indicator
pertaining to recommendation to friends and relatives.
The revisitation questions were as follows: (1) In the
next two years, how likely is it that you will take another
vacation to Northern Cyprus? (1=Not likely at all, and
4=Very likely); and (2) Please describe your overall
feelings about your visit? (1=this visit was very poor,
and I will not come again and 3=this visit was so good
that I will come again). The recommendation question
was as follows: (1) will you suggest Northern Cyprus to
your friends/relatives as a vacation destination to visit?
(1=Not likely, and 3=definitely).
8. Data analysis and results
The properties of the four research constructs (two
exogenous—(1) push and (2) pull travel motivation; and
two endogenous—(1) tourist satisfaction and (1) destination loyalty) in the proposed model were tested with a
49
LISREL procedure of structural equation modeling
(SEM) (Joreskog & Sorbom, 1996), and the Maximum
Likelihood (ML) method of estimation and the twostage testing process were adopted. Correlation matrices
and standard deviations were used to test a hypothesized
model in structural equation modeling. Finally, completely standardized solutions were utilized in reporting
the results. SEM is designed to evaluate how well a
proposed conceptual model that contains observed
indicators and hypothetical constructs explains or fits
the collected data (Bollen, 1989a, b; Hoyle, 1995; Yoon,
Gursoy, & Chen, 2001). It also provides the ability to
measure or specify the causal relationships among sets
of unobserved (latent) variables, while describing the
amount of un-explained variance (Davies, Goode,
Mazanec, & Moutinho, 1999; Turner & Reisinger,
2001). Clearly, the hypothesized model in this study
was designed to measure causal relationships among the
unobserved constructs that were set up on the basis of
prior empirical research and theory. The SEM procedure was an appropriate solution for this proposed
hypothetical model.
Out of 500 questionnaires distributed, a total of 148
usable questionnaires were collected, yielding a 29.6%
response rate. Missing values, outliers, and distribution
of all measured variables were examined to purify the
data and reduce systematic errors. Serious missing
values were not found, and those missing observations
were managed by a listwise procedure.
Prior to LISREL analyses, an exploratory factor
analysis (EFA) was performed only for purposes of
reducing the number of variables in both push and pull
travel motivation constructs. The underlying factors
derived from EFA were represented as correlations
among sets of many interrelated variables (Hair,
Anderson, Tatham, & Black, 1998). Using varimax
rotation, the latent root criterion of 1.0 was used for
factor inclusion, and a factor loading of 0.40 was used as
the benchmark to include items in a factor. Then, the
included items within a factor were calculated to create a
composite factor. All of these procedures were performed using SPSS 10. Subsequently, these composite
factors were treated as indicators to measure a
construct. This procedure may help to decrease multicollinearity or error variance correlations among indicators in the confirmatory factor analysis of the
measurement model. Such errors should be avoided as
much as possible in structural equation modeling
procedures (Bollen, 1989a).
The results of EFA analyses determined significantly
correlated factors, including eight push travel motivations, and ten pull travel motivations (Tables 1 and 2).
These factor analyses were acceptable because at least
two significant loadings for any one factor were loaded,
as well as all of the variables that were included in
the factors. Thus, there was no chance of losing
ARTICLE IN PRESS
50
Y. Yoon, M. Uysal / Tourism Management 26 (2005) 45–56
Table 1
The results of EFA (push motivations)
Push factors
Factor 1: Exciting
Being physically active
Meeting people of opposite sex
Finding thrills and excitement
Rediscovering myself
Factor 2: Knowledge/education
Experiencing new/different lifestyles
Trying new food
Visiting historical places
Meeting new people
Being free to act how I feel
Factor 3: Relaxation
Doing nothing at all
Getting a change from a busy job
Factor 4: Achievement
Going places friends have not been
Talking about the trip
Rediscovering past good times
Factor 5: Family togetherness
Visiting places my family came from
Visiting friends and relatives
Being together as a family
Factor 6: Escape
Getting away from the demands at home
Experiencing a simpler lifestyle
Factor 7: Safety/fun
Feeling safe and secure
Being entertained and having fun
Adventure of reduced air fares
Factor 8: Away from home and seeing
Feeling at home away from home
Seeing as much as possible
Factor loading
Explained variance
Composite mean
18.30
2.62
11.42
3.07
10.53
2.27
7.63
3.00
7.23
2.43
5.91
3.13
5.00
3.41
4.43
2.90
0.79
0.78
0.72
0.46
0.79
0.79
0.66
0.60
0.48
0.80
0.72
0.81
0.81
0.53
0.74
0.70
0.48
0.78
0.58
0.83
0.73
0.42
0.83
0.69
Total variance explained
70.40
1=Not at all important, 4=Very important. Kaiser-Meyer-Olkin measure of sampling adequacy=0.52. Bartlett’s test of sphericity po0.000.
any information in measuring travel motivation constructs.
From reviewing the mean scores of the composite
indicators, it was found that ‘safety & fun (M=3.41),’
‘escape (M=3.13)’, ‘knowledge & education (M=3.07)’,
and ‘achievement (M=3.00)’ were perceived respectively as important factors in push travel motivation.
‘Cleanness & shopping (M=3.49)’, ‘reliable weather &
safety (M=3.35)’, ‘different culture (M=3.28)’, and
‘water activities (M=3.07)’ were considered as important factors in pull travel motivation. Consequently,
these push and pull travel motivations were employed in
LISREL procedures.
9. Measurement model
First, a confirmatory factor analysis (CFA) of the
measurement model specifying the posited relationships
of the observed indicators to the latent constructs, with
all constructs allowed to be inter-correlated freely, was
tested. According to Anderson and Gerbing (1988),
confirmatory measurement models should be evaluated
and re-specified before measurement and structural
equation models are examined simultaneously. Thus,
before testing the measurement model overall, each
construct in the model was analyzed separately.
Since an item having a coefficient alpha below 0.30 is
unacceptable, it is recommended that it be deleted from
further analysis (Joreskog, 1993). Consequently, one
indicator in terms of the push travel motivation
construct was removed. Then, the chi-square was not
significant (Chi-square=19.12, po0.12), but other fit
indices indicated an acceptable fit with the data
(GFI=0.96, CFI=0.91, NFI=0.81). In the pull travel
motivation construct, four indicators were removed and
the result of Chi-square was 9.15 (po0.42). Other fit
indices exhibited an acceptable level (GFI=0.98,
CFI=1.00, NFI=0.94).
A total of 12 indicators for exogenous variables and 7
indictors of endogenous variables (4 from satisfaction
and 3 from destination loyalty) were used in the
ARTICLE IN PRESS
Y. Yoon, M. Uysal / Tourism Management 26 (2005) 45–56
51
Table 2
The results of EFA (pull motivations)
Pull factors
Factor 1:Modern atmospheres & activities
Modern cities
Exotic atmosphere
Casino and gambling
Live theaters/concerts
First class hotels
Factor 2: Wide space & activities
Budget accommodation
Wide spaces to get away from crowds
Variety of activities to see
Factor 3: Small size & reliable weather
Manageable size
Reliable weather
Personal safety
Factor 4: Natural scenery
Outstanding scenery
Mountainous areas
Factor 5:
Inexpensive restaurants
Tennis
Factor 6: Different culture
Quality beach
Interesting and friendly local people
Different culture
Historic old cities
Factor 7: Cleanness & shopping
Cleanness
Shopping
Reliance/privacy
Factor 8: Night life & local cuisine
Night life and entertainment
Local cuisine
Factor 9: Interesting town & village
Interesting town/village
High quality restaurants
Factor 10: Water activities
Seaside
Water sports
Factor loading
Explained variance
Composite mean
9.74
2.52
7.66
3.05
7.47
3.35
7.00
2.94
6.96
2.55
6.78
3.28
6.58
3.49
6.52
3.00
6.00
2.84
5.46
3.07
0.86
0.65
0.58
0.53
0.52
0.76
0.68
0.57
0.73
0.70
0.63
0.83
0.71
–0.83
0.68
0.82
0.52
0.41
0.41
0.74
0.72
0.48
0.79
0.40
0.80
0.69
0.82
0.51
Total variance explained
70.10
1=Not at all important, 4=Very important. Kaiser-Meyer-Olkin Measure of Sampling Adequacy=0.52. Bartlett’s Test of Sphericity po0.000.
measurement model. In testing the measurement model,
it was modified so that it came to represent the
theoretical causal model of interest in this study.
Indicators having less than 0.30 of coefficient alpha
were deleted, and this theoretical model was evaluated
and revised until a theoretically meaningful as well as
statistically acceptable model was achieved. In particular, one of the indicators of destination loyalty on
exogenous variables was highly correlated with one
indicator in the pull motivation construct. Thus, after
examining the model fits of the overall measurement
model that excludes the correlated indicator, one
indicator was deleted because the model without this
indicator produced better-fit indices. The fit of the
indicators to the construct and construct reliability and
validity were tested. Here, basically, reliability refers to
the consistency of measurement, while validity refers to
the extent to which an instrument measures what it is
intended to measure (Hatcher, 1994).
As shown in Table 3, six indicators of exogenous
variables for travel motivation, three indicators for
tourist satisfaction, and two indicators for destination
loyalty are identified. The results of the measurement
model with four constructs and 11 indicators were
derived from confirmatory factor analysis (CFA). This
measurement model described the nature of the relationship between latent constructs and the manifest indicators that measured those latent constructs. Three types
of overall model fit measures were utilized in this study:
absolute fit measures (AFM), incremental fit measures
(IFM), and parsimonious fit measures (PFM). An
absolute fit index was used to directly evaluate how
ARTICLE IN PRESS
Y. Yoon, M. Uysal / Tourism Management 26 (2005) 45–56
52
Table 3
Overall CFA for the modified measurement model (N=148)
Construct & indicators
Completely
standardized loading (t-value)
Construct & indicator
reliability
Variance extracted
& error variance
Push travel motivation (EX)
Relaxation (F3)
Family togetherness (F5)
Safety & fun (F7)
0.43 (4.67)
0.59 (6.37)
0.58 (6.36)
0.69
0.19
0.34
0.34
0.44
0.38
0.50
0.25
Pull travel motivation (EX)
Small size & reliable weather (F3)
Cleanness & shopping (F7)
Night life & local cuisine (F8)
0.87 (10.48)
0.38 (4.40)
0.73 (8.81)
0.88
0.76
0.14
0.54
0.73
0.07
0.19
0.28
Tourists’ satisfaction (ED)
Expectation-satisfaction
Worth visiting
Comparison with other places
0.73 (9.05)
0.71 (8.77)
0.65 (7.97)
0.70
0.53
0.50
0.43
0.44
0.48
0.68
0.69
Destination loyalty (ED)
Recommendations to friends/relatives
Overall feeling to revisit
0.79 (9.71)
0.70 (8.63)
0.87
0.62
0.50
0.78
0.16
0.16
EX=Exogenous variable, ED=endogenous variable.
Table 4
Goodness-of-fit indices for the modified measurement model (N=148)
Absolute fit measures
2
Incremental fit measures
w
GFI
RMSR
RMSEA
NULL w
(36) 43.87
p=0.17
0.95
0.03
0.03
490.43
55df.
2
Parsimonious fit measures
AGFI
NNFI
PNFI
CFI
IFI
RFI
0.91
0.96
0.59
0.97
0.97
0.85
w2=Chi-square; GFI=goodness-of-fit index; RMSR=root mean square residual; RMSEA=root mean square error of approximation;
AGFI=adjusted goodness-of-fit; NNFI=nonnormed fit index; PNFI=parsimonious normed fit index; CFI=comparative fit index; IFI=incremental fit index; RFI=relative fit index.
well the priori theoretical model fits the sample data,
and an incremental fit index assessed the proportionate
fit by comparing a target model with a more restricted,
nested baseline model (Hu & Bentler, 1995). A
parsimonious fit measure was used to diagnose whether
model fit has been achieved by over fitting the data with
too many coefficients. In this study, all three types of
goodness of fit indices indicated that the overall
measurement model was acceptable in that the proposed
model fit the collected data with a sample size of 148. :
w2 (36)=43.87, p=0.17, goodness-of-fit index (GFI)=
0.95, root mean square residual (RMSR)=0.03, root
mean square error of approximation (RMSEA)=0.03,
adjusted goodness-of-fit (AGFI)=0.91, nonnormed fit
index (NNFI)=0.96, parsimonious normed fit index
(PNFI)=0.59, comparative fit index (CFI)=0.97, incremental fit index (IFI)=0.979, and relative fit index
(RFI)=0.85 (Table 4).
After assessing the overall model, the psychometric
properties of each latent construct were evaluated
separately through examining the completely standardized loading, error variance, the construct reliability,
and the variance extracted. As seen in Table 3, the tvalue associated with each of the standardized loadings
exceeded the critical level (2.58, po0.05). The construct
reliability of all five constructs was close, and exceeded
the recommended level of 0.70 (0.69, 0.88, 0.70, and
0.87). Thus, it can be said that the psychometric
properties of each respective latent construct, especially
for the purpose of this research, are acceptable.
10. Structural equation model
Having assessed the measurement model, an initial
theoretical model was examined with two gamma paths
and one beta path. Since the chi-square is heavily
influenced by the sample size (Bollen & Long, 1993),
other goodness-of-fit indices are suggested to help the
model evaluation (Bentler, 1990; Joreskog & Sorbom,
1996). The review of the initial theoretical model
indicated that the chi-square value (60.82 with 38 of
DF) was not significant, but other fit indices indicated a
quite acceptable level (GFI=93, RMSR=0.05,
ARTICLE IN PRESS
Y. Yoon, M. Uysal / Tourism Management 26 (2005) 45–56
53
Table 5
Goodness-of-fit measures for the structural equation model (N=148)
Absolute fit measures
2
Incremental fit measures
w
GFI
RMSR
RMSEA
NULL w
T
(38) 60.82
p=0.00
0.93
0.05
0.06
R
(37) 43.85
p=0.20
0.95
0.03
0.03
2
Parsimonious fit measures
AGFI
NNFI
PNFI
CFI
IFI
RFI
(55)
493.43
0.88
0.90
0.60
0.93
0.94
0.80
(55)
493.43
0.91
0.96
0.61
0.97
0.97
0.85
T=theoretical model; R=revised model, w2=Chi-square; GFI=goodness-of-fit index; RMSR=root mean square residual; RMSEA=root mean
square error of approximation; AGFI=adjusted goodness-of-fit; NNFI=nonnormed fit index; PNFI=parsimonious normed fit index;
CFI=comparative fit index; IFI=incremental fit index; RFI=relative fit index.
Table 6
Sequential Chi-square testing of model comparison
Comparison model
d.f. Difference
w2 Difference
p
Measurement model vs.
theoretical model
Theoretical model vs.
revised model
Revised model vs.
measurement model
2
16.95
o0.05
1
16.97
o0.05
1
0.02
>0.05
between the revised model and the measurement model
revealed a non-significant result (w2 (1)=0.02, p>0.05),
suggesting that the revised model is not different from
the measurement model. As a result, the revised model
was accepted as a parsimonious model (Hull, Lehn, &
Tedlie, 1991), as well as the best model to use in testing
the proposed hypothetical model in this study.
11. Findings of the construct relationships
AGFI=0.88, NNFI=0.90, PNFI=0.60, CFI=0.93,
and IFI=0.94). Thus, the theoretical model might be
under-identified so that it could be improved. By
examining the modification indices, a direct gamma
path from push travel motivation to destination loyalty
was identified, although this relationship was not
expected in this study. According to this suggested
modification, a new path was added to see whether or
not the revised model fits the observed data.
As presented in Table 5, the revised model that
estimated with three gamma paths and one beta path
from four latent constructs, showed a non-significance
result of the chi-square test (w2 (37)=43.85, p=0.20).
The results of goodness of fit indices exhibited a similar
pattern to those for the initial theoretical model, as well
as indicated better fits for all measures (GFI=95,
RMSR=0.03, AGFI=0.91, NNFI=0.96, PNFI=0.61,
CFI=0.97, and IFI=0.97). Consequently, the review of
the squared multiple correlations of the revised structural model explained 12% of the variance in tourist
satisfaction, as well as showing a variance of 24% in
destination loyalty.
Having assessed the revised model, sequential chisquare difference tests (SCDTs) were performed as
post hoc tests to provide successive fit information
(Anderson & Gerbing, 1988). The results of three chisquare difference tests are shown in Table 6. Two
chi-square tests performed to show a difference between
the measurement and theoretical models, as well as
the theoretical and the revised model, are significant at
the 0.05 level. The chi-square test of a difference
The hypothesized structural causal model was tested
by structural equation modeling (SEM), which included
a test of the overall model as well as individual tests of
the relationships among the latent constructs. As
presented in Fig. 2, the results offered support for the
relationship between satisfaction and destination loyalty
at a significant level of 0.05. Consequently, tourist
destination loyalty is positively affected by tourist
satisfaction with their experiences, as indicated by the
completely standardized coefficient of 0.79 and a t-value
of 6.48. Interestingly, satisfaction was found to be
negatively influenced by the pull travel motivation
(completely standardized coefficient=–0.54 and t-value=–2.17), which was conversely proposed in order to
test. However, another relationship, that tourist satisfaction is affected by the push travel motivation, was not
supported by the data, indicated by the completely
standardized coefficient score of 0.41 and a t-value of
1.54. Finally, the new proposed path relationship from
the push travel motivation to destination loyalty shows
a significant result, indicated by the completely standardized coefficient of 0.41 as well as a t-value of 0.425.
Thus, travel push motivation has a positively direct
relationship with destination loyalty.
12. Discussion and implications
The empirical results of this study provide tenable
evidence that the proposed structural equation model
designed to consider push and pull motivations,
ARTICLE IN PRESS
Y. Yoon, M. Uysal / Tourism Management 26 (2005) 45–56
54
.81
Push F3
.65
Push F5
.66
Push F7
.58
.43
.59
Push
Motivation
.41*
.79*
Travel
Satisfaction
Pull F3
.25
.46
.38
Revisiting
.50
Destination
Loyalty
-.54*
.87
Pull F7
.38
Pull F8
.73
.86
Recom.
.79
.41
.58
.72
Pull
Motivation
.66
.71
Expect/Sati
.50
Worth
.73
Comparing
.57
.48
Fig. 2. Results of testing hypothetical model. Note: Push F3=relaxation, Push F5=family togetherness, Push F7=safety & fun. Pull F3=small size
and reliable weather, Pull F7=cleanness & shopping, Pull F8=night life & local cuisine, Chi-square (37)=43.85, p>0.20, GFI=0.95, AGFI=0.91,
CFI=0.97, RMSEA=0.03, and RMSR=0.03, Ã=t-value >x1.96x, po0.05.
satisfaction, and destination loyalty simultaneously is
acceptable. Even though in the literature, the individual
constructs and concepts have received considerable
attention from tourism scholars and practitioners, the
conceptual model and empirical studies pertaining to
causal relationships among those constructs have not
been examined. It is believed that this study has a
substantial capability for generating more precise
applications related to destination behavior, especially
concerning motivation, satisfaction, and destination
loyalty.
The major findings of this study have significant
managerial implications for Northern Cyprus. First of
all, the exploratory factor analyses showed that tourists
pursue eight different push motivations and have ten
different pull motivations. Thus, it is suggested that
destination marketers consider the practical implications
of these motivation variables, because they can be
fundamental factors in increasing satisfaction with
destination services and products as well as enhancing
destination loyalty.
Second, the confirmatory factor analyses revealed
that even if each construct retains its original characteristics, the push and pull constructs are largely reduced in
the number of reliable and appropriate items that can be
used to measure these constructs. Additionally, it is hard
to determine solid measurement indicators for its
constructs. Even though these findings result from a
single, empirical investigation, tourism scholars and
practitioners should be aware that there is a need to
have further studies to develop more effective measurement scales to assess such constructs. This suggests that
since tourists may be differently motivated and react
differently, consistent measurement scales and constructs should be explored and refined. This study
indicates that destination managers should give attention to tourists’ relaxation, family togetherness, and
safety & fun in order to appeal to tourists’ internal
motives to travel.
The unique measurements and discriminant validity
of satisfaction and destination loyalty have been
confirmed. Thus, it can be said that the two concepts
are distinct and independent from each other. It also can
be suggested that an integrated and/or simultaneous
approach for measuring tourist satisfaction is desirable
with the items of ‘‘expectation-disconfirmation’’,
‘‘worthwhile to visit’’, and ‘‘norm comparison’’. Finally,
this study supports the idea that the general theory of
consumer loyalty can apply to tourist loyalty to tourism
destinations. Thus, destination managers can estimate
tourists’ post purchase-behavior and consider this
information in their decision-making.
The findings of testing of the proposed model have
implications for the success of marketing destinations.
In order to improve satisfaction with travel experiences,
destination managers must consider the pull motivations, which are related to external sources, including
destination attributes. The appropriate destination
attractions and activities should be allocated and
delivered to tourists in order to enhance destination
competitiveness. Also, destination managers should
consider the role of push motivations and their positive
relationship to destination loyalty. This indicates that
tourists’ internal sources of motivation affect their
destination loyalty, which includes revisiting destinations and recommending them to others. Thus, destination managers should focus more on tourists’ emotional
feelings to increase destination loyalty. Finally, it can be
intuitively assumed that if tourists are satisfied with their
travel experiences, they are willing to revisit destinations
and recommend them to other people. This study
provides empirical evidence supporting this statement,
in that there is a highly significant relationship between
the two constructs. In other words, satisfaction is found
to directly affect destination loyalty in a positive
direction. Also, satisfaction is determined to be a
mediating construct between travel motivation and
destination loyalty. Consequently, destination managers
ARTICLE IN PRESS
Y. Yoon, M. Uysal / Tourism Management 26 (2005) 45–56
should establish a higher tourist satisfaction level to
create positive post-purchase tourist behavior, in order
to improve and sustain destination competitiveness.
13. Concluding comments
It can be concluded that tourism destination loyalty
has causal relationships with motivation and satisfaction. Additionally, the push motivation separately from
the pull motivation determines the destination loyalty.
In the literature, although it has been acknowledged that
tourist destination loyalty is important, little has been
done to investigate its measurement, or its structural
relationships with motivation and satisfaction. This
study revealed and confirmed the existence of the critical
relationship between push/pull motivations and destination loyalty. This finding suggests that it would be
worthwhile for destination managers to make greater
investments in their tourism destination resources, in
order to continue to enhance experiences.
Finally, there are several issues associated with this
study’s limitations that should be discussed to provide a
guide for future research. The study’s model was tested
in a specific setting—Northern Cyprus, in the Mediterranean region. The generalization of the model is
suggested, with the replication of this study in other
settings that have different destination attributes. This
can provide opportunities to evaluate the extent and
direction of motivation as visitors relate degrees of
satisfaction to destination loyalty. An application of the
model to other settings will help produce reliable
indicators and further validate the constructs, thus,
producing a more robust and stable model.
Acknowledgements
The authors thank Nurdan Yavuz for creating the
database used in this study.
References
Ajzen, I., & Fishbein, M. (1977). Attitude-Behavior relations: A
theoretical analysis and review of empirical research. Psychological
Bulletin, 84, 888–918.
Anderson, J., & Gerbing, D. W. (1988). Structural equation modeling
in practice: A review and recommended two-step approach.
Psychological Bulletin, 13, 411–423.
Backman, S. J., & Crompton, J. L. (1991). The usefulness of selected
variables for predicting activity loyalty. Leisure Science, 13,
205–220.
Baloglu, S. (2001). An investigation of a loyalty typology and the
multidestination loyalty of international travelers. Tourism Analysis, 6(1), 41–52.
Bentler, P. M. (1990). Comparative fit indexes in structural models.
Psychological Bulletin, 107, 238–246.
Bitner, M. J. (1990). Evaluating service encounter: The effects of
physical surroundings and employee responses. Journal of Marketing, 54, 69–82.
55
Bollen, K. A. (1989a). Structural equation with latent variables. New
York: Wiley.
Bollen, K. A. (1989b). A new incremental fit index for general
structural models. Sociological Methods and Research, 17, 303–316.
Bollen, K. A., & Long, J. S. (1993). Testing structural equation models.
Newbury Park: Sage Publications, International Education and
Professional Publisher.
Bramwell, B. (1998). User satisfaction and product development in
urban tourism. Tourism Management, 19(1), 35–47.
Cadotte, E. R., Woodruff, R. B., & Jenkins, R. L. (1987). Expectations
and norms in models of consumer satisfaction. Journal of Marketing
Research, 24, 305–314.
Cha, S., McCleary, K., & Uysal, M. (1995). Travel motivation of
Japanese overseas travelers: A factor-cluster segmentation approach. Journal of Travel Research, 34(1), 33–39.
Chon, K. (1989). Understanding recreational travelers’ motivation,
attitude and satisfaction. The Tourist Review, 44(1), 3–7.
Crompton, J. L. (1979). Motivations of pleasure vacation. Annals of
Tourism Research, 6, 408–424.
Dann, G. M. (1977). Anomie ego-enhancement and tourism. Annals of
Tourism Research, 4(4), 184–194.
Dann, G. M. (1981). Tourism Motivations: An appraisal. Annals of
Tourism Research, 8(2), 189–219.
Davies, F., Goode, M., Mazanec, J., & Moutinho, L. (1999). LISREL
and neural network modeling: Two comparison studies. Journal of
Retailing and Consumer Services, 6, 249–261.
Dick, A. S., & Basu, K. (1994). Customer loyalty: Toward an
integrated conceptual framework. Journal of the Academy of
Marketing Science, 22(2), 99–113.
Dimanche, F., & Havitz, M. E. (1994). Consumer behavior and
tourism: Review and extension of four study areas. Journal of
Travel and Tourism Marketing, 3(3), 37–58.
Ekinci, Y., Riley, M., & Chen, J. (2001). A review of comparisons used
in service quality and customer satisfaction studies: Emerging
issues for hospitality and tourism research. Tourism Analysis,
5(2/4), 197–202.
Fisk, R. P., & Young, C. E. (1985). Disconfirmation of equity
expectations: Effects on consumer satisfaction with services. In E.
Hirschman, & H. Holbrook (Eds.), Advances in Consumer
Research. Provo, UT: Association for Consumer Research.
Fielding, K., Pearce, P. L., & Hughes, K. (1992). Climbing ayers rock:
relating visitor motivation, time perception and enjoyment. The
Journal of Tourism Studies, 3(2), 40–52.
Flavian, C., Martinez, E., & Polo, Y. (2001). Loyalty to grocery stores
in the Spanish market of the 1990s. Journal of Retailing and
Consumer Services, 8, 85–93.
Francken, D. A., & van Raaij, W. F. (1981). Satisfaction with leisure
time activities. Journal of Leisure Research, 13(4), 337–352.
Gnoth, J. (1997). Tourism motivation and expectation formation.
Annals of Tourism Research, 21(2), 283–301.
Hair, J. F., Anderson, R. E., Tatham, R. L., & Black, W. C. (1998).
Multivariate data analysis (5th edn).). New Jersey: Prentice Hall.
Hatcher, L. (1994). A step-by-step approach: To using the SAS system
for factor analysis and structural equation modeling. Cary, NC: SAS
Institute.
Heskett, J. L., Sasser, W. E., & Schlesinger, L. A. (1997). The service
profit chain. New York, NY: The Free Press.
Hoyle, R. H. (1995). Structural equation modeling: Concepts, issues,
and application. Thousand Oaks, CA: Sage Publications.
Hu, L., & Bentler, P. M. (1995). Evaluating model fit. In R. Hoyle
(Ed.), Structural equation modeling: Concepts, issues and application
(pp. 76–99). Thousand Oak, CA: Sage Publications.
Hull, J. G., Lehn, D. A., & Tedlie, J. C. (1991). A general approach to
testing multifaceted personality construct. Journal of Personality
and Social Psychology, 61, 932–945.
ARTICLE IN PRESS
56
Y. Yoon, M. Uysal / Tourism Management 26 (2005) 45–56
Iso-Ahola, S. (1982). Toward a social psychology theory of tourism
motivation. Annals of Tourism Research, 12, 256–262.
Iwasaki, Y., & Havitz, M. E. (1998). A path analytic model of the
relationships between involvement, psychological commitment,
and loyalty. Journal of Leisure Research, 30(2), 256–280.
Jacoby, J., & Chesnut, R. W. (1978). Brand loyalty measurement and
management. New York: Wiley.
Joreskog, K. (1993). Testing structural equation models. In K. A.
Bollen, & J. S. Long (Eds.), Testing structural equation models
(pp. 294–316). Newbury Park, CA: Sage Publications.
Joreskog, K., & Sorbom, D. (1996). LISREL 8: User’s reference guide.
Chicago, IL: Scientific software International.
Jurowski, C., Cumbow, M. W., Uysal, M., & Noe, F. P. (1995–6). The
effects of instrumental and expressive factors on overall satisfaction
in a park environment. Journal of Environmental System, 24(1),
47–67.
Kozak, M., & Rimmington, M. (2000). Tourist satisfaction with
Mallorca, Spain, as an off-season holiday destination. Journal of
Travel Research, 38(3), 260–269.
Krippendorf, J. (1987). The Holiday Markers: Understanding the
impact of leisure and travel. Trowbridge, Wildshire, England:
Heinemann Professional Publishing, Redwood Burn Ltd.
LaTour, S. A., Peat, N. C. (1979). Conceptual and methodological
Issues in consumer satisfaction research, Ralph day, Bloomington
Wilkie, W.L. (Eds.), (pp. 31–5). IN: Indiana University Press.
Lee, C. Backman, K., & Backman, K. S. J. (1997). Understanding
antecedents of repeat vacation and tourist’ loyalty to a resort
destination. TTRA 28th Annual Conference Proceedings,
(pp. 11–20).
Liljander, V. (1994). Modeling perceived service quality using different
comparison standard. Journal of Consumer Satisfaction and
Dissatisfaction, 7, 126–142.
MacCannell, D. (1977). The tourist. New York: Schockon.
Mannell, R. C., & Iso-Ahola, S. E. (1987). Psychological nature of
leisure and tourism experience. Annals of Tourism Research, 14,
314–331.
Mazanec, J. A. (2000). Introduction: Reports from the second
symposium on the consumer psychology of tourism, hospitality
and leisure (CPTHL). Tourism Analysis, 5, 64–68.
McGehee, N. G., Loker-Murphy, L., & Uysal, M. (1996). The
Australian international pleasure travel market: Motivations from
a gendered perspective. The Journal of Tourism Studies, 7(1), 45–57.
Noe, F. P., & Uysal, M. (1997). Evaluation of outdoor recreational
settings. A problem of measuring user satisfaction. Journal of
Retailing and Consumer Services, 4(4), 223–230.
Oh, H. C., Uysal, M., & Weaver, P. (1995). Product bundles and
market segments based on travel motivations: A canonical
correlation approach. International Journal of Hospitality Management, 14(2), 123–137.
Oliver, R. L. (1980). A cognitive model of the antecedents and
consequences of satisfaction decisions. Journal of Marketing
Research, 17, 46–49.
Oliver, R. L. (1999). Whence consumer loyalty? Journal of Marketing,
63, 33–44.
Oliver, R. L., & Swan, J. E. (1989). Consumer perceptions of
interpersonal equity and satisfaction in transactions: A field survey
approach. Journal of Marketing, 53, 21–35.
Oppermann, M. (2000). Tourism destination loyalty. Journal of Travel
Research, 39, 78–84.
Pearce, P. L. (1982). The social psychology of tourist behavior. Oxford:
Pergamon Press.
Postma, A., & Jenkins, A. K. (1997). Improving the tourist’s
experience: Quality management applied in tourist destinations.
In P. E. Murphy (Ed.), Quality management in urban tourism
(pp. 183–197). Chichester: Wiley.
Pritchard, M. P., & Howard, D. R. (1997). The loyal traveler:
Examining a typology of service patronage. Journal of Travel
Research, 35(4), 2–10.
Pyo, S., Mihalik, B., & Uysal, M. (1989). Attraction attributes and
motivations: A canonical correlation analysis. Annals of Tourism
Research, 16(2), 277–282.
Ross, E. L. D., & Iso-Ahola, S. E. (1991). Sightseeing tourists’
motivation and satisfaction. Annals of Tourism Research, 18(2),
226–237.
Schofield, P. (2000). Evaluating castlefield urban heritage park from
the consumer perspective: Destination attribute importance, visitor
perception, and satisfaction. Tourism Analysis, 5(2–4), 183–189.
Selin, S. D. R., Howard, E. U., & Cable, T. (1988). An analysis of
consumer loyalty to municipal recreation programs. Leisure
Science, 10, 210–223.
Sirgy, M. J. (1984). A social cognition model of consumer satisfaction/
dissatisfaction: An experiment. Psychology & Marketing, 1, 27–44.
Swan, J., & Combs, L. (1976). Product performance and consumer
satisfaction. Journal of Marketing Research, 40, 25–33.
Tse, D. K., & Wilton, P. C. (1988). Models of consumer satisfaction:
An extension. Journal of Marketing Research, 25, 204–212.
Turner, L. W., & Reisinger, Y. (2001). Shopping satisfaction for
domestic tourists. Journal of Retailing and Consumer Services, 8,
15–27.
Uysal, M., & Hagan, L. R. (1993). Motivation of pleasure to travel
and tourism. In M. A. Khan, M. D. Olsen, & T. Var (Eds.), VNR’S
Encyclopedia of Hospitality and Tourism (pp. 798–810). New York:
Van Nostrand Reinhold.
Uysal, M., & Jurowski, C. (1994). Testing the push and pull factors.
Annals of Travel Research, 21(4), 844–846.
Uysal, M., & Noe, F. (2003). Satisfaction in outdoor recreation and
tourism settings. In E. Laws (Ed.), Case Studies in Tourism
Marketing (pp. 140–158). London: Continuum Publisher.
Yoon, Y., Gursoy, D., & Chen, J. (2001). Validating a tourism
development theory with structural equation modeling. Tourism
Management, 22(4), 363–372.
Yuan, S., & McDonald, C. (1990). Motivational determinants of
international pleasure time. Journal of Travel Research, 29(1),
42–44.