Private equity valuation for hanoi stone slab and construction joint stock company
Bạn đang xem bản rút gọn của tài liệu. Xem và tải ngay bản đầy đủ của tài liệu tại đây (1.67 MB, 63 trang )
NATIONAL ECONOMICS UNIVERSITY
CENTRE FOR ADVANCED EDUCATIONAL PROGRAMS
BACHELOR’S THESIS
Topic: Private equity valuation for Hanoi Stone
Slab and Construction Joint Stock Company
Student’s name
: NGUYEN NHU KHANH
Major
: Finance
Class
: Advanced Finance B
Student’s ID
: CQ11121971
Supervisor
: PROF. PHAM QUANG TRUNG,
PHD.
HANOI, 2016
2
ACKNOWLEDGMENTS
For starters, I am pleased to send a gratitude to my thesis instructor, Prof. Pham
Quang Trung, who has given me precious and valueless advice on choosing
research topic as well as writing the thesis report during the course of preparation,
definitely without his assistance and profound knowledge, this thesis could not be
finished as it is today. It is my honor to be instructed by Prof. Pham Quang Trung.
Thank you very much again!
Secondly, I want to thank my internship guide, Mrs. Nguyen Hong Nga, officer at
Finance and Accounting Department, Hastone Vietnam.,JSC. With her instruction
and assistance, I am capable of gathering sufficient data and information to finish
my thesis. Her comments and advices on the content also contribute a great deal to
the completion of this thesis. Especially, her personal inspiration during tough
period at work gives me much support and motivation to complete this project.
Finally, I want to thank all the lecturers at NEU and AEP centers, Mrs.Quyen at
Advanced Finance 54B for the precious time with me during four years at National
Economics University. Without your teaching, supports and assistance, I cannot be
here today to complete my thesis. Thank you all very much!
TABLE OF CONTENTS
2
3
STATUTORY DECLARATION
I herewith formally declare that I myself have written the submitted Barchelor’s
Thesis independently. I did not use any outside support except for the quoted
literature and other sources mentioned at the end of this paper.
Hanoi, ...../...../ 2016
Nguyễn Như Khánh
3
4
ABBREVIATION
BPS
Book value per share
Capex
Capital Expenditure
CAPM
Capital Assets Pricing Model
DDM
Dividend Discount Model
EBITDA
Earnings before Interest, Tax, Depreciation and Amortization
EPS
Earnings per share
EV
Enterprise Value
EVA
Economic Value Added
FCFE
Free Cash Flow to Equity
FCFF
Free Cash Flow to Firm
Hastone
Vietnam.,JSC
Hanoi Stone Slab and Construction Joint Stock Company
NOPAT
Net Operating Profit after Tax
NWC
Net Working Capital
RI
Residual Income
WACC
Weighted Average Cost of Capital
4
5
LIST OF TABLES
Table 1: Functions and Responsibilities of Departments at HASTONE.,JSC
Table 2: ROE decomposition in 5 factors
5
6
LIST OF FIGURES
Figure 1: Organizational Structure of HASTONE.,JSC
Figure 2: Characteristic of product classification in the market
Figure 3: Five-Force Model created by M. Porter
Figure 4: Quantity of producing facing tiles of enterprises on Vietnam market
Figure 5: Growth of Total Assets
Figure 6: Growth of Profit after-tax
Figure 7: Result of FCFF model
6
7
ABSTRACT
This report emphasizes on the challenges in valuing with different methods a joint
stock company, which has not IPO yet. This also has tried to discuss and analyze
how an investor should try to value a private company. In addition to special
characteristics like the value of control, illiquidity discount and lack of
diversification, normal valuation issues and techniques have been discussed as well.
Following is details about the impact and further discussion on valuation process.
After that, the paper will simulate a full valuation process on Hastone Vietnam.,JSC
to estimate the equity value. Finally, I will use such result to make recommendation
for investors regarding the investment opportunity in Hastone Vietnam.,JSC.
7
8
INTRODUCTION
1. Rationale
Granite stone market is on the trend to a promising market, in terms of the
conditions to develop and modernize in Vietnam, especially for new constructions
and building, the demand for aesthetic of them is significantly increasing. This
potential product is quickly attracting a lot of capital and the cash inflow to this
industry rapidly goes up in current time. Vietnamese-Granite products are now
prioritizing in Europe, Middle-East and Asia. In 2009, export of paving stones of
Ha Dong is estimated at over 12 million USD in export value.
Speaking of investment opportunity, we easily realized that field is on uptrend.
Understanding and analyzing the granite stone industry in general as well as
Hastone Vietnam.,JSC which was state-own company and then restructure to
become a joint stock company, after that we will conduct to evaluate this firm. As a
matter of investment discipline, corporate valuation appears to be one of the most
significant steps in making investment decisions.
Valuation mostly concerns with the determination of an enterprise’s intrinsic value,
which is conceptually defined as its capability to generate future cash flow for both
creditors and shareholders. Moreover, there are other methods finance theories
aiming at identifying a reasonable measure of a firm’s value. An estimate of
corporate value serves as the benchmark for investors in their investment decision.
In other words, such estimators are essential in various other financial activities
such as merger & acquisition (M&A), leveraged buyouts (LBOs) or initial public
offerings IPOs.
Another thing people have to pay attention when analyzing and determining the
intrinsic value of manufacturing firm is comparing the accounting policy such as
depreciation methods, revenue recognition, allocation of financial lease or operating
lease or specific items include capital expenditure, working capital as well as debt
categories etc. to other companies in peer group. There is nothing definitely good
or bad if we do not make a comparison to take a view of full picture.
8
9
2. Research objectives and scope
In recognition of the challenges analysts have to cope with when valuing
manufactured firms, the paper is concentrating on utilizing different valuation
approaches to determine corporate value. In more details, a granite stone market is
targeted for analytical review. The research paper attempt to answer three research
questions as following:
1. What are the challenges confronted by analysts when valuing a paving
granite stone-manufacturing firm in general and the condition of granite
stone industry of Vietnam in particular?
2. What are the recommendations for investors concerning the investment
opportunity?
3. What is the price per share Hastone Vietnam.,JSC using FCFF valuation
approach and addressing the identified challenges?
In terms of work scope, the research is limited to evaluating a specific paving
granite stone-manufacturing firm in Vietnam which is Hastone Vietnam.,JSC, the
company which has turned 40 years old in 2015 and just doing restructure from
Stated-own Company to Joint Stock Company. Moreover, the methods used in the
research will be detailed in the Methodology and Data chapter. In terms of valuation
purpose, this paper aims at providing price per share of Hastone Vietnam.,JSC for
secondary investors who are seeking investment opportunity in compound stone
industry.
3. Literature Review
a) The review of peer companies
In the first view, we will see the ability of business firms in this industry to make
the products. The chart below summarizes for two characteristics which are the key
point to compete in market.
9
10
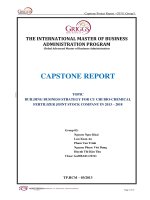
Figure 1.
Characteristic of product classification in the market
Source: Annual report of Hastone Vietnam., JSC
As we can see, Chinese goods, although engaged in all segments, from low-price
segment to high price segment, however, are positioned mostly cheap items.
Therefore, Vietnam business firms are considered in the same segment with the
segment of China. This should be seen as the fiercest competition when cheap
Chinese goods attacked with various designs and makes most companies
manufacturing ceramic tiles and granite in Vietnam get losses or low profitability.
Meanwhile, the premium segment is dominated by the products of Italy and Spain,
even to compete in this segment is more pleasant and brings better margins.
There is several reasons lead to lower margins popularity of granite companies in
Vietnam. Firstly, the business environment of Vietnam is detrimental to the
manufacture granite and ceramic tiles company in competition with Chinese
products: utility costs and the cost of capital accounts for a large proportion of the
total cost of the ceramic tiles company. In Vietnam, the prices of energy and fuels
such as electricity, coal continuously escalating along with the frequent power cuts
in the state of rotation is one of the important reasons that companies price of bricks
10
11
Vietnam tiling considerably higher than Chinese companies. Besides, the high
interest rates of Vietnam also caused many difficulties for the granite firms as they
depend heavily on bank loans. Unfortunately, many granite companies in Vietnam
get stuck along with strategies: They have not pursued a strategy to become the low
cost producer in comparison with the production of Chinese, they also do not have a
capacity to put investments into differentiate by providing superior products when
compared to products imported from Italy and Spain.
b) Empirical review of Hastone Vietnam., JSC
It is obvious to realize that Hastone Vietnam., JSC has not IPO yet so their stocks
are mainly trading through OTC. The report to analyze or evaluate stock price of
OTC stocks in Vietnam is scarce and Hastone Vietnam., JSC is not an exception.
Due to the lack of data and the scale is small relative to several big brands in this
industry as Viglacera or Vicostone; analysts rarely pay attention to small-median
firm as Hastone Vietnam., JSC. Consequently, this research paper is prepared in
order to fill this gap in methodology and data section.
11
12
CHAPTER 1: OVERVIEW OF HASTONE
VIETNAM.,JSC
1.1.
Background information of Hastone Vietnam.,JSC
Company Name: Hanoi Stone Slab and Construction Joint Stock Company
Abbreviation: HASTONE.,JSC
The logo of the company:
Head Office: 150 Thanh Binh Street, Ha Dong District, Hanoi, Vietnam
Phone: (84) 433 504 560
Fax: (84) 433 820255
Email:
Website: www.hastone.com
Over 30 years of development, from a factory with small production scale, thanks to
the hands and minds of the leadership team and employees in the company, Hastone
Vietnam.,JSC has grown and grown, becoming a company specializing in the
manufacture and supply of materials for the building industry at home and abroad.
It has proved that the existence and the will to rise by a local business in the market
economy today.
1.2.
Characteristics of the Business Operation of Hastone Vietnam.,JSC
Hastone Vietnam.,JSC provides goods, services and competes mainly in the tiles
industry with purpose to gain market share to be the largest producer in the country
12
13
with quality products and services to the highest, fully meet requested customers at
home and foreign market. The main products and services of Hastone Vietnam.,JSC
is:
-
Production of import-export business paving stones and other construction
materials.
•
Marble, Granite Stone.
•
Handwork Sawn Stone.
•
Rough Split Marble.
•
Tumbled Pebbles.
•
Unshaped Tumbled Marble.
•
Natural Pebbles.
•
Other production made from stone.
-
Business housing development.
-
Construction of civil, industrial, transportation, small and medium irrigation.
-
Installation, repair, equipment and spare parts.
-
Sales of supplies, equipment and machinery.
-
Interior decoration and exterior.
-
Production engineering, manufacturing precast concrete components.
-
Supporting and building the public infrastructure.
-
To build public infrastructure.
13
14
1.3.
Organizational Structure of Hastone Vietnam.,JSC
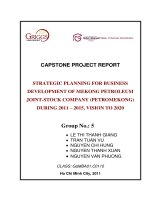
Figure 1.1. Organizational Structure of Hastone Vietnam.,JSC
Source: Administrative Organization Department of Hastone Vietnam.,JSC
14
15
Table 1.1.
Functions and Responsibilities of Departments at Hastone
Vietnam.,JSC
Department
Functions
Board of Management
BOM manages all business operations and
administrative activities. It elected by shareholders
of HASTONE., JSC by annually.
(BOM)
Director
Director who nominated by board of director is
responsible for serving and following all the
procedures and obligations assigned. Director
usually has full possibility to make the decision
related to the issues of business activities.
Deputy Director
Deputy Director is in charge of administrative
activities and mandated by the director to support
and manage the issues of daily transactions and
business operations. When director is in absent
condition, deputy director has full power to make
decision on behalf of director.
•
This department is consisting of 6 members
including 1 head of department, 1 deputy and 4
employees.
•
Execution of sales and developing plan for the
company.
•
It is responsible for seeking and finding the
best source of goods and other input materials.
Moreover, they have to define consumer
products, supply and demand of industry to
create the appropriate strategy to give the
BOM the advice and report the performance
monthly.
•
In several specific conditions, they have to do
the marketing research, gather and process
data to find out the tactical allocations in shortterm.
•
Consisting of 4 members includes 1 chief
accountant, 4 accountants.
•
Implementation of accounting honestly, fully,
objectively and free from error material with
Sales Department
Accounting & Finance
Department
15
16
specific data.
•
Gathering, processing and providing economic
data to help the director and the board make
decisions for business management related to
the actual situation of the company.
•
Prepares financial statements annually
complied with Vietnam Accountant Standard
and ensure the regular operation of company.
•
Make full payment for the compensation and
welfare of employees.
•
Consisting of 7 members includes 1 head of
department, 1 deputy and 5 employees.
•
Execution following the technical standards
for checking the quality of goods and materials
input as well as output, analyzing products
after each stage until put it in the final step for
packaging and store finished goods to
distribution.
•
Installation and checking routine repair of
machinery and other equipment to judge
whether it has to be replaced.
Technical Department
16
17
•
•
Factory 1
&
Support the board of directors in the
implementation of regulations, policies and
compliance of employees as well as requiring
every staff follow the labor standards and
promoting the ethical competence.
•
Implement as human resources department for
directors related to recruitment, training and
promotion. In addition, they are in charge to
remain the fair dealing between the employees
and environment working.
•
Administrative
Organization Department
Consisting of 7 members includes 1 head of
department, 1 deputy and 5 employees.
Performs extra administrative work such as
clerical work, storage, labor wages, car
driving.
Manufacturing and business activities of the
company are divided into two areas Ha Dong and
Xuan Mai but basically business production
allocates mainly in headquarters of company located
in Ha Dong. These factories operate with the
technological processes and follow the direction of
sales and technical department to define the
appropriate condition to falsify productivity. There
are few information of two factories:
•
Factory 1: Consisting of 81 employees. The
mission of the Factory 1 is producing Granite
and refining unfinished products of the Factory
2.
•
Factory 2
Factory 2: Consisting of 33 employees. The
mission of the Factory 2 is producing marble
mosaic tiles and providing unfinished products
for the Factory 1.
Source: Administrative Organization Department of HASTONE.,JSC
J
17
18
CHAPTER 2: THEORETICAL BACKGROUND
2.1.
Equity Valuations
2.1.1. The definition of corporate value
Financial theories have created a well-established body of research about value of a
business firm and its significance. Several scholars attempted to determine an
accurate and practical definition of companies’ value for the active and prospective
investors. The most widespread notion of corporate value refers to the so-called
“Intrinsic Value” of a stock. “Intrinsic value, a term coined and used firstly in
ethics philosophy, refers to the essential nature and constitution of a thing or
inherent characteristics of a being. By analogy, as a matter of financial elements,
intrinsic value of a company demonstrates a firm’s or an asset’s true value when
incorporating all the characteristics of that firm or asset into the valuation process”
(Jerald E. Pinto et al., 2010). This version of value definition is basically correct but
mainly theoretical, which means it is not practical to arrive at an exact evaluating of
an asset’s intrinsic value. Under traditional efficient market hypothesis (EMH),
Fama and Eugene argued that “stock market is extremely efficient in incorporating
all information into stock price, which makes market price approximately identical
with its intrinsic value. In other words, the EMH asserts that both technical and
fundamental analyses are irrelevant in valuing public stock and market price serves
as a reliable estimate of stock’s true value - Fama and Eugene (1970). As an
argument to the notion of unity between market price and intrinsic values, Sanford
J. Grossman and Joseph Stiglitz (1980) and Lee, Charles M.C., and Bhaskaran
Swaminathan (1999) emphasize “the significance of cost-benefit relationship
between incurring additional cost to obtain information and potential additional
returns; trading costs as well as difficulties in determining company’s true value,
which altogether create the possibility of divergence of market price from the
intrinsic value or mispricing.”
Another noting point that is intrinsic value is useful only in case of continual
operation of the business. The technical term for this requirement is the goingconcern assumption, which supposes that the company will continue to operate
normally in a foreseeable future. Hence, in time of financial crisis and economic
downturn, another kinds and forms of value is needed to appropriately reflect the
18
19
firm’s situation. That is where “Liquidation Value” comes into the role. According
to Jerald E. Pinto et al. (2010), “liquidation value equal the sum of total selling
prices of individual assets in case of business dissolution. Williamson (1988) firstly
addresses the link between the liquidation values and debt capacity of a firm.
Additionally, he argues that the key determinant of an asset’s liquidation value is
the re-deloyability (assets can be redeployed or have alternative usages).” In their
work in 1992, Andrei Shleifer and Robert W. Vishny add to the discussion by
asserting that “the primary determinant of asset liquidation value is asset illiquidity
(the difference between selling price and value at best-use) since not all assets are
re-deployable.”
Being different from intrinsic value and liquidation value, in other investment
contexts, additional definitions of value are essential for the especial purpose of the
transaction. In case of private equity transaction, the exchange agreement between
two sides requires the presence of equality and parity. Consequently, the term “Fair
Market Value” is used to reflect this type of transaction. “Specifically, fair market
value refers to price at which two sides agree under the following condition: 1 Buyer and seller are willing to enter the agreement; 2 - Both sides are not under any
pressure to engage in the contract; and 3 - Both sides fully understand all
characteristics of the underlying asset. Another category of value definition is called
“Investment Value”. The term takes into account the fact that a particular
investment worth more for some investors than others concerning their needs and
expectations” - (Jerald E. Pinto et al., 2010).
2.1.2. The different methods to determine equity valuation
2.1.2.1.
Dividend Discount Model
James L. Farrell (1985) firstly introduces “dividend discount model by using the
same analogy in valuing bond which states that bond’s value equal present value of
stream of coupon payments plus the present value of principal payment at time of
maturity. The general version of dividend discount model is described as follow:
19
20
Where Dt is dividend received at time t, Pn is terminal price of a stock and r is
required rate of return. The determination of required rate of return will be
presented in detail later.
Gordon (1962) proposes a simple version of dividend discount model, which is
called Gordon Growth Model. The single most important assumption made by the
author is that dividend is expected to grow at a constant rate, g. As a result, we will
have:
or
The general version will become much simpler and easier to understand as
following:
“g” is determined as sustainable growth rate and g = ROE x (1 – payout ratio)”.
Gordon Growth Model is an appropriate valuation tool for firms when they are in
mature stage of life cycle with stable income and dividend policy. Sharpe et al
(1999) suggests that “Every firm must undergo three distinct phases of growth
including growth phase, transition phase and mature phase. Based on this
assumption, various versions of multistage dividend discount model are developed
and two most notable ones are two two-stage and three-stage models. For firms at
earlier stage of the cycle, a more complex and flexible model is needed for more
accurate estimate of value. That is where the Multistage Dividend Discount Model
comes into play.
Two-stage model asserts that firms will experience an initial high-growth period
followed by a perpetual stable-growth period. Formulation of this assumption is
described as below:
with
and
Vn =
Another version of two-stage model developed by Fuller and Hsia (1984) is called
H-model. H-model loosens the first period of growth from rigid one rate of growth
20
21
to a decreasing linear growth rate. Following mathematical representation will
illustrate the idea:
Finally, three-stage model states that firm with three growth stages should be valued
with three different period of dividend pattern. The only difference of three-stage
compared to two-stage model is that the former add a transition period between the
high-growth and stable-growth period, which makes more sense than the latter
version.” - Sharpe et al (1999)
2.1.2.2.
Free Cash Flow Discount Model (FCF Model)
For enterprises that do not pay dividend, dividend discount model become totally
irrelevant for valuation purpose. Fortunately, analysts are provided with another
alternative method that is even more effective with more theoretical rationality,
which is called Free Cash Flow Discount Model. Two versions of FCF model are
Free Cash Flow to Firm and Free Cash Flow to Equity. As CFA Curriculum 2016,
Lv1, Volume 5 mentioned:
Free Cash Flow to Equity “refers to all cash flows that are available to distribute to
stockholders of the firm, which is much more expansive compared to dividend as
the income received by firms’ owners. Mathematically, we have:
Or
And the value of firm’s equity is calculated as:
If the growth rate of FCFE is constant, the model becomes:
21
22
Where r is required rate of return on the stock and g is constant growth rate.” (CFA
Curriculum 2016, Volume 5, Level 1)
We can realized that FCFE model of valuation is very familiar to dividend discount
model in the case that they both uses the total amount which share-holders could
receive as free cash flow factors and required rate of return on stock as discounted
in denominator. However, FCFE is a broader definition of cash flow relative to
dividends and a more appropriated measure for benefits of firms’ owner in case
firms pay fewer dividends than their capacity. It is a number of reasons but some of
them include: the stability for their operating incomes, reserves capital for future
growing, tax advantages and other conditions of management.
As with dividend discount model, FEFE model has multistage version as well to
better capture the reality of firms. Following are formulation of two-stage and threestage FCFE models that are commonly used by financial analysts, as reference from
CFA Curriculum 2016:
Two-stage:
Three-stage:
Free Cash Flow to Firm “refers to all cash flows available to distribute to both
shareholders and creditors of a firm. There are a variety of ways to estimate FCFF
values, some of them are:
By this definition, FCFF is an even broader term for cash flow since it includes
creditor’s interest as well. Consequently, the discount rate used in standard model
must also take into consideration the rate of return that creditor requires if they
agree to lend the firms. That rate is called Weighted Average Cost of Capital
(WACC) and is mathematically presented as:
22
23
With rd is the cost of debt and r is the cost of equity (MV stands for market value).
By using FCFF, we can arrive at firm’s value by following calculation:
for constant FCFF growth for two-stage model:
The final step in the valuation is to calculate the equity value of the firm by
performing a straightforward subtraction as following:
(CFA Curriculum 2016, Volume 5, Level 1)
One significant point needs a careful attention here which is the issue of
determining cost of equity (ke) and cost of debt in valuation. For cost of equity (k e),
there are generally three major approaches to calculate cost of equity for an
investment. Following financial theories, we have:
-
The Capital Asset Pricing Model: CAPM is the most widely used approach
in determining cost of equity used in various valuation models. Following is
the mathematical representation of the approach:
•
r is the expected rate of return on equity
23
24
•
•
β is the systematic risk measure for the stock (practically, β is the
correlation coefficient after running regression of 60 monthly stock
return against market return)
•
-
rf is the risk-free rate (practically, analysts use long-term government
bond yield)
rM is the expected market return (practically, analysts use overall
market index return, which in Vietnam is Vn-Index)
The Dividend Discount Model: Another useful method to determine cost of
equity for a firm is to use dividend discount model. The formula is present as
followed:
•
•
D1 is dividend per share at time t=1
•
-
re is the expected rate of return on equity
g is the sustainable growth rate, g = ROE x Retention rate
The Bond Yield plus Risk Premium: The final approach is the simplest one
that can be used to estimate cost of equity. Analysts just simply add 3 to 5
percentage point to bond yield as the risk premium to arrive at cost of equity.
For cost of debt (rd), analysts can use the current Yield to Maturity or Debt-Rating
approaches:
-
Yield to Maturity Approach: For case of bond or bank loan, cost of debt r d
can be determined by applying following formulation.
•
Rd is the cost of debt
•
PMTt is coupon payment at time t
•
FV is the principal
24
25
•
-
P0 is current market price of the bond
Debt-Rating Approach: If there is no available information regarding the
debt rate for manufactured private firm. Analysts can estimate r d based on the
debt-rating of the target firm and look up the yield on similar debts in the
market, but there is no source to find the debt-rating for Hastone
Vietnam.,JSC, so this way is non-applicable.
(CFA Curriculum 2016, Volume 5, Level 1)
2.1.2.3.
Residual Income Discount Model
Residual income is defined as the accounting net income minus the equity charge.
As Ohlson (1995) researched and defined that “capital charge is a term coined to
reflect the opportunity cost of equity capital utilized to generate net income reported
in income statement. One of the most common versions of residual income is
Economic Value Added (EVA), which is defined by following formula:
Where NOPAT is net operating profit after taxes, C% is the cost of capital and TC
is total capital employed by the firm. The full model of residual income valuation,
developed by Ohlson (1995) is given below:
with B0 is current per-share book value of equity, Bt is the expected per-share book
value of equity at time t, Et is expected earnings for period t and r is required rate of
return (cost of equity)” Ohlson (1995).
Residual income discount model has a lot of absolute advantages over other
academic models. Several available financial data are included in these models,
terminal value of firms for lower percentage of equity value and necessary in case
of negative cash flow or high level of uncertainty in forecast. Unfortunately, this
model brings several weaknesses, which are inadequacy of financial data in
reflecting the economic condition of the firm and other requirement relation.
25