Mô hình Hedonic PC ứng dung trong đinh giá
Bạn đang xem bản rút gọn của tài liệu. Xem và tải ngay bản đầy đủ của tài liệu tại đây (81.64 KB, 10 trang )
Dr. Stefan Linz (Diplom-Volkswirt) and Gudrun Eckert (Diplom-Kauffrau)
Introducing hedonic methods in price statistics
Hedonic methods have come to play a growing role in measuring price trends and economic
growth in recent years. Germany’s Federal Statistical Office has formulated a step-by-step plan for
a detailed examination of the effects and practicability of applying hedonic methods. This essay
describes the Federal Statistical Office’s efforts to introduce hedonic methods into price statistics.
Apart from outlining framework conditions and plans for the future, it focuses in particular on the
hedonic price index for personal computers implemented in June 2002 as part of the overall
consumer price index.
1
The story so far
When calculating price indexes, central importance is attached to how quality changes to
observed goods can be taken into account. The objective of official price statistics is to measure
what we call “pure” price changes, i.e. price movements purged of the adulterating influence of
quality change. Hedonic methods, as they are now known, are special techniques for quality
adjustment that have recently been incorporated into official German price statistics. They
particularly lend themselves to technological goods which are subject to rapid progress and
cannot be observed over a long period with the quality remaining unchanged. For hedonic quality
adjustment, a good is conceptually broken down into quality features and then the influence of
these features on the price is determined using regression analysis. In this way, those price
changes that result only from qualitative changes to certain features can be mathematically
separated from pure price changes and eliminated.
The United States has played a pioneering role in introducing hedonic methods into national
price statistics, implementing a hedonic price index for computers in the mid-1980s. Hedonic
methods have since been applied to many more products in the USA, such as housing rent since
1987, clothing since 1991, multi-family homes since 1993, digital phone systems since 1997
and television sets since 19991.
The German Federal Statistical Office also explored the subject at a very early stage. In 1990 a
study of the uses of the hedonic method concluded that this method was a promising alternative
to conventional calculation methods, but that the difficulties of practical application should
nevertheless not be overlooked2. At the time the costs and benefits of introducing hedonic
techniques were compared and their use for official statistics was rejected. Other European
countries, with the exception of France, made similar decisions. In France a hedonic producer
price index was introduced for computer equipment in the early 1990s. Further hedonic price
indexes followed for clothing, household appliances and books. In other European countries
1
2
Cf. MOULTON, Brent R., The Expanding Role of Hedonic Methods in the Official Statistics of the U.S.,
(24.9.2002).
Cf. GNOSS, Dr. Roland et al, Neue Ansätze zur Berechnung von Preisindizes, Empirische Analyse der
sogenannten hedonic-Indizes zur Eliminierung der Qualitätskomponente bei der Berechnung von
Preisindizes am Beispiel von Computern, no. 13 in the series Ausgewählte Arbeitsunterlagen zur
Bundesstatistik, Statistisches Bundesamt, Wiesbaden, 1990, p. 43.
1
(Sweden, Finland, Belgium and now Germany) hedonic indexes are so far only used for one or
two products.
The hedonic method also plays an important part in measuring real gross domestic product. For
deflating purposes, nominal gross domestic product is recalculated into real figures using price
indexes. In principle this recalculation is carried out by dividing nominal values by the
corresponding prices. The lower the measured price trends are in a product category, the greater
is the measured real growth in turnover in that sector. Furthermore, price trends are lower when
quality increases in a product category. If, for example, a product’s directly observed prices
remain more or less constant while its quality increases, then from an economic perspective this
is a drop in prices and quality-adjusted price statistics will show declining prices. Thus
productivity gains make their mark on measuring real economic growth via quality adjustment.
The hedonic method is especially helpful in demonstrating these productivity gains adequately.
In certain cases, its use in price statistics can lead to increased measured price decline and
therefore to greater increases in real gross domestic product than conventional quality
adjustment techniques.
In this sense the isolated use of hedonic methods in individual countries adversely affects
international comparability of economic growth figures. The Ifo Institute expressed this as
follows:
"Hedonic techniques take quality changes into account to a greater extent than
conventional adjustment methods, which leads to a more dynamic development of real
investments and, insofar as domestic products are concerned, also raises real gross
domestic product"3.
However, the magnitude of these deviations is very difficult to measure. It is impossible to make
a general statement about whether reality is better expressed using hedonic methods or
conventional ones. These uncertainties leave plenty of room for speculation. Doubts concerning
international comparability of productivity figures – as they are regularly aired in the press – have
lead to palpable uncertainty among data users. Users of statistical data have increasingly
questioned the reliability of official economic growth figures. This limited international
comparability is merely a common launchpad for contradictory and often simplistic arguments
about the introduction of hedonic methods. For example, hedonic price measurement is often
mistakenly equated with the principle of quality adjustment itself, overlooking the fact that
quality adjustments have been used throughout the history of price statistics.
Furthermore the word “hedonic” is often understood to mean more than it actually does: the
hedonic technique does not differ from other forms of quality adjustment conceptually so much
as technically. For some goods, the results obtained by different techniques are not as different
as is often claimed. For other goods, especially those with very short life cycles and improved
price/performance ratios in new product generations, the variation can be significant.
The Federal Statistical Office believes it has a responsibility to place this debate on a more
rational footing, and has decided to test the practicability and impact of introducing hedonic
methods in a comprehensive programme. The hedonic method will be tried out on specific goods
3
NIERHAUS, Wolfgang, Wirtschaftswachstum in den Volkswirtschaftlichen Gesamtrechnungen: Ein Vergleich
Deutschland – USA, p. 47, in: ifo Schnelldienst 3/2001, pp. 41-51. (Original text in German)
2
where the technique has proved useful in the experience of other countries and by scientific
studies.
To lay foundations for the work to come, the Federal Statistical Office joined with the Deutsche
Bundesbank to convene a symposium on the use of hedonic methods in June 2001. Based on the
discussions that took place there, the following conclusion was reached:
"The experiences deliberated in this high-calibre symposium demonstrate that the very
personnel-intensive hedonic techniques can, under certain circumstances, provide
important additional insights, especially about goods subject to erratic waves of
innovation, e.g. personal computers. Hedonic price measurements provide an opportunity
for broadening and improving the basis of statistical information. However, this
information gain in certain fields must be weighed up against the significantly greater effort
required in data collection and processing and the burden on enterprises."4
In a next step the Zentrum für Europäische Wirtschaftsforschung (ZEW – Centre for European
Economic Research) in Mannheim was commissioned to carry out a study on the uses and effects
of applying hedonic methods to official price statistics. The ZEW had already gained experience
of the problems faced in the implementation of hedonic methods by participating in the work of
the European Hedonic Centre. The European Hedonic Centre, a project funded by Eurostat,
examines opportunities for European nations to use shared data for calculating hedonic price
indexes5. The ZEW’s study for the Federal Statistical Office calculated hedonic price indexes for
personal computers and private motor vehicles and compared them to conventional indexes.
Another task under this remit was a global survey of the use of hedonic methods by statistical
agencies. The results of the study were discussed at an international conference organised by the
ZEW in Mannheim in April 20026. In its final report in September 2002 the ZEW reached the
following conclusion:
"The use of hedonic methods for price adjustment is very promising. Therefore it is not
surprising that our survey showed many institutions intending to use hedonic indexes, and
those that already do intending to extend the practice to further goods. In the future we
expect a tendency towards using hedonic methods for certain product categories, such as
PCs or private cars. The selection of goods where quality adjustment would be improved by
hedonic methods should be based on criteria such as the frequency of product change, the
speed of technological progress, the extent of quality changes and especially their
consumption significance."7
Commencing in January 2001 the Federal Statistical Office had already introduced an interim
solution for calculating a consumer price index for PCs. Instead of assembled computers, PC
4
FEDERAL STATISTICAL OFFICE, Press release on 22 June 2001, (Original text in German)
(24.9.2002).
5
On the goals of the European Hedonic Centre see
(24.9.2002), and on the initial
findings see the progress report by KONIJN, Paul (Eurostat); MOCH, Dietmar (ZEW); DALÉN, Jörgen (statistics
consultant), Searching for the European Hedonic Function for PCs, available under
(24.9.2002).
6
Conference scripts can be found on the following website under the "Programm" link:
www.zew.de/de/veranstaltungen/details.php?LFDNR=63&mi=VER&si=ARC (24.9.2002).
7
MOCH, Dietmar et al, Einsatzmöglichkeiten hedonischer Techniken in der amtlichen
Verbraucherpreisstatistik, Endbericht für das Statistische Bundesamt, Mannheim, September 2002, p.
110. (Original text in German)
3
components were observed. In this manner the problem of short product cycles for assembled
computers was reduced. The result was a shift towards the principle of hedonic quality
adjustment. Since June 2002 hedonic methods have been used for quality adjustment in the
“personal computer” price index category.
The following project phases have been planned for the future:
Project phase
Scope
Date of implementation
Combination of hedonic methods and
conventional quality adjustment for private
cars
1 sub-index
1/2003
Hedonic producer, import and export price
indexes for data-processing equipment
3 sub-indexes
4/2004
Hedonic price indexes for electrical
household appliances and consumer
electronics
2 sub-indexes
10/2004
By the beginning of next year the intention is to combine conventional quality adjustment
techniques with hedonic methods in the case of private cars. Introducing hedonic producer,
import and export price indexes for data-processing equipment is planned for the end of the first
quarter of 2004. Finally, by the last quarter of 2004 hedonic methods are to be introduced for the
categories “electrical household appliances” and “consumer electronics”.
2
The principle of hedonic quality adjustment
2.1
Quality adjustment techniques
To elucidate the principle underlying the hedonic method, we must first address the basic
problem of quality adjustment in price statistics. Theoretically the price of an item at two
separate times can only be usefully compared if the quality of the item remains constant. As
mentioned above, the objective of official price statistics is to measure “pure” price changes.
This is reflected in the basic Laspeyres principle of once defining a basket of goods and keeping
it as constant as possible over a defined period of time8.
This principle causes difficulties when products change frequently and certain goods in the
basket are no longer available on the market in their initial form so that the prices of the original
goods can no longer be observed. In these cases official price statistics undertake quality
adjustment. This introduces the monetary value of an item’s quality change into price
observation. A typical example might be air conditioning for a car: if from a certain point in time
air conditioning is included as a standard feature of the particular model – and thereby becomes
part of the price – an attempt must be made to determine the monetary value of this additional
feature. A proportion of this value is then subtracted from the car’s selling price in order to permit
comparison with the previous month, when air conditioning was not yet a standard feature.
8
Cf. KUNZ, Dietrich, Ausgewählte methodische und praktische Probleme des zeitlichen Preisvergleichs, p.
23, in: Allgemeines Statistisches Archiv; vol. 55; no. 1/1971, pp. 23-38.
4
The technique used in this example is called feature adjustment and is a widely used form of
quality adjustment9. Another reliable quality adjustment technique is the overlapping link
method (or simply overlap method), where the price of an alternative product is observed over
time alongside the selected product. This means that if the selected product changes the
alternative can be included in the basket in its place. However, this switch to an alternative item
can only take place when both products are available in the market simultaneously at
equilibrium prices. Under these conditions it can be assumed that the observed difference in
price between the old and the new product is due to a difference in quality. This “monetary value
of quality difference” can then be taken into account when splicing the old and new item.
Hedonic methods are quality adjustment techniques of a specific kind10. The central element of
hedonic quality adjustment is regression analysis, which is used to determine a quantitative link
between an item’s selling price and its quality features. Following this, there is a choice between
two different hedonic quality adjustment techniques, the “time dummy variable method” and the
“imputation method”. There are, in turn, several variations on both these procedures. The
following sections outline the variations tested by the Federal Statistical Office for the product
category “personal computers”.
2.2
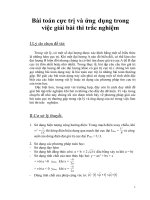
Time dummy variable method
In the time dummy variable method computer prices and quality features are summarised for two
consecutive months and combined in regression analysis. The procedure is demonstrated in
Figure 1 for the months of August and September.
Figure 1: Time dummy variable method
August sample
Prices and quality features
September sample
Regression August / September
p = f(x1, x2 ..., t, ε)
Prices and quality features
In the regression equation the price p is explained by the computer’s quality features x1, x2...
Quality features could be processing speed, hard disc storage capacity etc. The time variable t
differentiates August and September. Finally, the random variable ε is used to indicate that not
all influences on a computer’s price are measurable in reality. For example, additional retailer
services (home servicing, telephone hotline) are not considered in the data used here. The
monthly price index follows from the influence of the time variable on the price as calculated by
regression analysis. In a linear function the value of the time variables would denote the absolute
9
For an overview of conventional quality adjustment techniques see KUNZ 1971, op. cit., p. 24 ff.
An overview of scientific articles on the development of the hedonic method can be found in HARHOFF,
Dietmar, Methodik und Einsatz hedonischer Preisindizes – Ein Überblick, in: HARHOFF, Dietmar and Müller,
Michael (eds.), Preismessung und technischer Fortschritt, ZEW Wirtschaftsanalysen, volume 2,
Mannheim 1995, pp. 37-60.
10
5
quality-adjusted difference in prices between computers sold in August and those sold in
September.
Following the procedure above, a separate regression is calculated for each of
September/October, October/November and so on. The price index is calculated from this
sequence of month-on-month quality-adjusted price changes.
The time dummy variable method is a very simple technique for calculating hedonic indexes.
However, its disadvantage is that all data for regression analysis must be available on time to
calculate an up-to-date index number each month. As the regression analysis requires a
comparatively large sample with many different product variants in order to ensure sufficient
variation among quality features, a significant data effort is essential. This disadvantage is less
acute with the imputation method.
2.3
Imputation method
The imputation method does not calculate the index number directly from the product of the
regression equation. The regression function only serves to establish a link between the price
and quality of the goods. The regression equation is used to calculate how many monetary units
consumers are willing to pay on average for a certain quality gain. As with feature adjustment as
described in section 2.1, this information can then be used for actual quality adjustment by
subtracting the monetary value of the improvement in quality from the directly observed change
in prices. In this method, therefore, the regression equation contains no time variable (cf. Figure
2).
Figure 2: Imputation method
Regression analysis
Information about price/
quality link
p = f(x1, x2..., ε)
Quality adjustment
The imputation method has the advantage that it does not require regression analysis data to be
updated for the current month. The use of regression analysis only serves to calculate a general
link between price and quality which is valid for several months rather than just one. Using a
preceding month’s data is, therefore, acceptable. With the imputation method quality adjustment
can then take place based on a smaller sample around data which has been updated for the
current month. It is this advantage which prompted the Federal Statistical Office to adopt the
imputation method for calculating its personal computer sub-index. The technique has been
used in official statistics since June 2002 and is described in the following section.
3
The hedonic sub-index for personal computers
3.1
Data sources
Two separate samples are used to calculate the sub-index for personal computers. The first
sample contains data for the regression analysis. The mathematical link between price and
6
quality features derived from this regression analysis is used for the quality adjustment and for
the actual index calculation based on the second sample. Thus only the second sample contains
the prices and quality features of the sold models which contribute to the index calculation.
The first sample consists of data which the Federal Statistical Office purchases from the market
research company GfK (Gesellschaft für Konsumforschung) in Nuremberg. The GfK provides
monthly information on prices, quality features and sales figures for computers which it has
gleaned from the merchandise information systems (so-called scanner data) of sample
companies. This data is used for a regression equation to determine which price differences are
based on variations in computer quality within the sample.
The calculation of the actual index, i.e. the quality-adjusted month-on-month price change, is
based on the second sample taken from advertisements in professional publications and on the
internet. Only PCs for sale via mail order, and therefore at uniform prices across the country, are
included. Ideally all retailers would be considered, including regional ones. Using mail order data
is justified because it is much easier to collect, but it also seems to make sense from a technical
point-of-view: mail order prices are transaction prices, i.e. there are no significant differences
between additional services offered via mail order, and market dominance based on special
regional status can be ruled out. Furthermore, mail order quotes are used by interested parties to
compare prices even when they buy or sell computers via other channels.
3.2
Index calculation
When calculating the index the second sample is divided into three components: subset A
consists of computer models observed in the previous month but no longer purchased in the
present month. Subset B includes computers which, apart from the price, were registered with
exactly the same features in the previous month. Subset C, to complete the picture, is composed
of models which had not yet been observed in the previous month.
Figure 3: The second sample subsets
Month 1
Subset A:
Month 2
models no
longer on sale
Subset B:
identical
models to last
month
Subset C:
new models
7
The price index is now calculated in two steps: first the mean change in price on the previous
month is calculated for all computers in subset B. This mean value, referred to below as the
direct month-on-month change (MCdirect), expresses the change in price of those computers which
were also available in exactly the same form via mail order in the previous month. The second
step creates a link between the models in subset A, now withdrawn from stock, and the new
models in subset C. A hedonic quality adjustment is obtained by the following method:
The mean price PMA and PMC and the mean feature vector XMA and XMC are now calculated for each
sample. The two mean prices are used first to calculate the observed price change on last month,
MCobs. Then the regression equation is used to calculate a hedonic rate of price difference MChed,
obtained purely by calculation as a result of inserting first feature vector XMA and then feature
vector XMC into the regression equation. MChed expresses how the price would have changed if the
models in subsets A and C had differed solely in quality without any other price variables taking
effect (no inflation). In other words, MChed expresses the “monetary value” in percentage terms of
the month-on-month quality change. The “pure” price change between the old and new products,
MCold/new, is calculated as the difference between the observed price change and the hedonically
calculated monetary value change:
(1) Month-on-month change for new models: MCold/new = MCobs – MChed
Figure 4 shows the links between the two subsets A and C. As we might expect, observed prices
alter only slightly as new models are introduced (MCobs is small), while the quality of the new
products (XM) rises and the monetary value of the quality change increases with it (MChed is
greater than MCobs). As a rule, then, the pure price change for new models compared with models
no longer observed, MCold/new, will be negative.
Figure 4: Rates of change in subsets A and C
Month 1
PMA
Month 2
MCobs
PMC
Phed = f(X MC )
MChed
Phed = f(X M A)
XMC
XMA
The calculation for the resulting total index integrates both the direct month-on-month price
change described above and the quality-adjusted “pure” month-on-month change:
(2) hedonic total index: TMC = a ⋅ MCold/new + (1-a) ⋅ MCdirect where 0 ≤ a ≤ 1.
8
Factor a weights the proportion of new models in the overall sample. This factor represents the
ratio of the frequency of sale of new models to the frequency of sale of existing models.
3.3
Regression analysis
In September the following quality features were included in the regression analysis as
explanatory variables:
Variable
Symbol
Scorecard value
score
Indicator for hard disc storage capacity (dummy variable)
Dhdd
Indicator for the FSC brand (dummy variable)
DFSC
Indicator for the Sony brand (dummy variable)
DSony
The scorecard value is a measure of processor performance carried out by a neutral body11. This
determines performance when running a variety of software applications, attributing a score of
100 to the most powerful processor; all other processors are quantified in relation to this. The
indicator for hard disc storage capacity distinguishes between hard discs with a memory up to
and including 60 GB and those over 60 GB. Two further dummies were included to reflect
particular brand names. The brand dummies express quality differences perceived by consumers
but which cannot be measured by other variables, such as the manufacturer’s reputation.
The choice of variables included here is founded on specific technical considerations and also on
the empirically measured influence of the variables. It is not necessary to use precisely the same
dummies every month. What is important each month is to consider whether the regression
equation used in the previous month still describes present data optimally. If not, it should be
adjusted.
A log-log function was selected for calculating the regression equation:
(3)
ln(P) = ß0 + ß1⋅ln(score) + ß2⋅ Dhdd + ß3⋅DFSC + ß4⋅DSony + ε
P is price and ß0 to ß4 symbolise the regression coefficients. In the months June to September
regression analysis led each time to a coefficient of determination between 0.72 and 0.8.
Accordingly, about 70 – 80% of the observed price difference between computers in the sample
could be attributed to quality characteristics. The residual price difference was expressed by the
random ε.
3.4
Results
In September 2002 the hedonically calculated sub-index for personal computers demonstrated a
price change of –2.4% on the previous month. Using conventional quality adjustment methods,
the rate of price change for personal computers would have been determined as – 3.3%, i.e. 0.9
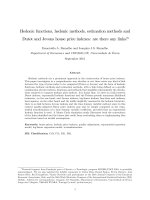
percentage points lower. Figure 5 displays rates of price change month-on-month since the
technique was introduced into official price statistics in June 2002.
11
Cf. www.cpuscorecard.com (25.9.2002).
9
Figure 5: PC price index, month-on-month, conventional and hedonic calculation
0%
-1%
-2%
-3%
-4%
-5%
-6%
Jun 02
Jul 02
conventional index
Aug 02
Sep 02
hedonic index
In June 2002, too, the hedonic index was higher than the one based on conventional adjustment.
In July and August 2002, however, the hedonic method revealed a sharper fall in prices than did
the conventional technique. Given that personal computers carry a low weight in the basket for
private households and that there was only a slight quantitative difference between the results
produced by the new and conventional method of quality adjustment, the overall inflation rate
was not affected by the introduction of hedonic techniques.
In June and September 2002 the relationship between the hedonic and conventional computer
price index did not follow the “typical” pattern: prior research had shown that a price index for
personal computers using hedonic quality adjustment techniques would on average display
sharper falls in price than using conventional quality adjustment techniques.
10