- Trang chủ >>
- Y - Dược >>
- Y học công cộng
One stop doc statistics and epidemiology ferenczi, emily, muirhead, nina
Bạn đang xem bản rút gọn của tài liệu. Xem và tải ngay bản đầy đủ của tài liệu tại đây (2.46 MB, 137 trang )
ONE STOP DOC
Statistics and
Epidemiology
One Stop Doc
Titles in the series include:
Cardiovascular System – Jonathan Aron
Editorial Advisor – Jeremy Ward
Cell and Molecular Biology – Desikan Rangarajan and David Shaw
Editorial Advisor – Barbara Moreland
Endocrine and Reproductive Systems – Caroline Jewels and Alexandra Tillett
Editorial Advisor – Stuart Milligan
Gastrointestinal System – Miruna Canagaratnam
Editorial Advisor – Richard Naftalin
Musculoskeletal System – Wayne Lam, Bassel Zebian and Rishi Aggarwal
Editorial Advisor – Alistair Hunter
Nervous System – Elliott Smock
Editorial Advisor – Clive Coen
Metabolism and Nutrition – Miruna Canagaratnam and David Shaw
Editorial Advisors – Barbara Moreland and Richard Naftalin
Respiratory System – Jo Dartnell and Michelle Ramsay
Editorial Advisor – John Rees
Renal and Urinary System and Electrolyte Balance – Panos Stamoulos and Spyridon Bakalis
Editorial Advisors – Alistair Hunter and Richard Naftalin
Gastroenterology and Renal Medicine – Reena Popat and Danielle Adebayo
Editorial Advisor – Steve Pereira
Coming soon:
Cardiology – Rishi Aggarwal, Nina Muirhead and Emily Ferenczi
Editorial Advisor – Darrell Francis
Respiratory Medicine – Rameen Shakur and Ashraf Khan
Editorial Advisors – Nikhil Hirani and John Simpson
Immunology – Stephen Boag and Amy Sadler
Editorial Advisor – John Stewart
ONE STOP DOC
Statistics and
Epidemiology
Emily Ferenczi BA(Cantab)
Sixth Year Medical Student, Oxford University Clinical School, Oxford, UK
Nina Muirhead BA(Oxon)
Sixth Year Medical Student, Oxford University Clinical School, Oxford, UK
Editorial Advisor: Lucy Carpenter BA MSc PhD
Reader in Statistical Epidemiology, Department of Public Health, Oxford University, Oxford, UK
Series Editor: Elliott Smock MB BS BSc(Hons)
House Officer (FY1), Eastbourne District General Hospital, Eastbourne, UK
A MEMBER OF THE HODDER HEADLINE GROUP
First published in Great Britain in 2006 by
Hodder Arnold, an imprint of Hodder Education and a member of the Hodder Headline Group,
338 Euston Road, London NW1 3BH
Distributed in the United States of America by
Oxford University Press Inc.,
198 Madison Avenue, New York, NY10016
Oxford is a registered trademark of Oxford University Press
© 2006 Edward Arnold (Publishers) Ltd
All rights reserved. Apart from any use permitted under UK copyright law,
this publication may only be reproduced, stored or transmitted, in any form,
or by any means with prior permission in writing of the publishers or in the
case of reprographic production in accordance with the terms of licences
issued by the Copyright Licensing Agency. In the United Kingdom such
licences are issued by the Copyright Licensing Agency: 90 Tottenham Court
Road, London W1T 4LP.
Whilst the advice and information in this book are believed to be true and
accurate at the date of going to press, neither the author[s] nor the publisher
can accept any legal responsibility or liability for any errors or omissions
that may be made. In particular, (but without limiting the generality of the
preceding disclaimer) every effort has been made to check drug dosages;
however it is still possible that errors have been missed. Furthermore,
dosage schedules are constantly being revised and new side-effects
recognized. For these reasons the reader is strongly urged to consult the
drug companies’ printed instructions before administering any of the drugs
recommended in this book.
British Library Cataloguing in Publication Data
A catalogue record for this book is available from the British Library
Library of Congress Cataloging-in-Publication Data
A catalog record for this book is available from the Library of Congress
ISBN-10 0340 92554 X
ISBN-13 978 0340 92554 6
1 2 3 4 5 6 7 8 9 10
Commissioning Editor: Christina De Bono
Project Editor:
Clare Weber, Jane Tod
Production Controller: Lindsay Smith
Cover Design:
Amina Dudhia
Indexer:
Jane Gilbert, Indexing Specialists (UK) Ltd
Typeset in 10/12pt Adobe Garamond/Akzidenz GroteskBE by Servis Filmsetting Ltd, Manchester
Printed and bound in Spain
Hodder Headline’s policy is to use papers that are natural, renewable and recyclable
products and made from wood grown in sustainable forests. The logging and manufacturing processes are
expected to conform to the environmental regulations of the country of origin.
What do you think about this book? Or any other Hodder Arnold title?
Please visit our website at www.hoddereducation.com
CONTENTS
PREFACE
vi
ABBREVIATIONS
vii
PART 1
EPIDEMIOLOGY
SECTION 1
STUDYING HEALTH AND DISEASE IN POPULATIONS
SECTION 2
OBSERVATIONAL STUDIES: ECOLOGICAL STUDIES
11
SECTION 3
OBSERVATIONAL STUDIES: CROSS-SECTIONAL STUDIES
17
SECTION 4
OBSERVATIONAL STUDIES: CASE–CONTROL STUDIES
25
SECTION 5
OBSERVATIONAL STUDIES: COHORT STUDIES
33
SECTION 6
INTERVENTION STUDIES: RANDOMIZED CONTROLLED TRIALS
43
SECTION 7
META-ANALYSIS
51
SECTION 8
CLINICAL EPIDEMIOLOGY
59
PART 2
STATISTICAL TOOLKIT
SECTION 9
DESCRIBING DATA
73
SECTION 10
ESTIMATION
83
SECTION 11
HYPOTHESIS TESTING
91
SECTION 12
INTERPRETATION OF DATA
99
SECTION 13
SOURCES OF ERROR
3
111
APPENDIX
119
INDEX
127
PREFACE
From the Series Editor, Elliott Smock
Are you ready to face your looming exams? If you
have done loads of work, then congratulations; we
hope this opportunity to practise SAQs, EMQs,
MCQs and Problem-based Questions on every part
of the core curriculum will help you consolidate what
you’ve learnt and improve your exam technique. If
you don’t feel ready, don’t panic – the One Stop Doc
series has all the answers you need to catch up and
pass.
There are only a limited number of questions an
examiner can throw at a beleaguered student and this
text can turn that to your advantage. By getting
straight into the heart of the core questions that come
up year after year and by giving you the model
answers you need, this book will arm you with the
knowledge to succeed in your exams. Broken down
into logical sections, you can learn all the important
facts you need to pass without having to wade
through tons of different textbooks when you simply
don’t have the time. All questions presented here are
‘core’; those of the highest importance have been
highlighted to allow even sharper focus if time for
revision is running out. In addition, to allow you to
organize your revision efficiently, questions have been
grouped by topic, with answers supported by detailed
integrated explanations.
On behalf of all the One Stop Doc authors I wish
you the very best of luck in your exams and hope
these books serve you well!
From the Authors, Emily Ferenczi and
Nina Muirhead
In our first year of medical school, we remember
groaning at the thought of having a statistics lecture.
It all seemed so irrelevant and abstract at the time.
However, after several years of essays, critical reviews
and projects, we have come to appreciate the value of
statistics. So much so in fact, that we were inspired to
write a book about it! In the hospital, hearing doctors
talk to patients about the evidence they have for offering one particular treatment over another, we realised
that ‘evidence-based medicine’ is not just a fantasy,
but a real and important aspect of the way we should
approach medical practice throughout our careers.
In this book, we have used examples from recent
medical literature to provide both inspiration and
practical examples of the way statistics and epidemiological methods are used in clinical studies to guide
clinical practice. The aim of this book is to equip
medical students with an understanding and a tool
guide for reading and reviewing clinical studies so
that, as practising doctors, they can arrive at valid conclusions and make justifiable clinical decisions based
upon the available evidence. It also aims to provide a
basis by which a medical student or junior doctor can
learn about starting a clinical study and how to access
the information and resources that they need.
We have chosen published studies to illustrate important epidemiological and statistical concepts. Please
bear in mind that the studies are chosen on the basis
of their ability to demonstrate key issues that arise
when analysing different study designs, not necessarily on the basis of their quality.
We would like to thank Adrian Smith for his very
helpful comments on the draft document.
ABBREVIATIONS
ANOVA
BMI
CFTR
CI
df
FEV1
FN
FP
F/T PSA
GP
H0
H1
HbA1c
HIV
MHRA
analysis of variance
body mass index
cystic fibrosis transmembrane
conductance regulator
confidence interval
degrees of freedom
forced expiratory volume
false negative
false positive
free-to-total prostate-specific antigen
general practitioner
null hypothesis
alternative hypothesis
haemoglobin A1c
human immunodeficiency virus
Medicines and Healthcare products
Regulatory Agency
MI
MMR
NHS
NNT
NPV
OR
PPV
PSA
RSI
SD
SE
SEM
SE(p)
SSRI
TN
TP
myocardial infarction
measles, mumps and rubella
National Health Service
numbers needed to treat
negative predictive value
odds ratio
positive predictive value
prostate-specific antigen
repetitive strain injury
standard deviation
standard error
standard error of the mean
standard error of the proportion
selective serotonin reuptake inhibitor
true negative
true positive
This page intentionally left blank
PART
1
EPIDEMIOLOGY
This page intentionally left blank
SECTION
1
STUDYING HEALTH AND
DISEASE IN POPULATIONS
• PRINCIPLES OF EPIDEMIOLOGY
4
• MEASURING DISEASE
6
• MEASURING ASSOCIATIONS
8
SECTION
1
STUDYING HEALTH AND
DISEASE IN POPULATIONS
1. What is the definition of epidemiology and what are its uses?
2. What is meant by the following terms and how do they differ from each other?
a. The distribution of disease
b. The determinants of disease
3. Which type of information would provide you with an idea of the distribution of the
disease in developing versus developed countries?
a.
b.
c.
d.
e.
A case–control study
A randomized controlled trial
The National Infant Mortality Register
The National Cancer Register
An ecological study into the correlation between infectious disease rate and population
density
4. Which type of information would help you to understand the determinants of breast
cancer?
a. A case–control study investigating the correlation between use of hormonal
contraception and the risk of breast cancer
b. The National Cancer Register
c. A cohort study into the incidence of breast cancer in two groups of women: in one
group, all the women have a family history of breast cancer, in the second group, there
is no family history
d. An ecological study comparing the rates of breast cancer in the UK and in France
e. A randomized controlled trial investigating the efficacy of a new drug treatment for
breast cancer
5. Identify the numerators and denominators in the following scenarios
a. In a school of 670 children, 380 eat lunch in the canteen, 8 children have been
identified as having gastroenteritis as a result of one of the canteen’s chicken dishes
b. A country has a population of 20 million people. Of these, 10 million live in highly
polluted cities. 450 000 have been diagnosed with pollution-induced asthma
c. A study wants to investigate the association between smoking and infertility using data
on couples. There are 340 couples enrolled in a fertility clinic; 120 couples are defined
as smokers (one or both partners smoke)
Studying health and disease in populations
5
EXPLANATION: PRINCIPLES OF EPIDEMIOLOGY
Epidemiology is the quantitative study of the distribution and determinants of health and disease in a population (1).
Analytic epidemiological studies typically involve four components: the definition of disease and identification
of the ‘at risk’ population; the measurement of disease; the measurement of exposure and the examination of
the association between disease and exposure.
Understanding of the distribution and determinants of health problems in populations can help direct public
health strategies, for the prevention and treatment of disease, to improve the health of a population. It can
ensure that money is spent in the right way on the people who are at risk (1).
Any epidemiological parameter requires two numbers: a numerator, such as the number of individuals who
have been defined as having a disease and a denominator, the defined population from which these individuals have been taken. Information on both the numerator and the denominator is crucial in epidemiology.
To illustrate: ‘10 people have been diagnosed with skin cancer in one month’ – this figure is meaningless if one
does not know from what size population these 10 people have been identified. A population of only 20 individuals may raise more concern than a population of 20 million individuals.
Different populations and subgroups of populations are affected by different health problems to different
extents. Information about the distribution of health problems can be obtained through routinely collected
data such as censuses and registers for death and disease, and through cross-sectional prevalence surveys (2a).
Establishing the determinants of health and disease is based upon identifying the association between an
individual’s exposure to specific risk or protective factors and the subsequent health outcome for that individual (2b). Ecological studies investigate exposure and disease at the level of population groups, rather than at
the level of the individual. Studies that record exposure and disease status of individuals within a population
include:
• Cross-sectional studies, which measure disease exposure
• Case–control studies
• Cohort studies.
Epidemiological evidence provides an idea of the extent and burden of health problems in a population, and
thus can be used to direct public health strategies and treatment programmes aimed at improving health and
reducing disease. Studies that investigate the effects of an intervention on health status include randomized
controlled clinical trials of individual communities.
Answers
1.
2.
3.
4.
See explanation
See explanation
F F T T T
T F T T F
5. a – Numerator: 8 cases, denominator: 380 children at risk from canteen
food, b – Numerator: 450 000 cases, denominator: 10 million in ‘at risk’
population, c – Numerator: 120 couples who are smokers (cases), denominator: 340 infertile couples
(population of interest)
ONE STOP DOC
6
6. Define prevalence and incidence
7. Calculate the prevalence of
a. Smoking in medical students: sample of 170 medical students, 38 smokers, 132 nonsmokers
b. Repetitive strain injury in secretaries: 340 secretaries, 65 with repetitive strain injury
8. Calculate the annual incidence of
a. Work-related injuries in a car factory: 680 workers, four injuries per month
b. Leukaemias in primary school children in a town near a nuclear energy plant, town
population: 32 000; number of primary school children: 5800; number of leukaemia
cases reported per year: 46
9. Calculate the age-specific mortality rate for the over-65-year age group in England: midyear population for over 65 years is 9.2 million of which 30 914 died in one year
10. The prevalence of a disease
a.
b.
c.
d.
e.
Can only be calculated by a cohort study
Is the number of new cases per unit time in a defined population
Describes the balance between incidence, mortality and recovery
Can be standardized for age and sex
Can be used to compare the burden of a disease across different geographical areas
NHS, National Health Service; RSI, repetitive strain injury
Studying health and disease in populations
7
EXPLANATION: MEASURING DISEASE
Disease occurrence can be measured in different ways and using different sources. One example is that of routinely collected data, i.e. data collected not for the specific purpose of conducting an epidemiological study,
which can give estimates of the prevalence and incidence of a disease in a population.
1. Denominator data (defining ‘at risk’ populations): census
2. Numerator data (defining cases) – falls into several categories:
• Mortality: e.g. death registers and certificates
• Morbidity: e.g. NHS contact or disease registers
• Wider impact: e.g. cost to the NHS or days missed from work for health reasons.
3. Prevalence is the number of cases in a population at a single point in time divided by the total number of
individuals in that population at the same point in time (6). Prevalence is often expressed as a percentage (%)
but for rarer diseases it can be expressed in larger population units such as per 1000 population or per 10 000
population.
The prevalence of disease at any time is determined by the incidence of new disease, the duration of the disease
and changes in the population at risk, e.g. births and deaths. Prevalence measures the overall disease burden
in a population at a particular point in time.
4. Incidence measures the number of new cases occurring in a defined time period divided by the number in
the population at risk of becoming a case (6). To estimate incidence, one needs:
• A defined population at risk of an event
• A defined time period
• The number of events occurring in that period.
Incidence is often considered by epidemiologists to be the most informative measure of disease occurence. It
is expressed as the number of events per 1000 or per 100 000 population. For example, it is easier to think in
terms of 12 deaths per 1000 than 0.012 deaths per person. The denominator for incidence can be refined and
measured using ‘person-time’, e.g. person-years at risk, and this measure is often called the ‘incidence rate’.
Answers
6. See explanation
7. a – 38/170; 22 per cent; 22 smokers per 100 students, b – 65/340; 19 per cent; 19 per 100 secretaries get RSI
8. a – Injuries per year = 4 × 12 = 48; 48/680 = 0.07; 7 injuries per 100 workers per year, b – 46 cases per year/5800 primary school
children = 0.0079; 79 leukaemia cases per 10 000 primary school children per year
9. 30 914/9 200 000 = 0.0034; 34 deaths per 10 000 population per year in the over-65-year age group
10. F F T T T
ONE STOP DOC
8
11. Which of the study designs are being described in the examples?
Options
A. Cohort study
B. Meta-analysis
C. Case–control study
D. Ecological study
E. Randomized controlled trial
F. Cross-sectional study
1. A group of Gulf War veterans is followed over the course of 10 years to determine the
association between the exposure to life-threatening experiences and the risk of
psychiatric disturbance
2. The prevalence of HIV is compared in two African countries, one with a national ‘safesex’ education programme in place and the other with no such programme
3. A group of patients with liver disease is questioned on its daily consumption of alcohol
over the past year. Consumption rates are compared to those of a group of patients in
the same hospital but without liver disease
4. Thirty women with breast cancer are given a new drug treatment and 30 similar women
are given an existing treatment. Neither the doctors involved in the care of the women
nor the women themselves are aware of which treatment they are taking. The women are
followed over a period of five years and at the end the five-year survival rates for the two
groups of women are calculated and compared
5. The prevalence of leukaemia in children living near power lines is compared with the
prevalence in children living far away from power lines
6. All the existing evidence for the effectiveness of a new laparoscopic technique for
resection of large bowel tumours from multiple different studies is collected together
12. Match the study designs below to the following scenarios (each option can be used
once, more than once or not at all)
Options
A. Cohort study
B. Meta-analysis
1.
2.
3.
4.
5.
C. Case–control study
D. Ecological study
A rare disease
A rare risk factor
More than one outcome
Multiple risk factors
The temporal relationship between a
risk factor and a disease
HIV, human immunodeficiency virus
E. Randomized controlled trial
F. Cross-sectional study
6. To prove the effect of a new drug for asthma
7. To test the hypothesis that hypertension is a
risk factor for cardiovascular disease
8. When time and money are limited
Studying health and disease in populations
9
EXPLANATION: MEASURING ASSOCIATIONS
Special studies are used to assess the effects of exposure to particular risk or protective factors on a particular
health outcome, such as a disease of interest.
The choice of a particular study design may depend upon a number of factors such as the prevalence of the
condition of interest, the frequency of the exposure of interest or the amount of time and money available.
The table below summarizes the key characteristics, uses and disadvantages of the main types of epidemiological study.
Approach
Category
Type
Timing
Uses
Problems
Observational
Ecological study
Study of groups
or populations
using routinely
collected data
Usually
retrospective
Data on
distribution of
disease across
population groups
No data about
individuals
Observational
Cross-sectional
study
Special health
survey of
individuals
One point in time
To measure
prevalence
No incidence
Observational
Case–control
study
Longitudinal
study of
individuals
Retrospective
For common
exposure and rare
outcome
Recall and
selection bias
Observational
Cohort study
Longitudinal
study of
individuals
Prospective or
retrospective
(historical data)
Quick and cheap
No proof of temporal relationship
For rare
exposures
Large sample
sizes needed
Demonstrates a
temporal
relationship
Time consuming
Can measure
incidence
Intervention
Overview
Randomized
controlled trial
Meta-analysis
Clinical trial
Statistical review
of numerical
results of other
studies
Answers
11. 1 – A, 2 – D, 3 – C, 4 – E, 5 – F, 6 – B
12. 1 – C, 2 – A, 3 – A, 4 – C, 5 – AE, 6 – BE, 7 – A, 8 – BDF
Prospective
Retrospective
Gold standard for
proving effect of
an intervention
Summarizes all
relevant research
Expensive
Time consuming
Hard to include
all published and
unpublished data
This page intentionally left blank
SECTION
2
OBSERVATIONAL STUDIES:
ECOLOGICAL STUDIES
• ECOLOGICAL STUDIES
• ADVANTAGES AND DISADVANTAGES OF
ECOLOGICAL STUDIES
12, 16
14
SECTION
2
OBSERVATIONAL STUDIES:
ECOLOGICAL STUDIES
Seagroatt V. MMR vaccine and Crohn’s disease: ecological study of hospital admissions in England,
1991 to 2002. BMJ 2005;330:1120–1121 (extracts and figures reproduced with permission from BMJ
Publishing Group).
INTRODUCTION
‘It has been hypothesised that the measles, mumps, and rubella vaccine (MMR vaccine)
increases the risk of autism and Crohn’s disease. Although a possible link with autism has been
extensively studied and refuted, a link with Crohn’s disease has not. I tested this hypothesis by
analysing trends in age specific admission rates for Crohn’s disease in children and
adolescents to determine if the introduction of MMR vaccine in 1988 increased rates in those
populations that were offered the vaccine as infants.’
1. What is the question being investigated by this study?
2. What type of comparison is being performed?
3. What types of data are being used to answer the question?
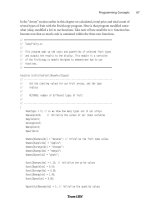
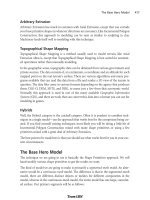
‘Age specific rates per 10 000 population per year for emergency hospital admissions for
Crohn’s disease in England, 1991 to 2002. Rates in children aged < 4 years were relatively
low and so were excluded from the figure. Three-year
1.4
16–18 years
groups, rather than the more conventional five-year groups,
1.2
13–15 years
were used in order to discriminate between rates in children
1.0
0.8
born before and after the introduction of MMR.’
10–12 years
0.6
‘There were 4463 admissions for Crohn’s disease, 923 of
0.4
7–9 years
which occurred in populations with a vaccination rate of
0.2
≥ 84 per cent (those born in 1988–89 or later). Although
0
4–6 years
the age specific rates increased over the study period, no
obvious changes occurred that coincided with the
Year of admission
introduction of MMR vaccine. The estimated rate ratio for
Too old to be offered
the MMR vaccination programme (rates in populations with
vaccine as infants
a vaccination rate of ≥ 84 per cent compared with those
Some would have been
offered vaccine as infants
with a rate of ≤ 7 per cent) was 0.95 (95 per cent
All would have been offered
vaccine as infants
confidence interval 0.84 to 1.08).’
19
91
–
19 2
92
–
19 3
93
–
19 4
94
–
19 5
95
–
19 6
96
–
19 7
97
–
19 8
19 98–
99 9
–2
00
20 0
00
–
20 1
01
–
20 2
02
–3
Rates per 10 000 population
RESULTS
4. What can we infer from the rate ratio and the confidence interval?
5. What potential confounding factors may influence the results?
MMR, measles, mumps and rubella
Observational studies: ecological studies
13
EXPLANATION: ECOLOGICAL STUDIES
In an ecological study the units of observation are populations or groups of people, rather than individuals.
For example, an individual does not have a life expectancy or an income distribution, but a population of a
city, state or country does. Ecological studies allow statements to be made about the populations being compared. While they may suggest associations between a disease and exposure, these usually require confirmation
from studies involving individuals.
For data collection, disease rates and exposure are measured in each of a series of populations and their relationship is analysed. Ecological studies often use routinely collected aggregate statistics, usually published for
other purposes, such as mortality rates or hospital admissions rates.
Populations can be compared in a variety of different ways:
• Geographical comparison: comparison of disease rates and prevalence of risk factors in different geographical areas
• Temporal comparison: ecological studies can be used to analyse trends in disease patterns over time by
taking routinely collected statistics from the same population group over successive time intervals
• Migrant studies: the study of migrant populations helps to disentangle the influence of genetics and environmental exposures in determining disease processes. It can also help to establish the age at which environmental influences exert their effect. For example, studies looking at multiple sclerosis prevalence in
migrant populations have shown that populations from places close to the equator maintain their low prevalence rates when they migrate to higher latitudes. However the offspring of the migrants adopt the high
prevalence rates associated with the higher latitude location
• Occupation and socio-economic group: statistics on exposure and disease are widely available for specific
groups in society. For example, occupational risk factors, such as the stress associated with working in the
medical profession can be correlated with morbidity statistics such as rates of alcoholism in doctors.
The question being asked in the example study (page 12) is: ‘Is there an association between the rate of Crohn’s
disease in children and the introduction of the MMR vaccine in 1988?’ The study is a temporal comparison
(1,2). The data used in the study come from two sources of population-level data (3):
1. Routinely collected statistics for the age-specific rates of emergency hospital admissions for Crohn’s disease
for children under the age of 18 years from April 1991 to March 2003
2. Percentages of children completing a primary course of MMR vaccine in their second year of life (in the
first two years of the MMR vaccination programme, these were 7 per cent and 68 per cent; thereafter they
were at least 84 per cent).
Continued on page 16
Answers
1.
2.
3.
4.
5.
See explanation
See explanation
See explanation
See explanation (page 16)
See explanation (page 16)
ONE STOP DOC
14
6. Which one of the following definitions best describes the ‘ecological fallacy’?
a. The weakness of ecological studies compared to case–control or cohort studies
b. The mistaken interpretation of a study as ecological when really it is a cross-sectional
study
c. An association found in an ecological study does not exist at the individual level
7. What are the advantages of an ecological study?
a.
b.
c.
d.
It can be used to study associations at the individual level
It can study large and very different population groups
It does not rely on existing published statistics which may contain errors
It uses aggregate data on exposure and disease in population groups, increasing the
power of the study
e. It helps to formulate hypotheses on aetiological factors in disease
f. It is easy to minimize confounding factors
8. What are the disadvantages of an ecological study?
a.
b.
c.
d.
It cannot make inferences about individuals
There is a risk of the ecological fallacy
It is costly and time consuming to conduct
It is less reliable than a case–control study that lacks within-population exposure
variability
e. It cannot compare populations that have very different characteristics
Observational studies: ecological studies
15
EXPLANATION: ADVANTAGES AND DISADVANTAGES OF ECOLOGICAL STUDIES
Advantages of an ecological study are:
• It is quick, simple and cheap to conduct due to the availability of routinely collected data that have already
been published
• It has more power than individual-level studies, such as case–control and cohort studies where there is
less exposure variability
• Data can be used to compare populations with widely differing characteristics, for example the Chinese
and the Americans
• It provides a useful starting point for more detailed epidemiological work by helping to formulate
hypotheses about the aetiology of disease.
Disadvantages are:
• The risk of the ‘ecological fallacy’. This is when inappropriate conclusions are drawn on the basis of ecological data. An association seen at the group level does not necessarily represent an association at the individual level, therefore an ecological study cannot make inferences about individual level associations
• Inability to control potential confounding factors other than age and sex. For example, in geographical comparisons, although it may be possible to adjust for age and sex, data for other potential confounders,
such as dietary or cultural habits, may not be available. In temporal studies, changes in diagnostic or treatment techniques may influence disease statistics over time. In migration studies, factors associated with the
act of migration itself, such as psychological stress, may influence disease processes, confounding the influence of new environmental risk factors. In occupational studies, socio-economic factors may confound the
results and vice versa
• Reliance upon existing published statistics may limit the breadth and type of studies conducted.
Answers
6. F F T
7. F T F T T F
8. T T F F F
16
ONE STOP DOC
EXPLANATION: ECOLOGICAL STUDIES Cont’d from page 13
The analysis of data from ecological studies depends upon the mode of comparison being used, for example
in geographical studies, associations between disease occurrence and exposure are often presented graphically
in the form of scatter plots (see page 75). For temporal comparisons, trends may also be displayed graphically,
and correlation coefficients (see page 107) or rate ratios with confidence intervals (as in the example study
on page 12 and also see page 89) may be calculated.
A rate ratio of 0.95 suggests that the rate of emergency Crohn’s admissions in children born after the introduction of the MMR vaccine (population group with ≥ 84 per cent vaccinated) is almost the same as the rate
in the group born before the vaccine was introduced (≤ 7 per cent vaccinated). The narrow confidence interval (which includes the value of 1) indicates that the rate ratio estimate is precise: we can be 95 per cent certain
that the true rate ratio being estimated lies in the range 0.84 to 1.08 (4).
Potential confounders (see page 117) could include changes in dietary habit, new medical treatments or
another immunological-type factor with a protective effect against Crohn’s disease in order to counteract an
added risk from the MMR (5). However, quoting from the example study: ‘. . . some factor(s) would have to
be negatively associated with Crohn’s disease, be introduced over the same three-year period, and be targeted
at the same population of infants as MMR vaccine to mask a true association. This seems highly unlikely.’
MMR, measles, mumps and rubella.