CFA Institute Research Challenge
Bạn đang xem bản rút gọn của tài liệu. Xem và tải ngay bản đầy đủ của tài liệu tại đây (690.69 KB, 28 trang )
Team 06 Student research
This report is published for educational purposes
only by students competing in the CFA Institute
Research Challenge
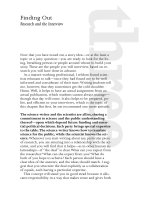
MARKET DATA (VND)
Price (11/19/2012)
52-week high
52-week low
YTD change
YTD %change
Shares outstanding (mn)
Market capitalization (bn)
65,500
74,900
52,300
8,200
14.6%
6 5.4
4,281.5
CFA Institute Research Challenge
Hosted by
Local Challenge (Vietnam)
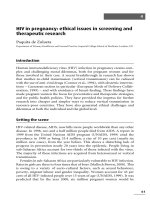
PERFORMANCE
Team06
HAU GIANG PHARMACEUTICAL JSC.
KEY FINANCIAL DATA
(FY12E)
Per share data
Earnings per share
Cash flow per share
Financial position
Debt/Equity
Profitability
ROE
Price, Nov 19 2012
ROA
Upside
EBITDA margin
Market data
Forward P/E
Forward EV/EBITDA
VIETNAM MARKET LEADER IN PHARMACEUTICAL
VND7,701
VND8,905
2.9%
ADD
Price target VND78,500
27.8%
VND65,500
22.2%20%
23.1%
8.8x
5.7x
DATE: NOV 23, 2012
PHARMACEUTICALS
TICKER BLOOMBERG: DHG_VN
HO CHI MINH STOCK
EXCHANGE
Highlights
We initiate ADD rating for DHG for the end-of-year 2012. Based on DCF and multiples valuation.
Our target price is VND78,500 with an upside potential of 20 percent from current stock price.
Highest revenue gained among domestic competitors: Revenue increased by 22 percent in 2011,
arrived at VND2,490bn. For the year 2012-2013, revenue is estimated to grow at 8 percent per
annum. During the high growth stage of 2014-2017, CAGR is 17.1 percent.
Prime position thanks to economies-of-scale and long experience: DHG accounts for 5.1 percent
of the total market, 9.8 percent among domestic companies. In addition, the company is on the top
five leading pharmaceutical manufacturers.
Functional foods - long-term strategy of DHG: The two functional foods, Spivital and Naturenz,
have the highest growth rates among 11 main brands (75 percent and 52 percent respectively). This
business line is expected to expand further and become the strategic sector of the company.
Wide distribution network - key driver of success: DHG owns a valuable asset to help surpassing
competitors. Its branches are available all over the country, cover in 98 percent of state general
hospitals.
Debt-free balance sheet: DHG reduces financial risks by holding a low equity multiplier with no
long-term debt. Debt ratio stayed at one percent mostly assisting for cash needed in operation cycle.
A strong cash fund also supports the company’s liabilities.
Increasing manufacturing capacity owing to new plant accomplishment:
The construction of the new plant in Tan Phu Thanh industrial park will be
finished in 2013. After then output will increase successively and is expected to
double by the year of 2017.
Main risks to our target price are failure to gain back market share due to the
increase in the level of competition in current market and the excess of supply
over demand. Other risks come from not being able to meet the planned
capacity, volatility in exchange rates, and a stronger than expected increase in
materials. In addition, 43.4 percent of DHG’s equity belongs to the government
while individual shareholders account for only 2.2 percent. Investors should be
aware of certain risks such as low liquidity and small floating.
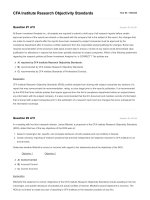
Forecast summary
Table 1:
Net sales
Unit: VNDbn
2011
3Q2012
2012E
2013F
2,491
2,025
2,700
2,909
17.2%
8%
8%
485
671
20.8%
%YoY
EBITDA
517
%YoY
Net income
%YoY
EPS
(VND)
%YoY
416
6,375
2014F
2015F
2016F
2017F
3,408
4,072
4,763
5,478
17%
20%
17%
15%
744
861
1,003
1,155
1,309
30%
11%
16%
17%
15%
13%
359
503
539
594
700
826
949
15.3%
21%
7%
10%
18%
18%
15%
5,494
7,701
8,238
9,086
10,713
12,635
14,521
15.3%
21%
7%
10%
18%
18%
15%
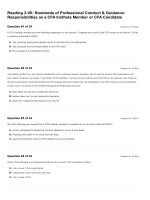
Figure 1: Price system
Source: Team’s estimateInvestment
VND 89,500
Relative P/E
VND 85,500
FCFE
VND 78,500
Target price
VND 63,500
EV/EBITDA Multiple
Relative P/B
summary
We initiate coverage of DHG with an ADD rating and a target price of
VND78,500, offering a 20 percentage-point upside from its current stock price.
DHG is currently the key player in Vietnam Pharmaceutical market with a
CAGR of 18 percent during the last five years. There was a decrease of five
percentage points in gross profit margin from 2010 (50.1 percent) to 2011 (48.5
percent) due to the impact of material cost. However, we forecast profit margin
will rise again after 2013thanks to economies of scale of Tan Phu Thanh new
plant and the efficient distribution network.
Demographic factors in Vietnam such as population, urbanization and awareness
to improve living standard, etc. have recently changed. It spurs DHG’s
expansion to meet the surging demand in the future. Although pharmaceuticals
are still dominant at 87.7 percent, functional food segment is expected to bring
more and more profit and its proportion will go up to 16 percent in 2017.
The new factory will start operating in Q2/2013 and reach full capacity in 2020
once the production will be double. Sales are estimated to grow at the rate of 15
percent of CAGR over the next five years. Consequently, CFO will also
increase. DHG is expected to obtain EBITDA CAGR of 14.3 percent and EPS
CAGR of 13.5 percent during period of 2012-2017.
Our target price of VND78,500 is based on the FCFE and multiple analysis. Our
FCFE model covers high growth stage and second stage value plus the terminal
value of company. After 2020, new company reach full capacity, terminal value
is based on EV/EBITDA. We use the average of current EV/EBITDA ratio of 14
peer companies, which have a similar market capitalization. DHG forecasted
EBITDA to derive enterprise value at the end of 2020. In our multiple analysis,
the average multiple price is adopted to be DHG share price. Weighs for FCFE
and multiple analysis are 0.5 and 0.5 respectively.
We rate DHG stock Medium risk. Main risks related to the fluctuation of
material price and exchange rate as well as the price control of the government
could affect directly to the DHG’s operating margin.
Figure 2: DHG noble titles
Business description
Forbes Asia 200 Best Under A Million 2011
First – class Labor Medal by State President
DHG Pharma - For a more beautiful and healthier life!
Second – class Independence Medal by State President
DHG Pharma is one of the five leading manufacturers (by value) of Vietnam
Special awards for Annual Report in three successive years
pharmaceutical market.DHG has the highest revenue (VND2,490bn in 2011)
Prestigious stock in Vietnam Stock Market in 2010 (04 successive years)
among domestic competitors, accounting for 5.1 percent of the total Vietnamese
“Vietnam high quality product”
(16 successive years).
pharmaceutical market and 9.8 percent among domestic companies. The total
revenue in the first three quarters of 2012 is VND2,025bn, or equivalent to 73.6
percent of this year target. Its success relies on the expansive distribution
network. It is primarily engaged in producing generic drugs like antibiotics
(contributing 43.1 percent to the company’s 2011 revenue), functional food such
as vitamins and cosmetics. The company was honored in Top 200 Performing
Figure 3:
Small and Medium Enterprises (SMEs) in the Asia-Pacific region by Forbes
Magazine in 2011.
Figure
4: Pharmerging
markets
definition
GMP:
Good manufacturing
Practice
GLP: Good Laboratory Practice
GSP: Good Storage Practice
Emerging markets targeted by pharmaceutical companies.
Pharmerging = [Pharm(aceutical) + (e)merging]
(Source: Schott’s Vocab)
Figure 5: CAGR of total health expenditure per
capita 2000-2010
Pharmerging Countries Developed Countries
Source: WHO
Established in 1974, DHG was formerly a state-owned enterprise. DHG
Pharmaceutical Joint-stock Company was officially operated in 2004 with the
initial charter capital of VND80bn. Company held its Initial Public Offering
(IPO) in December 2006. DHG has a modern and integrated factory system
meeting WHO-GMP/GLP/GSP standards with the total production capacity of
4.1 billion units in 2011.
The new factory under construction in Tan Phu Thanh Industrial Park will start
operating in 2013. It is expected to double the company’s capacity in 2017,
helping DHG meet the increasing domestic pharmaceutical demand. DHG is also
boosting production of functional food, which is planned to contribute 15
percent of total DHG's revenues in 2017.
Industry overview and competitive positioning
Solid foundation for further growth
In 2011, the total value of Vietnam pharmaceutical market reached USD2.4bn,
ranked as Third Tier: “Fast Followers”, which have good opportunities for
growth. According to IMS Health, CAGR of the Vietnam pharmaceutical
industry will be 16.5 percent for the period of 2012-2015 and the market value is
estimated to reach USD3.5bn in 2015.
Strong boost from swelling demand
Being essential goods, demand for pharmaceutical products is inelastic. As a
result, expenditure on healthcare is not affected much by the fluctuation of
economic factors. Furthermore, demand for pharmaceuticals is growing rapidly,
fueled by demographic changes, expanding economies, and government
initiatives. In 2010, Vietnam total healthcare expenses per capita were USD83,
four fold increasing compared to USD21 in 2000.
As an emerging economy, Vietnamese people's healthcare expenditure is far
behind the numbers of developed countries (Appendix 6). However, while
growth in the major developed markets has continued to slow down from the
beginning of this century, healthcare expenses per capita in Vietnam has been
growing at an impressive rate of 15 percent per year in the same period. This
illustrates the promising prospect of Vietnam's pharmaceutical industry in the
coming years.
Demand climb’s motivation in expanding production
Figure 6: Main imported materials suppliers
To meet increasing pharmaceutical need, the pharmaceutical industry has
boosted total output with a jump by 24 percent from 2010 to 2011. Along with
improving the total output, pharmaceutical companies have also diversified
products porfolio. In recent drugs registration phases, there are now over 2,000
new registered medicines, compared to just 700 in the year 2003. Due to a
considerable amount of capital accumulated through soaring consuming output,
domestic enterprises can concentrate on expanding investment to upgrade
production capacity.
Heavy reliance on imported materials, mainly from China
At present, 80 percent of materials are imported, dropped by ten percent in
2008. China is the largest producer (15 percent of global market share) of
penicillin, cephalexin and its derivatives, which are Active Principle Ingredients
(API) for antibiotics. Antibiotics accounts for 60 percent of Vietnam
pharmaceutical industry’s total revenue. As a result, API’s prices in China have
major influence on Vietnam’s price.
Until now, just few domestic manufacturers have been able to sign long–term
contracts with their suppliers. Moreover, materials account for over 50 percent of
Inner: 2010 Outer: 2011
Source: Vietnam Customs
Figure 7: Number of sales representatives
cost of goods sold (COGS), so gross profit depends significantly on material’s
price.
Complex and unstructured distribution network
The success of distribution system network relies on personal relationships
between medical sales representatives and doctors, hospital directors,
pharmacist, etc. All the domestic companies currently have developed a strong
network of medical sales representatives. Each of them plays an important role
in approaching doctors, hospitals, pharmacies. Sales representative is the key
driver to make a strong distribution network. Counting on well-known
international brands and good product quality, multinational companies can
compete equally to domestic ones.
Strategies of multinational and domestic companies in distribution
(Appendix 7)
Multinational companies rely on advantages of strong brand name and high–tech products that are not produced in Vietnam. They do
Company
of sales
not have to spend muchNumber
on commission
cost for hospitals, doctors, and pharmacies. As a result, the commission cost, mostly
representative
lobbying cost represents only five to six percent of their total revenue in Vietnam.
DHG
700
As all domestic pharmaceutical
manufacturers produce similar kinds of medicines, they have to build strong relationship with
DMC
350
interlocutors
SanofiAventis to persuade hospitals
200 and doctors to prescribe their drugs. Therefore, selling expenses can grow up to 30 percent of the
total revenue.
Zuellig
Pharma
120
Source: Company data
Growing trend in M&A
M&A has been blooming in Vietnamese pharmaceutical industry in recent years
with many remarkable successful deals. This proves that the industry in general
is perceived to be currently performing well and has an inviting prospect.
Table 2: Vietnamese pharmaceutical M&A transaction
Acquirer
Acquiree
Ownership
before M&A
After
M&A
CFR International
SPA(Chile)
Domesco (DMC)
42%
45.9%
VND302,000m
TRAPHACO (Vietnam)
Dak Lak Pharma
0%
24.5%
VND7,930mn
Stada (Germany)
Pymerphaco
23.7%
49%
USD25mn
Fortis HealthCare (India)
Hoan My
Medicine
0%
65%
USD64mn
Table 3: Target market share of domestic
companies
estimate
Government regulation from legal instrument
Price control policy
There
are many loopholes
price control code and its practice, so drug prices are not well-regulated. Since retail
Present
2015 in the pharmaceutical
2020
prices are not allowed to exceed registered prices, some firms initially register at high prices to leave room for increases afterward.
<50%
70%
80%
Consequently, it is difficult for government to administer the exact prices, leading to prices manipulation. Moreover, bidding process
for prescription drugs in hospitals is not transparently controlled, resulting in harsh competition among pharmaceutical companies.
Source: Vietnam Customs
Barriers to multinational corporations
Figure 8: Prescription and OTC sales forecast
Value
Imported drugs have no choice but to go through a local distributor to reach
consumers. Multinational companies are usually present at Vietnam as
representative offices, thus cannot sell directly their products. Nonetheless, these
restrictions have to be gradually lifted in the process of opening the market
according to WTO’s guideline. The government is aiming to raise the proportion
of domestic drugs in total drug expenditure to 80 percent in 2020. However,
unless there are more policies supportive towards domestic companies, it is not
feasible to achieve this figure.
Drugs market forecast to 2015
Prescriptions pass over – the – counter (OTC) medicines
The growth of the prescription medicines market will outpace the OTCs’ one,
mainly due to the influx of expensive patented products from abroad and
increasing demand for sophisticated drugs. Prescription medicines will be worth
USD2.6bn by 2015 with a CAGR of 16.9 percent. In percentage terms,
prescription drugs will account for 74.2 percent of the total market.
Patient expirations help generic companies
Since 2001, more than USD126bn in brand sales all around the world has lost
patent protection. Many of the soon-to-be expired patents belong to drugs for
symptoms such as diabetes, cancers, high blood pressure, etc., which are
common in Vietnam (Appendix 9). In the next five years (2012-2016), an
additional USD96.5bn in brand drugs annual sales is at risk of losing patent
protection to the hands of generics competitors.
Source: DAV
Generics probably continue to dominate Vietnamese market in terms of volume.
The forecasted value is USD1.8bn in 2015, or 6.4 percentage-point increase in
the total market compared with 2010.
Competitive landscape: challenge for domestic
pharmaceutical company
The transference of market share to hands of multinational competitors
Imported drugs take up over 50 percent of the total medicine consumption of the
Vietnamese pharmaceutical market. Foreign brands will maintain their market
position in the coming years, due to rising demand for sophisticated
pharmaceutical products which are studied and manufactured abroad. The EU is
the main partner with 45 percent (USD557mn) of the market, followed by India,
South Korea and ASEAN bloc.
Figure 10: Competitive advantages
In self-manufactured medicines sector, domestic manufacturers are losing their market share due to drawbacks in capital budget,
Comparable
technique, R&D
activities,
capacity, etc. Eight out of ten top pharmaceutical companies in the domestic market are
DHG
DMCmanufacturing
TRA
IMP
company
multinational corporations. The government has planned to have domestic output meet 70 percent of domestic demand by 2015. This
Herbal
plan
seems impractical
as over
a haft of
the market belongs to multinational firms.
medicines
Domestic competitors: diversified competing strategies
Treatment
channel
The rising of foreign competitors has narrowed the competitive territory of
Prescription
domestic ones, forced them to seek for opportunities in various segments.
medicines
Legend: =
lowest,
= highest
Source:
Team’s
estimate•
Figure 11: Imports worldwide 2011
•
Traditional medicines: Domestic manufacturers can exploit domestic
diversified natural resources (more than 4,000 herbal plants) to inflate its
domestic drug-manufacturing sector. With a shift in demand towards herbal
medicines, the market for this segment can be enlarged. There are 80 herbal
drugs manufacturers, among them key players are Traphaco in the Northern
market and OPC in the Southern one. Resemblance in products portfolio and
prices leads to severe competition in this segment.
Generics are typical of pharmaceutical manufacturing in Vietnam. To make
different, domestic companies are penetrating into different market segments.
For instance, Imexpharm targets at treatment channel while Domesco focuses on
prescription drugs. 50 percent of Imexpharm’s total revenue is gained from
treatment channel. A majority of generic products manufactured by domestic
companies are for common diseases treatment. Meanwhile, Domesco’s key
products are sophisticated drugs for diabetes and heart problems (accounting for
30 percent of total revenue).
Research and development: simple and unexploited
Source: EU Economic and Commercial Counselors
Research and Development activities of domestic pharmaceutical companies are
very simple. They just add some ingredients such as excipients (non-active
ingredients) into the formulas to make new medicines. The total spending for
R&D accounts for only six percent of the total revenue in 2011. This proportion
is much less than the average one of the world (12-16 percent).
Due to lack of high technology and interest in R&D, domestic enterprises’
products do not have any differences from the others.
Company analysis
Figure 12: Revenue (VNDbn) and growth rate
The peak position of DHG on its developing path
With over 35 years of experience, DHG is always maintaining its prime position
in top five leading pharmaceutical companies (Appendix 8). However, DHG’s
market share has been gradually lessened in recent years, partly due to
multinational companies’ penetration. While healthcare demand is still on the
rise, DHG’s goods sold ratio dropped from 87 percent in 2006 to 64 percent in
2011. In addition, the company’s revenue growth rate also experienced a 35
percentage-point decrease during the period of 2006-2011. On the other hand,
there is a shift in demand towards functional food and herbal medicines.
Therefore, taking advantage of economies-of-scale, DHG is expanding its
production, especially functional food sector to recover its market share.
Figure 13:
The value chain
Source: Company data
Currently DHG is operating in three bottom phases of the global pharmaceutical
value chain: Formularization, Manufacturing, Marketing and Distribution. Like
many other domestic manufacturers, DHG spends on imported materials instead
of doing research and manufacturing active ingredients itself.
The pharmaceutical value chain
Research
Active
ingredient
Formularization
R&D activities
Imported materials
Manufacturing
Building product lines
Marketing and
distribution
Marketing staff
and distribution network
DHG’s operations
(Particular value chain of Vietnam pharmaceutical industry)
Global pharmaceutical value chain
Source: Jaccar
New plant improves manufacturing capacity
Figure 14: Sales structure of DHG 2011
Currently, DHG has a production capacity of 4.1billion units, with five
workshops, operating at full utilization rate. Since 2009, DHG has to take
inconsistent ways to raise output such as outsourcing or building small factories.
The company needs new plants to take advantage of economies-of-scale and new
technologies to operate more efficient. Since this new plant will double the
output capacity, DHG will have enough production room for growth in the
following years as well as expand its products portfolio. We believe DHG can
take advantage of efficient distribution system to sell out extra produced goods.
After 2013, total revenue will sustain at 17.1 percent of annual growth and reach
VND4,760bn in 2016.
DHG’s business today1
DHG competes in three main lines of business: prescription medications, OTC
medications, materials and exports trading.
1 The “revenue” in this part is revenue from self-manufactured products.
Prescription sales
Source: Company data
DHG’s prescription sales CAGR for the period of 2006-2011 is 21.2 percent.
The main product segment within prescription sales is antibiotics, which are key
drivers of the company, contributing 43.1 percent to its revenue from selfmanufactured products (representing 78.9 percent of prescription sales). Some
popular names for this type of products are Haginat and Klamentin. The
proportion in total revenue of this group is going down from 46.3 percent in
2006 to 43.1 percent in 2011. However, this is offset by increasing contribution
to revenue of other prescription categories such as central nervous system,
cardio-vascular, muscular skeletal and sensory organs.
OTC sales
Figure 15: BCG matrix
DHG’s OTCs growth is estimated at 22.1 percent per annum (2006-2011). Pain
and fever relief medicines still make up a large proportion of the company’s
revenue. However, the number dropped from 17.7 percent in 2006 to 13.8
percent in 2011. In this segment, DHG’s cash cow is Hapacol, which generated
18.8 percent of the total revenue.
High
High
Market growth
Ear, nose and throat medicines (ENT) contribute 16.7 percent of revenue in
2011, generating 31.2 percent more revenue than the previous year. The poor
environment condition is the key factor for the growing sales in this segment. In
2011, Eugica, the rising star of DHG, generated VND183bn, 53 percent higher
than the previous year.
Mar
ket
gro
wth
Low
Low
Market share
High
DHG’s functional food gained VND144bn, contributing 7.1 percent revenue in
2011.This segment is considered the young today but the potential tomorrow, as
standards of living have risen together with people’s awareness of healthcare.
Spivital and Naturenz have grown 75 percent and 52 percent respectively in
sales. Along with Natto Enzym, which has been launched recently, the three
brands are expected to lift up the proportion of revenue of functional food to 15
percent in 2017.
After launched in 2008, cosmetic products have not shown much impression, the
proportion of revenue dropped from 0.42 percent in 2009 to 0.05 percent in
2011.
Exports sales
Cosmetics
Revenue from export of the company reached VND27bn, increased by 27
percent from 2011. However, this only makes up a small proportion of the total
revenue (1.1 percent). DHG has traded with 15 countries and will expand its
foreign market in the next few years.
Distribution system: the key to DHG’s success
Prescription drugs: Tough market
Source: Team’s estimate
Figure 16: Geographical sales in
2011
VND2,491mn
VND776mn
VND1,132mn
This sector accounts for 20 percent of total distribution system. DHG directly
traded with 98 percent of state general hospitals. There are over 100 hospitals
having trusted and used DHG’s products with the turnover of VND355bn,
accounting for 24 percent of general revenue. Having a wide coverage of state
general hospitals system, however, DHG has faced a strong competition from
foreign brands with better quality, diversified products portfolio and strong
commission.
OTC drugs: Strong development by having a good commercial distribution
system
DHG owns a strong distribution network in terms of both sales-point coverage
and control over its channel’s end-retailers. DHG owns the largest sales system
of Vietnamese pharmaceutical industry which presents at 64/64 provinces with
nine subsidiaries, 28 branches and 67 drugstores at hospitals. The nationwide
network, supported by 946 salespersons, has distributed for more than 20,000
customers (with 9,428 loyal customers). The advantage of wide distribution
network helps DHG decrease selling expenses. This exceptional partnership is
the value of DHG and the reason of future growth.
Geographical distribution: Being expanding its network into suburban and
rural areas
The first-tier cities like Hanoi and HCM City are famous for the biggest markets, the strongest demand and the most suitable places
Source: Company data
to launch new products. Although these cities account for only 14 percent of the total population, they record 20 percent of total
drugs sales. The three largest multi-national companies - Sanofi-Aventis, GSK, and Novartis, have a combined market share of over
Table 4: Domestic companies’ distribution
42 percent of this region. Furthermore, some others exclusively concentrate on Hanoi and HCM City.
network
DHG’s management has followed strategies to avoid competing head-on with big pharmacies. The company is expanding their
Distribution
subsidiaries Agency
and distribution
channelsBranch
to new markets such as rural and suburban regions, specifically in the North and in the Central
Subsidiary
network
regions, the Mekong Delta – where consumer revenue contributes 36 percent of the company’s total revenue in 2010. Furthermore,
DHG
54
end
– users in Mekong
Delta12are the low43
– mid income, and they are the target customers of almost DHG products.
IMP
5
0
9
Distribution subsidiaries system: the most important key to company’s
DMC
2
1 Company 8data
success
Source:
Table 5: DHG’s imported material
suppliers
Imported
Material
Application
from
Amoxicillin
Antibiotics
Spain
Cefadroxil
Antibiotics
Spain
Cefalexin
Antibiotics
Spain
ENT-AsthmaAcetylcystein
Italy
Corazy
Lactose
Netherlan
Diabetes
monohydrate
d
CardioMannitol
France
vascular
Sorbitol
Digestive
France
P20/60 P60W
Metformint
Diabetes
Norway
Source: Company data
Figure 17: Ownership structure
DHG has nine distribution subsidiaries, which are almost in Mekong Delta. In
2012, DHG passed the guideline to establish three more distribution subsidiaries:
BT pharma, VL pharma, VLP pharma. This is an efficient strategy to take
advantage of association of significant retails drugstores to make a new
subsidiary. DHG has been spending capital expenditure on buying plants, buying
houses for branches and subsidiaries. As a result, DHG has its own stable
distribution system.
Major imported materials supply from EU and USA
Like other domestic companies, 80 percent of materials are imported. However,
most of DHG’s materials are imported from EU and USA, having higher quality
than China, especially API for antibiotics. DHG uses semi-synthetic penicillin
from EU, which has more resistance to new kinds of bacteria than naturally
penicillin (produced by fermentation) from China. DHG has built wide network
of reliable suppliers to ensure production, signed annual contracts in large
quantity around six months of inventories and up to nine months if the quality is
high. With each kind of material, DHG sets up contracts with three different
suppliers.
Ownership structure
The state remains as the main shareholder
The government, represented by SCIC, is still the major owner of DHG with
43.4 percent of its equity. Only 2.2 percent of the company’s equity currently
belongs to individual shareholders, while there is no more room for foreign
investors. Hence, there are only limited shares of DHG traded freely on the
market, leading to low liquidity, small floating and minor price fluctuation of its
stock. On a related note, investment funds just acquire DHG’s stocks because of
financial purposes, without any intention to enter the management board.
Experienced management with a chairwoman
Source: Company data
Figure 18: Revenue structure
(VNDbn)
Ms. Pham Thi Viet Nga, a very strong and business oriented woman, is currently
the president of DHG, the chairwoman of the Directors Board of Vinh Hao algae
subsidiary. With over 32 years of attachment to and management of DHG, she
has led DHG to become one of the largest enterprises in pharmaceutical industry.
DHG’s revenue in 1988 when she started to take over DHG was just
VND895mn. At the end of the year 2011, DHG had the total assets of
VND1,996bn with nine subsidiaries and 2,629 employees. Moreover, Ms. Nga
can rely on a dedicated and experienced management team who has been with
the company since its inception. The two notable people are two vice-presidents:
Ms. Le Minh Hong and Mr. Le Chanh Dao who have long-term attachment to
DHG for 33 and 23 years respectively. However, as Ms. Nga is on the verge of
retirement, there are many concerns whether a suitable replacement can be
found. On the other hand, we believe that she will stay on top of the company for
at least two to three years.
However, there is no independent director in Board of Directors as well as in
Board of Supervisors. All members of these boards hold shares of DHG with the
total proportion of insiders’ shares of 0.9 percent. This can lead to the imbalance
between benefits of shareholders and the company itself in each business
decision.
Financial analysis
New plant brings a sustainale development for DHG
DHG is the largest domestic pharmaceutical company in Vietnam. The company
is already operating at its maximum capacity amid growing demand. In recent
years, suitable pricing policy has helped to keep its total revenue surging at a
high pace of 19 percent in CAGR. Since this new plant will double the output
capacity, DHG will have enough production room for growth in the following
years as well as expand its products portfolio. After 2013, total revenue annual
growth will remain at 17.1 percent, and reach VND4,760bn in 2016.
Source: Team’s estimate
Figure 18: Capex, FCF, Cash Ratio
Forecast
Figure 19: Capex, FCF, Cash ratio
forecast
Profit margins decrease due to aggressive competition while
material costs escalate
Like other Vietnam companies, DHG depends heavily on imported materials, of
which prices have volatized drastically in recent years. Consequently, cost of
goods sold surged 85 percent in the last four years, a 1.3 time higher than sales
growth. Formerly, the company can prevent negative effects by using pricing
policy; however, the government has tightened it to control inflation. Strong
competition also prevents DHG from raising the price. Net profit margin and
gross margin dropped 4.4 and 4.1 percentage points respectively from 2009.
Despite downward trend, these ratios of DHG are still surpassing its competitors.
We keep a positive outlook for DHG margins due to improvement in economies
of scale with the new factory. Stronger bargaining power with suppliers is also a
driver for lower and stable material cost. Impressive management policy also
helped to lower selling costs from 35 percent of sales to 22.4 percent in 2011.
Furthermore, adapting Enterprise Resource Planning (ERP) system in Q2/2012
will definitely reduce Selling, General and Administrative expenses (SG&A) in
order to sustain net profit margin.
Table 6: Profitability ratios
Cash is king
DHG has it
and Gross margin
2010
2011
3Q2012
2012E
2013F
Industry
50.1%
48.5%
48.9%
49.5%
50.0%
38.9%
EBIT margin
19.7%
18.7%
19.4%
19.6%
20.1%
14.8%
The Capex for the two
Pretax margin
21.3%
19.7%
20.9%
21.7%
21.7%
15.1%
coming years is VND650bn,
Source: Team’s estimate
17.8%
Net profit margin
18.8%
16.7%
16.6%
16.9%
10.3%
whose majority is invested
in the under
construction
plant. in
With VND600bn of cash accumulated, internally generated funds is sufficient to cover this amount.
Figure
20: Finished
goods
inventory
Investment (VNDbn)
in fixed asset made FCF decrease in 2010 and 2011. After 2013, thanks to sales expansion and reduction in Capex,
DHG’s FCF will rise sharply to VND570bn in 2016.
Instead of short-term investment, DHG tends to distribute its cash. As a result,
cash dividend in 2011 went up to VND260bn, three times higher than that in
2010. Combining with VND256bn invested in Capex, they made net cash flow
negative. This does not cause too many harmful effects because DHG has an
abundant cash fund. We forecast the company’s payout ratio will maintain at 25
percent of face value after launching new factory and sales continue to grow.
This is a significant strong point compared to current poor performance of
Vietnamese companies.
Considerable surge of unsold finished goods
DHG may be having troubles with selling its products, as finished goods have
been built up considerably in its storage since 2007. It is unlikely that this
situation is due to seasonal reasons (as reported by the company), as the
increasing trend repeated throughout the quarters. In our calculation, finished
goods compound quarterly growth rate (CQGR) stands at 9.1 percent, two times
faster than 4.1 percent of sales. Consequently, the ratio of goods sold on total
output fell sharply. Unsold finished goods capture the company’s working
capital needed for operating cycle, leading to the possibility of relying on loans
to stay liquid. It also brings about doubts in selling capacity while output will
rise significantly after 2014. According to DHG, there will be 85 percent of total
sales coming from pharmaceuticals. This is a sector with very low comparative
advantages especially after the accession in WTO of Vietnam. We forecast
amount of goods sold on total output will be hard to improve and keep standing
at 65 percent.
Table 7: Goods sold ratio
2007
2008
2009
Source: Company data
Sales output (In million units)
2,631
2,671
2,324
Production output (In million units)
3,019
2,872
2,976
Goods sold ratio
87%
93%
78%
2010
2,381
3,340
71%
2011
2,616
4,073
64%
Debt-free balance sheet
Cash disbursement for new plant will push down current ratio and quick ratio
next year, even lower than overall industry in 2013. Since quick ratio is standing
at only 1.4x, any considerable change in inventory like 2011 will lead to direct
troubles in liquidity of DHG. Net income might be affected by higher financial
cost from bank’s loans which aims to sustain liquidity and compensate for cash
captured in finished products and materials.
DHG reduces financial costs by holding a sound financial structure with no longterm debt. Debt ratio stayed at one percent mostly assisting for cash needed in
operation cycle. This is a great advantage of DHG when interest rate is still very
high in Vietnam. Table 8: Key ratios
2010
Liquidity
Current ratio
Quick ratio
Efficiency
Inventories turnover
Days sales outstanding (days)
Total asset turnover
Cash conversion cycle (days)
Profitability
ROA
ROE
2011
3Q2012
2012E
2013F
3.1x
2.0x
2.7x
1.5x
2.9x
2.1x
2.7x
1.4x
2.5x
1.4x
2.6x
1.4x
3.1x
50
1.2x
140
3.0x
47
1.3x
144
2.6x
45
0.9x
166
2.6x
49
1.2x
162
2.7x
51
1.0x
163
2.9x
63
1.5x
175
22.8%
29.8%
21.8%
30.8%
22.2%
27.8%
19.4%
24.0%
11.2%
16.8%
15.7%
22.3%
Valuation
Table 9: Cost of equity (Appendix
10)
Our valuation is purely based on DHG’s core business, not taking to account for any extra-ordinary earnings from selling one of its
Cost of equity (Two approaches)
cough
medicine brands, Eugica, that may be finalized this year.
Indirect
approach
CostDiscounted-cash
of equity (Indirect) flow approach:
18.4%free cash flow to Equity (FCFE)
CAPM approach
Cost of equity (CAPM)
14.1%
This method is suitable for DHG, since the company has stable capital structure
Average cost of
16.3%
with low debt. Revenue growth is driven by clear uptrend of the industry and
equity
remarkably high growth prospect of DHG. The base price from this model is
Source: Team’s estimate
VND84,493. We estimate this price based on the following assumptions:
In parallel with the increase of medicine expenditure per capita, CAGR of sales
is expected to be 15 percent in the next five years.
Table 10: EV/EBITDA
Indust
2011
High growth stage
This period covers the next five years with high growth rate between 15-20
percent. Expected sales are broken down into three main sectors, including
pharmaceuticals, functional foods, and cosmetics.
Pharmaceuticals sector could enjoy stable growth of 13 percent on average
in the next five years. Despite decreasing proportion, pharmaceuticals still
dominate in terms of volume. However, severe competition with foreign
competitors will lower DHG’s growth rate.
Source: Bloomberg
Table 11: DCF model
characteristics Characteristics
3 Stages
Model
High growth stage
2013 - 2017
Second stage
2018 - 2020
Terminal stage
EV/EBITDA ratio
Source: Team’s estimate
Sales from functional foods are expected to grow dramatically at 36 percent
in 2015. Proportion of functional foods in total revenue of self-manufactured
goods will reach 14.1 percent in 2017.
Cosmetics have shown a sign of downturn recently. We maintain the
proportion of cosmetics at 0.002 percent.
Second stage
We assume that new factory of DHG almost reach full capacity in the period of
2018-2020. The growth rate will slow down and we expect the output will be
double to current one.
Terminal stage
We use EV/EBITDA to calculate the terminal value at the end of 2020 through a
list of worldwide companies that have similar characteristics as DHG. The
present value of DHG terminal EV is estimated to be VND2,125bn.
Stable structure of SG&A
Applying the ERP system helps integrate internal and external management
information across the entire company. This enables DHG to keep its SG&A
expense at an appropriate level.
Decreasing net income due to increasing tax rate
In recent years, DHG is enjoying an incentive tax rate leading to the fact that its
tax expense is just approximately 13 percent of pretax income. This policy is
returning to the normal level after 2013. The new factory continues to enjoy
preferable tax for 15 years. (Appendix 11)
Valuation summary
Table 12: (VNDmn)
High growth
period
2011
2013F
NOPAT
397,335
472,219
503,952
Capex
256,260
300,000
350,000
Non-cash WC
change
161,777
66,255
61,968
FCFF
26,583
190,089
204,790
FCFE
59,063
293,341
232,086
293,341
199,626
PV of FCFE
PV of FCF from
2018 -2020
PV of terminal value of
relative method
Total PV of FCFE
Cash and cash
equivalents
Shares out
Value of equity
per shares (2012)
Table 13: Weighted valuation
2012E
2014F
2015F
2016F
2
555,93
7
120,00
0
147,92
6
412,07
0
509,53
9
376,97
6
652,34
6
100,00
0
198,57
1
485,46
4
590,30
8
375,65
0
769,02
8
100,00
0
205,69
3
605,08
7
736,52
6
403,14
4
8
1,108,814
2,125,206
4,993,066
513,908
65,176,42
9
VND
84,493
Peer valuation
We pick up a list of 14 peers which have the same market capitalization and
products portfolio (Appendix 12). We evaluate DHG’s share price based on
three multiples: EV/EBITDA, P/B and P/E. The price we obtain for DHG is
VND78,500.
Conclusion
Source: Team’s estimate
1
2
7
8
4
Since we concern more about how the market valuates the stock price, the target
price and weight are given in table 14. The weighted target price is VND78,500upside 20 percent. Our recommendation is ADD (Appendix 13).
Risk analysis
Figure 20: Exchange rate fluctuation
Strategic risks
Tougher competition. Full WTO membership will create a severe competition
between DHG and foreign brands, while domestic companies with similar
activities and products have never been minor threats. This may cause severe
reductions in sales and market share. Nonetheless, we believe that DHG can
neutralize these problems, as its signature expansive distribution system cannot
be mimicked by foreign competitors in one day or two, while there is still a
relatively big gap between the brands of DHG and the rest of domestic
companies.
Overstock. The ratio of goods sold on total produced has fallen considerably
from 93 percent in 2008 to 64 percent in 2011. Unsold finished goods are also on
the rise. Meanwhile, the company is constructing a new factory to raise its
capacity. If sales keep lagging behind production output, this can harm DHG’s
expected sales and net income. DHG should do market research carefully to
avoid this problem.
Financial risks
Source: Bloomberg & SBV
Exchange rates volatility. As 80 percent of DHG’s materials are imported,
exchange rates volatility will have a great impact on its COGS. Moreover, the
company’s USD supply is very limited since its export activities are
underdeveloped. According to the company’s calculation, in 2011, an 8 percent
weakening of VND against USD would have taken away VND4.6bn from its net
profit. However, DHG has been hedging this risk by signing contracts to transfer
parts of the risk to its partner banks. In addition, VND’s value has been stable in
2012 due to efforts of the SBV.
Operation risks
Higher input costs. Raw materials, whose prices have been widely volatile in
recent years, weigh for about 55 percent of DHG’s total production and business
costs (Appendix 14). Price of medicines, however, is under strict control of the
government, so it may not be easy to pass the higher input costs to customers.
Nevertheless, given the size of its storage system, the company can keep enough
materials in storage to operate during rough times. DHG also aims to improve
the efficiency of its production procedure to cut unnecessary wastage in
production.
Non-compliant suppliers. Almost all input factors of DHG’s production chain
is from outside suppliers, so a problem in this stage may have negative effects on
the continuity of its activities. DHG has been building up a reliable supplier
network to defend against this risk.
Regulation risk. DHG pharma operates in a highly regulated industry.
Companies have to satisfy mandatory requirements about Good Practice
standards, as well as price control policies.
Appendix
Appendix 1: Balance sheet (VNDbn)
BALANCE SHEET
2011
3Q2012
2012E
2013F
2014F
2015F
2016F
20
Cash & near cash items
467,084
602,558
513,908
579,951
866,715
1,201,545
1,656,329
Short-term investments
-
-
-
-
-
-
-
2,11
Accounts & notes receivable
338,733
394,448
388,910
418,935
490,824
586,541
685,983
78
Inventories
514,191
603,883
532,799
574,650
674,275
809,035
948,247
1,09
Other current assets
170,683
161,093
185,027
199,312
233,513
279,052
326,362
37
Total current assets
1,490,692
1,761,983
1,620,644
1,772,848
2,265,327
2,876,173
3,616,921
4,36
455,602
493,772
864,823
1,185,637
1,295,630
1,387,291
1,478,952
1,57
Gross fixed assets
643,502
718,009
943,502
1,293,502
1,413,502
1,513,502
1,613,502
1,71
Accumulated depreciation
Net fixed assets
187,900
224,237
266,579
374,445
492,317
618,528
753,079
89
Other long-term assets
49,412
46,804
49,412
49,412
49,412
49,412
49,412
49
Total long-term assets
505,015
540,575
914,236
1,235,049
1,345,042
1,436,703
1,528,364
1,62
1,995,707
2,302,558
2,534,880
3,007,898
3,610,369
4,312,876
5,145,286
5,98
Accounts payable
123,619
102,173
126,148
136,056
159,644
191,550
224,511
25
Short-term borrowings
21,116
17,658
52,410
47,843
63,384
56,384
73,138
91
Other short-term liabilities
399,290
485,473
476,693
513,496
601,611
718,933
840,820
96
Total current liabilities
544,024
605,305
655,251
697,395
824,638
966,867
1,138,469
1,31
Long-term borrowings
-
-
-
-
-
-
-
58,224
57,276
58,224
58,224
58,224
58,224
58,224
Total assets
Other long-term liabilities
58
Total long-term liabilities
58,224
57,276
58,224
58,224
58,224
58,224
58,224
58
Total liabilities
602,248
662,581
713,475
755,620
882,863
1,025,092
1,196,693
1,37
-
-
-
-
-
-
-
11,911
14,726
11,911
11,911
11,911
11,911
11,911
11
651,764
653,764
651,764
651,764
651,764
651,764
651,764
65
Total preferred equity
Minority interest
Share capital & apic
Retained earnings & other
fund
Total equity
729,783
971,487
1,157,729
1,588,603
2,063,831
2,624,109
3,284,917
3,94
1,393,458
1,639,977
1,821,404
2,252,278
2,727,506
3,287,784
3,948,592
4,61
Total liabilities & equity
1,995,707
2,302,558
2,534,880
3,007,898
3,610,369
4,312,876
5,145,286
5,98
Source: Team’s estimate
Appendix 2: Income statement (VNDbn)
INCOME STATEMENT
2011
2,490,88
0
1,282,11
7
1,208,76
3
Revenue
Cost of Revenue
Gross profit
Selling, general & administrative
464,712
Interest expense
2,039
Pretax income
2012E
2,700,209
2,908,678
3,407,801
4,072,370
4,762,795
5,4
1,368,959
1,476,489
1,732,462
2,078,710
2,436,398
2,8
990,841
1,331,251
1,432,189
1,675,339
1,993,660
2,326,398
2,6
785,900
846,575
991,845
1,187,922
1,389,321
1,5
545,351
585,614
683,494
805,738
937,077
1,0
6,289
5,741
7,606
6,766
8,777
586,329
630,789
735,541
870,258
1,011,672
1,1
597,865
744,051
Operating income
3Q2012
2,025,01
5
1,034,17
3
392,976
2,104
490,942
422,404
2013F
2014F
2015F
2016F
20
Income tax expense
71,180
58,883
78,627
87,961
137,270
165,675
181,427
2
Income before xo items
419,762
363,521
507,702
542,828
598,271
704,583
830,246
9
4,236
4,236
4,236
4,236
4,236
503,466
538,592
594,035
700,347
826,010
7,701
8,238
9,086
10,713
12,635
Minority interests
4,236
Net income
4,347
415,527
EPS
359,174
6,375
5,494
Appendix 3: Financial ratios
Year
Source: Team’s estimate
2017F
2011
3Q2012
2012E
2013F
2014F
2015F
2016F
ROA
21.8%
22.8%
22.2%
19.5%
18.0%
17.7%
17.5%
17.1%
ROE
30.1%
32.4%
27.8%
24.1%
21.9%
21.4%
21.0%
20.6%
Gross profit margin
48.5%
51.2%
49.3%
49.2%
49.2%
49.0%
48.8%
48.7%
Net profit margin
16.7%
13.8%
18.6%
18.5%
17.4%
17.2%
17.4%
17.3%
Quick ratio
2.1
2.1
1.7
1.8
2.1
2.3
2.5
2.6
Current ratio
2.7
2.9
2.5
2.6
2.8
3.0
3.2
3.3
Receivables turnover ratio
7.7
8.1
7.4
7.2
7.5
7.6
7.5
7.4
DSO
47.3
45.1
49.2
50.7
48.7
48.3
48.8
49.1
Inventory turnover ratio
3.0
2.6
2.6
2.7
2.8
2.8
2.8
2.8
DHO
122.6
140.7
139.6
136.9
131.6
130.2
131.6
132.6
Payable turnover ratio
13.8
18.8
11.1
11.6
12.4
12.6
12.4
12.2
Numbers of days payable
26.4
19.4
32.9
31.5
29.5
29.0
29.5
29.9
Total asset turnover ratio
1.2
0.9
1.1
1.0
0.9
0.9
0.9
0.9
Fixed asset turnover ratio
5.5
4.1
3.1
2.5
2.6
2.9
3.2
3.5
Total debt ratio
1.1%
0.8%
2.1%
1.5%
1.6%
1.2%
1.3%
1.4%
Debt to Equity Ratio
1.5%
1.1%
2.9%
2.0%
2.1%
1.5%
1.6%
1.8%
1.4
1.4
1.4
1.3
1.3
1.3
1.3
1.3
Profitability ratios
Liquidity ratios
Efficiency ratios
Leverage ratios
Equity multiplier
Source: Team’s estimate
Appendix 4: Sensitive analysis
Cost of equity
Growth
-1.00%
-0.50%
Base
0.50%
1%
-0.50%
74,578
73,657
72,767
71,906
71,075
-0.25%
77,497
76,509
75,554
74,631
73,739
Base
80,462
79,405
78,384
77,398
76,444
0.25%
83,474
82,347
81,259
80,207
79,191
0.50%
86,533
85,335
84,178
83,060
81,979
9
Appendix 5: Scenario analysis
We use sales growth based on changes in price and volume to judge how they affect value of equity per share in different
scenarios. Discount rate variation is used to test how they affect firm value. Other factors are constant to simplify our analysis.
Description for two scenarios
Fierce competition prevents DHG from raising the price and volume growth at lower speed in three segments:
Worst
pharmaceuticals, functional foods and cosmetics.
Cost of equity goes up even higher than our base case.
1. The company takes an accurate strategy to compete with competitors so the volume goes faster.
2. Price increases more than we forecasted.
Best
3. Stability of Vietnam economy decreases risk free rate, which in turn lower the cost of equity and Vietnam default
spread.
Worst case
Unit: VNDmn
Pharmaceutic
als sales
Growth
Increase in
price
Increase in
volume
Functional
foods sales
Growth
Increase in
price
Increase in
volume
Cosmetics
sales
Growth
High growth stage
201 201 201 201
3F
4F
5F
6F
2,1 2,4 2,8 3,2
53, 62, 65, 46,
727 042 117 560
5.7 14. 16. 13.
% 3% 4% 3%
2.8 2.8 2.8 2.5
%
%
%
%
2.9 11. 13. 10.
% 3% 3% 5%
195 256 343 450
,62 ,63 ,74 ,95
4
2
9
1
20. 31. 33. 31.
7% 2% 9% 2%
3.5 3.5 3.5 3.5
%
%
%
%
16. 26. 29. 26.
6% 8% 4% 8%
1,0 1,1
794 898
37
73
5%
13
16
13
%
%
%
0.8 0.8 0.8 Re-0.8
%
%
% CAPM
%
0.63%
4%
12
15
12
% 7% %
%
2,3 2,7 8%3,2 3,6
0.56709, 98,
50, 19,
145 572
4.133%903 685
7%
16
15
1.622 18
%
%
%
19.43%
201
7F
3,6
06,
238
11.
1%
2.5
%
8.4
%
582
,25
1
29.
1%
3.5
%
24.
8%
1,3
06
11
%
0.8
%
11
%
4,1
89,
796
13
%
Second stage
201
2018F
9F
2020F
4,04
3,873,5
5,08 4,221,468
20
7
4.4
7.4%
%
4.4%
2.0
2.0%
%
2.0%
2.4
5.3%
%
2.3%
630,038
8.2%
3.0%
5.1%
1,372
5%
Increase in
0.5%
Indirect approach
price
US Risk free rate
Increase in
5%
Vietnam default spread
volume
Forex premium
Total sales
4,504,9
Beta
31
US risk premium
Increase in
8%
Relative volatility of VN's equity market
sales
Cost of equity (Indirect)
= US Rf + country default spread + Fp + Beta*US
Rp* Relative Volatility
Approach
Rm (2000-2011) (Annual average)
Government bond yield 2001 - 2009 (annual
average)
RP
Rf (Current government bond yield 5 years)
Beta
Cost of equity
Average
662,
772
5.2
%
3.0
%
2.1
%
1,40
2
2%
696,746
5.1%
3.0%
2.1%
1,431
2%
0.5
%
2%
0.5%
4,70
9,26
1
5%
4,919,645
2%
4%
17.17%
9.78%
7.39%
10.50%
0.567
14.69%
17.06%
Best case
Unit: VNDmn
Pharmaceuticals sales
Growth
Increase in price
Increase in volume
Functional foods sales
Growth
Increase in price
Increase in volume
Cosmetics sales
Growth
Increase in price
Increase in volume
Total sales
Increase in sales
Indirect approach
US Risk free rate
0.63%
Vietnam default spread
5%
Forex premium
8%
Beta
0.567
US Risk premium
4.133%
Relative Volatility of VN's equity
market
1.622
Terminal value
Worst
Base
Best
Cost of equity (Indirect)
17.43%
Forecasted=EV/
EBITDA
in 2020
(x)spread + Fp + Beta*US
6.880 Rp* Relative6.880
6.880
US Rf
+ country
default
Volatility
EBITDA 2020
1,194,534
1,598,014
2,226,946
Re-CAPM Approach
8,218,911
10,995,029
15,322,354
EV 2020
Rm (2000-2011) (Annual Average)
Government
3,085,794bond Yield
3,091,583
2001 - 2009 (annual
5,374,947
- Debt 2020 - Minority interest 2020
average)
5,133,117
7,093,446
9,947,407
Terminal Value of Relative method
RP
1,455,793
2,125,206
3,238,181
PV of Terminal Value of Relative method
Rf (Current Government Bond Yield 5years)
1,529,462
1,759,045
2,260,812
PV of FEFE 2013 – 2017
Beta
791,399
1,108,814
1,685,694
PV of FCFE 2018 – 2020
Cost of equity
513,908
513,908
513,908
+ Cash and equivalents
Average
4,290,561
5,506,974
7,698,595
Value of equity
Number of shares outstanding
65,176,429
65,176,429
65,176,429
Value of equity per share (VND)
65,830
84,493
118,119
Percent change
-22.1%
-
39.8%*
17.17%
9.78%
7.39%
8.50%
0.567
12.69%
15.06%
*We used reserve assumptions in our base case so the upside of best scenario is higher than the downside of the worst case.
Appendix 6: Healthcare Expenditure in Different Countries
Total expenditure on health per capita (USD)
2000
2001
2002
2003
2004
2005
2006
2007
2008
2009
2010
CAGR
Argentina
709
678
225
283
332
400
464
562
698
734
742
0.5%
Brazil
265
228
203
214
257
388
492
610
715
734
990
14.1%
Brunei
551
532
533
583
667
691
711
783
877
833
882
4.8%
Cambodia
19
22
25
30
32
35
32
32
39
41
45
9.0%
China
43
47
54
61
70
80
93
114
157
191
221
17.8%
France
2,203
2,234
2,489
3,159
3,630
3,785
3,947
4,483
4,941
4,840
4,691
7.9%
Germany
2,387
2,401
2,610
3,209
3,528
3,626
3,748
4,231
4,718
4,723
4,668
6.9%
India
20
21
21
24
26
31
33
40
43
44
54
10.4%
Indonesia
15
17
20
27
27
30
40
51
53
56
77
17.8%
Italy
1,554
1,611
1,778
2,184
2,570
2,712
2,851
3,095
3,472
3,323
3,248
7.7%
Laos
11
13
13
18
19
20
23
28
39
39
46
15.4%
M
a
l
a
y
si
a
M
y
a
n
m
a
r
1 11111223331
2 34898360161
P
o
l
a
n
d
2 23344579891
S
i
n
5 66899111111
3 33455681111
g
a
p
o
r
e
T
h
a
il
a
n
d
6 67789111111
T
h
e
P
h
il
i
p
p
i
n
e
s
3 22334456678
U
K
1 12223333337
V
ie
t
n
a
m
2 22233457781
Manufacturer
1.5%
Abroad
Source: WHO
Importer
Vietnam
6-9%
Appendix 7a: Distribution system of foreign companies
Distributor
Representative offices
Wholesaler
Promotion
20%
2-5%
Doctors
Pharmacies
Hospitals
Prescription
Patient
Source: Jaccar, Team’s estimate
Appendix 7b: Distribution system of domestic companies
Local manufacturer
Promotion
20-50%
Wholesaler
20%
Pharmacies
Doctors
Prescription
Hospitals
Patient target price
Source: Jaccar, Team’s estimate
Appendix 8: Market share of top ten leading vietnam pharmaceutical manufacturers
Source: BMI Q3/2010
Appendix 9: Some major patents’ expiration in 2012
Brand name
Singular
Company
Merck
Indication
Asthma
2010 Sales (USDmn)
3,823
Actors
Takeda
Type 2 diabetes
2,913
Lexapro
Forest
Depression
2,590
Diovan
Norvatis
High blood pressure
1,430
Source: BMI
Appendix 10: Cost of equity
COST OF EQUITY
Indirect approach
US Risk free rate
0.63%
Vietnam default spread
6.00%
Forex premium
8.00%
Beta
56.70%
US risk premium
4.13%
Relative volatility of VN's equity market
1.622
Cost of equity (Indirect)
18.43%
CAPM approach
Government bond yield 2000 - 2011 (Annual average)
Rm (2000-2011) (Annual average)
9.78%
17.17%
Current government bond yield 5years
9.90%
Beta
0.567
Cost of equity (CAPM)
14.09%
16.26
%
Source:Team’s estimate
Average cost of equity
Appendix 11: Tax rate forecast
Effective tax rate
Source: Team’s estimate
Appendix 12: Company’s peers
Peers are selected from Emerging Asia countries, based on the Global Industry Classification Standard (GICS) developed by
MSCI and Standard & Poor’s
Ticker
Name
Market
capitalizatio
n
(VNDmn)
Enterprise
value
(VNDmn)
P/E
P/B
DHG VN Equity
HAU GIANG PHARMACEUTICAL JSC
4,216,127
3,645,952
8.8
2.6
SAPH IN Equity
SHASUN PHARMACEUTICALS LTD
3,238,277
4,622,934
7.5
3.9
DVLA IJ Equity
DARYA VARIA LABORATORIA PT
4,120,744
3,444,592
12.8
2.4
HKCI IN Equity
HIKAL LTD
2,736,071
4,892,359
15.8
1.7
FDCLT IN Equity
FDC LTD
6,128,596
5,076,408
12.2
2.3
719 HK Equity
SHANDONG XINHUA PHARMACEUT-H
5,095,440
6,333,154
15.3
0.4
ABOT PA Equity
ABBOTT LABORATORIES PAKISTAN
4,799,989
4,446,284
12.3
3.8
BXPHAR BD Equity
BEXIMCO PHARMACEUTICALS LTD
4,114,760
4,308,540
13.5
1.0
EURO PM Equity
EURO-MED LABORATORIES PHIL
3,732,971
4,419,945
10.6
1.5
AJP IN Equity
AJANTA PHARMA LTD
3,230,596
4,000,257
11.1
2.9
ELDP IN Equity
ELDER PHARMACEUTICALS LTD
2,531,070
5,822,284
9.3
1.0
APEX MK Equity
APEX HEALTHCARE BHD
2,260,182
1,886,564
12.2
1.6
CCMD MK Equity
CCM DUOPHARMA BIOTECH BHD
2,116,577
2,145,713
11.3
1.9
CLAR IN Equity
CLARIS LIFESCIENCES LTD
6,462,640
7,474,629
13.6
1.6
503 HK Equity
LANSEN PHARMACEUTICAL HOLDIN
2,308,087
2,590,413
Source: Bloomberg Data
8.9
1.1
Appendix 13: Rating system
Equity
rating key
Definition
BUY
If the target price is 20% higher than the market price
ADD
If the target price is 10-20% higher than the market price
HOLD
If the target price is 10% below or 10% above the market price
REDUCE
If the target price is 10-20% lower than the market price
SELL
If the target price is 20% lower than the market price
Appendix 14: Production and business costs breakdown
Appendix 13: Five forces analysis of pharmaceutical industry
Source: Company data
Harsh competition with high commission expenses
As all Vietnamese pharmaceutical companies manufacture the same kinds of drugs,
they spend a lot on commission to maintain their competitive positions. For
domestic corporations, selling and commission expenses can take up to 30 percent
of the total revenue, or even up to 50 percent of end – user price for some products.
On the contrary, international pharmaceutical companies spend less in commission
expenses due to their well-known brands and specific medicines that are not
produced in Vietnam.
Over dependence on imported raw materials
The proportion of imported materials value in the total revenue of the industry is
still extremely high and there are no signs that it will decline in the near future.
Vietnamese companies indeed have weak pricing power in terms of raw materials.
High bargaining power of consumers
Revenue of pharmaceutical companies depend on purchasing behavior of
customers. Thus, they have to pay hefty commissions to sale agents,
representatives and hospital managers to gain contracts with business customers.
Besides, to get individual customers’ attention, they need to enhance their images
in the customers’ awareness.
High barriers for new entrants to penetrate into the business
Pharmaceutical industry is highly profitable, however, pressure from new
competitors is trivial. New entrants must face high barriers to entry such as legal
procedure, capital and technology requirement, especially distribution channel and
consumer relationship, etc.
Low probability of substitute for pharmaceutical products
Although common diseases can be cured by either pharmaceuticals or herbal
medicines, pharmaceuticals have the non-alternative power, especially with serious
and chronic illness.
Appendix 14: SWOT analysis of DHG
S
W
OPPORTUNITIES
O
T
A
N
A
L
Y
THREATS
S
I
S
Appendix 15: Social responsibility
Program
Place
Content
• Examined and dispensing medicine to
1,500 inhabitants.
Connecting hearts
arm with Eugica
Useful live and work
(Hapacol collaborated with Youth Union)
Propaganda against dengue fever and hand, foot
and mouth disease prevention
Supported Day for the Poor
Ly Son
Gia Lai, Hue, Nghe An
Remote areas
Seven provinces and cities
Can Tho City
• Wormed for 4,200 primary students.
• Donated 500 gifts.
• Offered gifts, examined and dispensed
medicine for 1,000 mountain people.
• Trained 600 Youth Union members
for effective work and useful life.
• Measured osteoporosis and directly
consulted for 37,333 people.
• Supported 42 cases of difficult
individuals and families inside and put
aside the company.
Can Tho VTV
Television channels of Mekong delta
Can Tho Radio Broadcasting Televisions
Doctor – Patient Interface
Talk shows
Health magazine
• Enhanced the awareness of healthcare
of people in Mekong delta
Source: Company data
Appendix 16: Pharmerging markets redefined
Tiers
Tier 1
Tier 2
Tier 3
2008 GDP
(USDbn)
Countries
China
Brazil, Russia, India
Venezuela, Poland, Argentina, Turkey,
Mexico, Vietnam, S. Africa, Thailand, the
Philippines, Indonesia,…
8,000
2,000-4,000
<2,000
Incremental pharma
market value growth
from 2008 – 2013
(USDbn)
40+
5-15
1-5
Source: IMS Health
Appendix 17: Ownership structure of DHG
DHG shareholders 27/03/2012
Shareholder
% capital
% voting rights
SCIC
43.44%
43.44%
Employees
2.84%
2.84%
Domestic investors
51.01%
51.01%
Foreign ownership
49.98%
49.98%
Templeton Frontier Markets Fund
8.05%
8.05%
Vietnam Holding Limited
2.48%
2.48%
KITMC Worldwide Vietnam RSP Balance Fund
2.24%
2.24%
Citigroup Global Markets Ltd
2.15%
2.15%
KWE Beteiligungen AG
1.86%
1.86%
Others
33.20%
33.20%
Appendix 18: Insiders of DHG
DHG's Insiders ( July 2012)
Board Members
Phạm Thị Việt Nga
Lê Minh Hồng
Lê Chánh Đạo
Nguyễn Thị Hồng Loan
Đoàn Đình Duy Khương