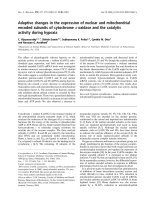
dna barcoding gene cytochrome c oxidase subunit i of channa species in the mekong delta
Bạn đang xem bản rút gọn của tài liệu. Xem và tải ngay bản đầy đủ của tài liệu tại đây (513.21 KB, 15 trang )
CAN THO UNIVERSITY
COLLEGE OF AQUACULTURE AND FISHERIES
DNA BARCODING GENE
CYTOCHROME C OXIDASE SUBUNIT I
OF CHANNA SPECIES IN THE MEKONG DELTA
By
NGUYEN THI NGOC TRAN
A thesis submitted in partial fulfillment of the requirements for
the degree of Bachelor of Aquaculture Science
Can Tho, December 2014
CAN THO UNIVERSITY
COLLEGE OF AQUACULTURE AND FISHERIES
DNA BARCODING GENE
CYTOCHROME C OXIDASE SUBUNIT I
OF CHANNA SPECIES IN THE MEKONG DELTA
By
NGUYEN THI NGOC TRAN
A thesis submitted in partial fulfillment of the requirements for
the degree of Bachelor of Aquaculture Science
Supervisor
Dr. DUONG THUY YEN
Can Tho, December 2014
DNA BARCODING GENE
CYTOCHROME C OXIDASE SUBUNIT I
OF CHANNA SPECIES IN THE MEKONG DELTA
Nguyen Thi Ngoc Tran 1 and Duong Thuy Yen 2
1
Advanced Aquaculture Course 36
2
Department of Freshwater Aquaculture
College of Aquaculture and Fisheries, Can Tho University
Email:
ABSTRACT
Channa species are indigenous freshwater fish that are important for aquaculture in
Vietnam. This genus shows a variety of variation in morphology, resulting in 7 different
local names while only 4 speices, including Channa striata, Channa micropeltes, Channa
lucius, and Channa gachua were scientifically classified. The taxonomic systems of Channa
species, especially three newly-observed phenotypes including Projected lip Channa,
Triangle head Channa and Square head Channa are still controversial. This study aimed to
investigate the taxonomic classification of different phenotypes of Channa species and
understand phylogeny relationship of Channa species based on morphological
characteristics and DNA barcoding (Cytochrome C oxidase subunit I, COI). Thirty
individuals of each phenotype were measured morphological characteristics, and five of
these were sequenced COI gene. Morphological results showed that Triangle head Channa
and Square head Channa had similar ranges of countable parameters, but were different in
the shape of their head. The phylogeny tree based on 684 base-pair region of COI gene
showed that 6 Channa species formed 2 large branches with C. striata (and 2 Channa
phenotypes) – C. gachua and C. micropeltes – C. lucius. COI gene sequences of 2 undefined
species (Triangle head Channa and Square head Channa) were 99% identity with C. striata.
Based on countable traits and COI gene, it can be concluded that Triangle head Channa and
Square head Channa are the same species with C. striata.
Keywords: Channidae, species classification, DNA barcoding, species diversity, morphology
1. INTRODUCTION
Channa species are among the most popular species in Viet Nam. There are four
species of Channa found in the Mekong Delta of Viet Nam, including Channa
striata, Channa micropeltes, Channa lucius, Channa gachua (Truong Thu Khoa and
Tran Thi Thu Huong, 1993). Beside these common species there are some new
phenotypes that have not been taxonomically classified. They are “triangle head
(TH) Channa”, “projected lip (PL) Channa”, “square head (SH) Channa”, which
have been cultured popularly in the Mekong Delta and are favorite food for local
consumers. Thanks to their high flesh quality and price, culturing them has brought a
lot of benefits and improved income for fish farmers in many provinces in Viet Nam
such as An Giang, Dong Thap, Ca Mau and Can Tho (Nguyen Bach Loan et al.,
2003).
In previous studies, Channa species were classified by morphological methods.
Channa species had similarities in elongated body and cylinder shape (Truong Thu
Khoa and Tran Thi Thu Huong, 1993). Head was broad and flattened with large
mouth, strong teeth and projecting lower jaw (Tran Dac Dinh et al., 2013). The
dorsal fin was longer than anal fin and beginning the pectoral fin (Rainboth, 1996).
C. micropletes was distinguished by the completed lateral line and many black spots
1
in body. C. gachua was recognized by orange edge in the dorsal, anal and caudal fin.
The lateral line that broke suddenly in one point and fell into 2 slides of scales
belonged to the group of C. lucius and C. striata. However, C. lucius was different
from C. striata in the dorsal profile of head concaved (Tran Dac Dinh et al., 2013).
Moreover, the appearance of camie tooth of C. lucius helped recognize it from C.
striata (Truong Thu Khoa and Tran Thi Thu Huong, 1993).
Besides four morphologically distinct species, TH Channa, SH Channa and PL
Channa were still on research. A previous study comparing morphological
characteristics between PL Channa and C. striata showed that 18 of 20 measurable
parameters were significantly different (p<0.05) (Nguyen Van Trong et al., 2005).
Another study by Nguyen Van Hoa (2008) reported that TH Channa, SH Channa,
and PL Channa were the same species evidenced by similarities in the number of
dorsal fin, pectoral and anal fin rays, lateral line scales and measurable ratio.
However, 84.21% of countable parameters of C. striata were different from those of
PL Channa. An example of differences between these two Channa groups was the
ratio between the upper jaws and lower jaws. Therefore, it was hyphothesized that
PL Channa could be a new phenotype of C. striata. There is still a controlversial
question whether the new phenotypes of Channa including TH Channa, SH Channa
and PL Channa are the same species. Morphological comparision in previous studies
has not provided convincible and complete answers.
Nowadays, the molecular technology has developed. Molecular markers are used to
classify fish species to supply more clearly information for tradditional
morphological methods. Several genes have been used for species classification.
Among which, COI gene (cytochrome c oxidase subunite I) can serve as DNA
barcoding for identification of species including fish (Hebert et al.,2003). For
example, it was used to characterize and identify domestic and imported fishes in
Australia (Ward et al., 2005). DNA barcoding was also used to find divergences
among marine fishes in South Africa (Zemlak et al., 2009). Analyzing of COI gene
represented an important step in species identification for half of the ornamental fish
species imported to North America (Steinke et al., 2009). Moreover, morphological
characteristics of fish changed quickly and significantly during its development from
eggs to larvae, so DNA barcoding has become a useful tool to check the accuracy of
tradditional larval fish identification (Ko et al., 2013).
This study firstly investigated the taxonomic classification of different phenotypes of
Channa species by comparing morphological characteristics of different phenotypes
of Channa spp. (“TH Channa” and “SH Channa) and two morphologically similar
species (C. striata and C. lucius). Secondly, the study compared COI gene sequences
of Channa species to understand phylogeny relationship of Channa species based on
morphology characteristics and DNA barcoding (COI).
2. MATERIALS AND METHODS
2.1 Fish sampling
Samples of Channa species including C. striata, C. micropeltes, C. gachua, C. lucius,
and two unidentified phenotypes called TH Channa, SH Channa were collected from
farmers and local markets in Can Tho, Hau Giang, and Vinh Long provinces. Each
species was sampled 25 to 35 individuals for morphological classification and
measurements. Among those samples of each species, 12 samples were collected
2
caudal fins which were stored in eppendorff tubes containing ethanol 96% for DNA
analysis.
2.2 Morphology classification methods
Fish was kept alive or stored in ice and transferred to the fish genetic laboratory.
Then, fish was observed the external characteristics including color, shape of body,
head, tail, and lateral line. The samples were classified and measured morphological
parameters based on previous literature of Truong Thu Khoa and Tran Thi Thu
Huong (1993) and Tran Dac Dinh et al. (2013). There were totally 21 measurable
parameters and 6 countable parameters. Among those measurable parameters, 6
parameters were calculated ratios to standard length (SL), 8 parameters were
compared ratios to head length (HL) and 2 parameters were ratio to lower jaw length
(LJ).
2.3 DNA analysis methods
2.3.1 DNA extraction: DNA was extracted from fish fins by using the Phenolchloroform method (Taggart et al., 1992).
2.3.2 PCR amplification: The gene COI of DNA mitochondria was amplified using
a pair of primers
Fish F2-t1:
TGTAAAACGACGGCCAGTCGACTAATCATAAAGATATCGGCAC
and Fish R2-t1:
5‟CAGGAAACAGCTATGACACTTCAGGGTGACCGAAGAATCAGAA‟3. The
final concentrations of PCR ingredients in 31 µL PCR product were 22.11L
distilled water, 3.1 L buffer, 0.62 L dNTP 10 mM, 0.62 L MgCl2 15 mM, 0.62
L primer Fish F2-t1, 0.62 L primer Fish R2-t1 10 pmol, 0.31 L taq 5U, and 3 L
DNA.
The temperature cycles of PCR reaction included 1circle at 95oC in 2 minutes, 35
circles of amplification including 30 seconds at 94oC, 30 seconds at 52oC and
1minute at 72oC, and 1 circle of final extension at 72oC for 10 minutes (Ward et al,
2005).
2.3.3 Electrophoresis and sequencing: The quality of extracted DNA and PCR
products was checked by agarose electrophoresis (1%). Five of good PCR products
from each fish species were chosen for sequencing which was analyzed by Nam
Khoa Company (Ho Chi Minh city).
2.4 Data analyses
2.4.1 Morphological data
Morphological data were calculated mean, standard deviation, mode, frequency of
mode values by using Microsoft Excel and SPSS 16.0. One way ANOVA with
Duncan test was used to compare the morphological ratios among Channa species.
2.4.2 DNA Sequence analysis
DNA was analyzed by the programs Finch TV 1.4.0 ( />Mega6 ( and BLAST (Basis Local Alignment Search
Tool) ( Finch TV and Mega6 were used to
view and check quality of DNA sequences between 2- direction sequences. The
nucleotide with higher quality value was selected, if forward and reserve sequences
were mismatched in a nucleotide. Edited sequences within and among species were
3
aligned and then compared levels of sequence similarity with database in
GENBANK using BLAST program. Mega6 compared or aligned DNA sequence of
forward and reverse sequences of each sample; among species; and of DNA
sequences database available at GENBANK. From those results, the detail
phylogeny analysis information such as nucleotide composition of analyzed species,
genetic distance within and between species, phylogeny trees were shown. BOLD
system also identified the species and compared the genetic relationship among the
analyzed species and similar species in other areas through phylogeny trees.
3. RESULTS
3.1 Morphological comparison of Channa species
3.1.1 External appearance
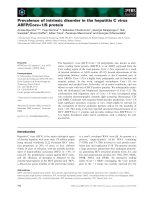
From the external characteristics, C. lucius and C. striata, TH Channa, SH Channa
have similarities in the lateral line that breaks suddenly in one point and fall into 2
slides of scales. These species have no barbels. C. lucius‟s morphology is different
from the group of C. striata, TH Channa and SH Channa in some characteristics. C.
lucius has dark spots in the outside of body. In addition, the dorsal profile of C.
lucius „s head is concaved. There are several black vertical lines in the ventral part of
its body.
Figure 1. Channa lucius
Figure 2. Channa striata
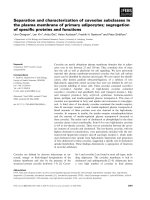
Meanwhile, TH Channa and SH Channa look alike C. striata in the body shape.
Dark brown color and whitish in ventral part of these 2 species are similar to the
external color of C. striata. It is much difficult to differentiate 3 of these species by
naked eyes.
Figure 3. Square head Channa
Figure 4. Triangle head Channa
3.1.2 Countable parameters
Totally 115 samples of Channa species with similar sizes were collected for
morphological analysis. The range of total length of C. lucius is from 17 – 30 cm, C.
striata is from 23 – 30 cm, TH Channa is 21 – 35 cm and SH Channa is 23 – 34cm.
The countable parameters of C. striata and C. lucius are consistent with the previous
research by Truong Thu Khoa and Tran Thi Thu Huong (1993) (Table 1).
4
SH Channa and TH Channa have similar ranges of the number of lateral line scales
and dorsal fin, pectoral fin, and anal fin rays. In addition, those values are nearly the
same with C. striata.
Table 1. Range, mode and frequency of countable parameters of Channa species
Countable parameters
53-56
TH
Channa
(N=34)
52 - 59
SH
Channa
(N=24)
52 - 57
61 (37.04)
54 (36.67)
54 (23.53)
56 (37.5)
6.5 - 9
6.5-7
6-8
5.5 - 6.5
7 (31.03)
7 (50.00)
7 (44.12)
6 (54.17)
8-9
7.5 - 9
8 - 8.5
8-9
Mode (Frequency, %)
9 (37.93)
8 (50.00)
8 (64.71)
8 (41.67)
Range
Mode (Frequency, %)
Range
Pectoral fin
rays
Mode (Frequency, %)
Range
Anal fin rays
Mode (Frequency, %)
39 - 41
40 (51.72)
14 - 16
16 (41.38)
27 - 29
28 (58.62)
41 - 42
42 (53.33)
15 - 16
16 (60.00)
26 - 27
27 (56.67)
40 - 42
42 (52.94)
15 - 17
17 (52.94)
25 - 26
26 (73.53)
38 - 42
42 (41.67)
14 - 15
15 (50.00)
23 - 25
25 (50.00)
Scales of
lateral line
Range
Scales upper
of lateral
line
Scales lower
of lateral
line
Dorsal fin
rays
Range
Mode (Frequency, %)
Mode (Frequency, %)
Range
C. lucius
(N=27)
C. striata
(N=30)
60 – 64
3.1.3 Ratios of measurable parameters
All of the ratios of measurable parameters to standard length, head length, large head
width and lower jaw length were significantly different showing the differences in
morphology among C. lucius, C. striata, SH Channa and TH Channa (Table 2).
Comparing to the group of C. striata, C. lucius has long head, high body depth, high
caudal fin depth and long dorsal fin. In contrast, the distance from mouth to dorsal
fin, anal fin and pectoral fin are short. Focusing on the shape of the head, C. lucius
has medium head length. The ratio between the standard length and small head
width and large head width indicates that C. lucius has pointed head but not very
pointed in comparison to the TH Channa.
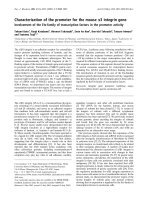
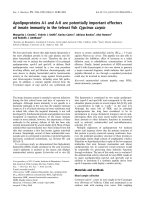
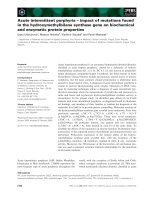
Although the external characteristics of 3 groups of Channa (C. striata, TH Channa,
and SH Channa) are difficult to distinguish, they are different in the shape of their
head. The head width, jaws length, and eyes distance of 3 groups are significantly
different (p<0.05). As a result, the ratios of head length to standard length; small
head width, large head width and eyes distance to head length describe different
images of fish head (Figure 5). C. striata‟s head is the slimmest among 3 groups. The
head of SH Channa is larger and shorter; therefore it looks like a square shape.
Meanwhile, TH Channa has the shortest ratio of head length/ standard length, and
head width at the biggest position of the head is larger than head width before eyes,
creating the shape of a triangle. These images can explain common names of two
Channa phenotypes called by farmers. Moreover, the ratio of upper jaw and lower
jaw length also helps differentiate 3 groups with the most projected lip from SH
Channa.
5
Table 2. Mean of ratios of measurable parameters of Channa species
Measurable
Channa lucius Channa striata
TH Channa
parameters
(N=27)
(N=30)
(N=34)
Ratio to standard length
Head length (HL)
33.92 ± 1.04 d
33.14 ± 1.07 c
28.15 ± 1.47a
c
b
Body depth (BD)
17.78 ± 0.93
14.29 ± 0.46
15.55 ± 0.55 c
Height of caudal fin
10.24 ± 0.56 d
8.52 ± 0.30 b
8.83 ± 0.50 c
(HCP)
dfD
33.53 ± 1.53 a
35.97 ± 0.69 b
33.05 ± 1.36 a
b
b
dfP
34.35 ± 1.55
34.24 ± 1.20
31.29 ± 1.32 a
dfA
47.81 ± 2.08 a
55.64 ± 1.88 c
53.97 ± 2.63 b
Dorsal fin length
60.69 ± 1.95 c
59.06 ± 1.69 b
60.99 ± 2.69 c
(DL)
Ratio to head length
Head depth (HD)
47.52 ± 3.09 b
42.53 ± 2.05 a
51.44 ± 2.42 c
Small head width
27.59 ± 2.09 a
33.01 ± 1.70 b
35.19 ± 2.18 c
(SHW)
Large head width
47.64 ± 3.32 a
52.45 ± 2.07 b
59.62 ± 2.61 d
(LHW)
Distance of two eye
26.30 ± 2.08 a
27.16 ± 1.32 a
30.50 ± 1.71 c
(DE)
Eyes diameter (ED)
11.52 ± 0.88 a
11.63 ± 0.73 a
14.11 ± 0.89 b
Upper jaw length
31.22 ± 1.49 a
38.27 ± 1.49 c
36.50 ± 1.91 b
(UJ)
Lower jaw length
33.94 ± 1.61 a
41.57 ± 1.86 c
40.36 ± 1.86 b
(LJ)
Mouth width (MW)
34.61 ± 1.66 a
42.68 ± 1.89 bc
42.05 ± 1.97 b
Ratio to large head width
Small head width
58.01 ± 3.62 a
62.97 ± 2.85 b
59.07 ± 3.4 a
(SHW)
Ratio to lower jaw length
Upper jaw length
92.08 ± 4.04 b
92.09 ± 3.84 b
90.51 ± 4.17 ab
(UJ)
Mouth width (MW) 102.00 ± 1.89 b 102.68 ± 1.64 bc 104.33 ± 5.19 c
The values in the same row with different characters showed the significant
p<0.05
SH Channa
(N=24)
31.60 ± 0.78 b
13.41 ± 0.75 a
7.94 ± 0.54 a
35.55 ± 1.49 b
33.80 ± 1.04 b
55.46 ± 2.01 c
56.83 ± 1.56 a
43.33 ± 2.13 a
35.53 ± 1.84 c
54.45 ± 2.08 c
28.41 ± 1.45 b
11.72 ± 1.03 a
39.05 ± 1.90 c
44.10 ± 1.55 d
43.49 ± 1.64 c
65.28 ± 3.26 c
88.56 ± 3.40 a
98.68 ± 3.27 a
difference with
Figure 5. Image of the head of Channa striata, TH Channa and SH Channa
Note: the head length was based on the ratio of head length to standard length. Other length
were based on the ratio to head length.
3.1.3 Relative gut length (RGL)
The ratio between gut length and standard length (or relative gut length, RGL) of C.
lucius, TH Channa, and SH Channa is similar (p>0.05), which is significantly higher
than that of C. striata. The gut lengths depend on the type of eaten feed. Snakehead
6
species are known as carnivores which feed mainly on smaller fish, crab or shrimp.
Their RGL was smaller than 1, consistent with the feeding type of carnivores
(Nikolsky, 1963). In C. striata collected in West Bengal, India, the gut consisted of
only animal matter , and RGL was 0.57 (Dasgupta, 2000), smaller than RGL of C.
striata (0.78 0.15) in our study.
TH Channa and SH Channa tend to increase the gut length compared to C. striata. In
recent years, they have been fed by combining commercial feed and trash feed.
Changes in feed used and the large amount of feed fed in culture conditions may
result in the increase of their gut length.
Figure 6. The relative gut length of Channa species
3.2 Phylogeny relationship of Channa species based on COI sequences
The length of COI sequence was chosen with 684 base-pairs. Nucleotide
composition of Channa species is divided into 3 groups (Table 3). The first group is
only C. micropeltes, the second group includes C. gachua and C. lucius; and the last
group is the 2 new undefined species and C. striata. The nucleotide composition of
C. micropeltes is different from the other species in Channa genus. It has the highest
percentage of Cytosin (31%), then Thymine, Adenin and Guanine. In contrast,
Thymine makes up the highest percentage (~30%) in the nucleotide composition of
the other species. Transitional substitiutions between groups of base are higher than
transverstional substitutuions within groups (Table 4).
Table 3. Percentage of nucleotide composition of Channa species
Species
T
C
A
Channa micropeltes
26.6
31.0 23.8
Channa gachua
30.0
28.9 23.7
Channa lucius
30.0
27.8 24.3
Channa striata
29.5
28.9 23.9
SH Channa
29.5
28.9 23.9
TH Channa
29.5
28.8 24.0
Average
29.2
29.1 23.9
G
18.6
17.4
18.0
17.6
17.8
17.7
17.8
Comparing to the database in Genbank, COI sequences of four species C.
micropeltes, C. striata, C. gachua and C. lucius has high levels (99-100%) of
7
similarity of the same reported species (Table 5). Besides, two new phenotypes SH
Channa and TH Channa are also highly similar (99%) to C. striata.
Table 4. Substitution matrix of Channa species
A
T
A
1.72
T
1.41
C
1.41
16.71
G
1.72
31.43
C
1.71
16.67
1.71
G
23.43
1.05
1.05
-
Note: Rates of different transitional substitutions are shown in bold and those of
transversionsal substitutions are shown in regular.
Table 5. Alignment of species‟ COI sequences with Genbank
No
Species
Aligned species
Identity
1
Channa micropeltes
Channa micropeltes
100%
2
Channa gachua
Channa gachua
99%
3
Channa striata
Channa striata
99%
4
Channa lucius
Channa lucius
99%
5
SH Channa
Channa striata
99%
6
TH Channa
Channa striata
99%
Accession
JN024962.1
KJ937435.1
KC789522.1
KJ937433.1
KC789522.1
KC789522.1
Table 6. Genetic distance within groups of Channa species
Species
d
SE
Channa micropeltes
0
0
Channa gachua
0
0
Channa lucius
0
0
Channa striata
0.0047
0.0019
Square head Channa
0.0029
0.0021
Triangle head Channa
0
0
There is no genetic variation within groups of Channa species: C. micropeltes, C.
gachua, C. lucius and TH Channa. On the other hand, C. striata has higher
conspecific genetic distance (0.0047 0.0019) than SH Channa (0.0029 0.0021).
Besides, the genetic distance within these 2 groups is higher than the other Channa
species, indicating that they are more diverse than the other species (Table 6).
Genetic distance between groups of Channa species is much higher than genetic
distance within groups (Table 7). Therefore, genetic distance can be used to classify
species of Channa.
Table 7. Genetic distance between groups of Channa species
C.micropeltes C. striata C. gachua C. lucius SH
Channa
C.micropeltes
0.0175
0.0203
0.0173
0.0175
C. striata
0.1915
0.0184
0.0192
0.0014
C. gachua
0.2436
0.2075
0.0203
0.0184
C. lucius
0.1836
0.2354
0.2449
0.0191
SH Channa
0.1926
0.0038
0.2082
0.2353
TH Channa
0.1946
0.0062
0.2082
0.2331
0.0029
TH
Channa
0.0176
0.0024
0.0185
0.0189
0.0017
Note: the value upper the diagonal are the standard error, the value lower the
diagonal are the genetic distance between grop
8
SH Channa and C. striata, TH Channa and C. striata have very low genetic distance
between groups (0.0038 and 0.0062). These values are nearly similar to the genetic
distance within group of C. striata (0.00470.0019) and SH Channa
(0.00290.0021). Therefore, SH Channa and TH Channa are the same species with
C. striata.
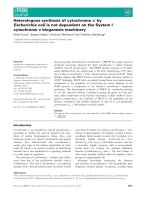
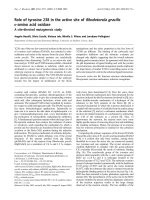
The phylogenic tree (Figure 7) shows that Channa genus divides into 2 large
branches: one includes C. lucius and C. micropeltes, and the other branch consists of
C. gachua, C. striata and two Channa phenotypes. Because of no genetic distance
within each group of C. lucius, C. micropeltes, and C. gachua and high genetic
distance between groups, probability of clustering 5 individuals of each species into
the same group was 100%.
Figure 7. The phylogeny tree of Channa species
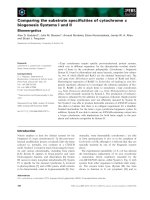
Specifically, C. striata, SH Channa, TH Channa locate in the same branch with 2
smaller but more complicated branches (Figure 8). Combining the genetic distance
within and between groups of 2 undefined species of Channa and C. striata, into the
data of Genbank alignment and phylogeny tree, it can be concluded that SH Channa
and TH Channa are the same species with C. striata. These results indicate that C.
striata is a diversified species with 2 new phenotypes that are different in
morphological characteristics but similar in DNA barcoding.
9
Figure 8. The phylogeny tree of Channa striata, square head Channa and triangle
head Channa
4. DISCUSSION
The important finding of this study shows that the 2 undefined of Channa species
(SH Channa and TH Channa) are different in morphology but similar in COI
barcoding gene with C. striata. This finding is similar to the result of studies on
square head climbing perch and climbing perch in the Mekong Delta of Vietnam.
These strains of climbing perch had differences in the shape of head and the relative
gut length (Duong Thuy Yen and Truong Ngoc Trinh, 2013), but they were the same
species based on the COI gene sequence with 99-100% similarity (Duong Thuy Yen,
2014).
Morphology results show that SH Channa, TH Channa, and C. striata are different
in the shape of their head. The images of the head of these species (Figure 5) fit with
the common names called by farmers. It is consistent to previous study about two
new phenotypes of Channa species (TH Channa and SH Channa) of Nguyen Van
Hoa (2008). This previous study concluded that the differences in morphology of TH
Channa and SH Channa were the shape of the head, but it was fairly and unclear.
The reasons are that the differences in the external characteristics were not clear, and
the ratio of measurable parameters was different from only 21.1 to 42.1%. The
morphological variation can be explained by the effects of environment such as types
of feed and environmental conditions. A study on East African cyprinid (Barbus
neumayeri) also reported the same phenomenon. Water flow and dissolved oxygen
directly influenced relative gill size, body shape and caudal fin shape of Barbus
neumayeri (Langerhans et al., 2007). In addition, living conditions also affect to the
expression of morphological characteristics. Haas et al., 2010 reported that
Cyprinella venusta from the reservoirs had deep-bodied and smaller head, a more
anterior dorsal fin, a shorter dorsal fin base and a more ventral position of the eyes
than individuals inhabiting streams. Those findings indicate that physical
characteristics of the reservoirs changed the morphology of fish living in it. The
shape of head can be one of the most divergent morphological characteristics, as
observed in six populations of Clarias gariepinus collected from different rivers
systems in Turkey. The reasons of those divergences came from differential
environmental conditions such as temperature, turbidity, food availability, and water
depth (Turan et al., 2005).
10
The result indicates that C. striata is more diverse in morphology and COI sequence
compared to the other species of Channa genus. It would be interesting to compare
COI sequence of C. striata in Vietnam with the same species in different regions in
Asia using data in Genbank and Boldsystem (Figure 9).
Figure 9. The phylogeny tree of Channa striata by regions
C. striata in Vietnam is in the same branch with C. striata in Thailand. It is also
genetically closer to the same species in the Philippines compared to in Malaysia and
Indonesia. This can be explained by the countries that Mekong River flows through.
Vietnam and Thailand are in The Indochinese Peninsula. This is the first part of
Southeast Asia, while the second part is Malay Archipelago with Indonesia and
Malaysia. Therefore, the snakehead species in Vietnam is more different from those
distributed in these two countries.
Another important result of the study is the phylogeny relationship among Channa
species in the Mekong Delta of Vietnam. There were no studies on all species of
Channa genus in the Mekong Delta before. Therefore, this study gave a clear
relationship of all Channa species found in the Mekong delta through the
phylogenetic tree to help for conservation and culture activities. A previous study by
Nguyen Van Hoa gave different phylogenetic results which could be mistaken. The
author based on cytochrome b and concluded that C. striata had lower genetic
distance with C. lucius (0.015) and far from C. gachua (0.193). Meanwhile, the
genetic distance based on COI between C. striata and C. lucius is 0.2354 ±0.0192
The differences may due to the number of sample of each species in Hoa‟s study
only 1 sample with low quality of sequence. Furthermore, previous study did not
combine the gene sequences of C. micropeltes and did not compare the gene
sequences of TH Channa and SH Channa so it could affect to the result. In our
study, one DNA gene sequence of each Channa species that had the highest
percentage of identity with the aligned species was chosen to compute the genetic
distance and the phylogeny tree. The result does not change, indicating it is robust.
This study also has similar in the ranges of genetic divergence with a study about
cytochrome b of phylogeny of Channa species in Malaysia (Bui Minh Tam et al.,
2007). The intra-species was low from 0.004 – 0.006, while the inter-specific
variation ranged 19.7 – 27.5% depending on each species pair. The difference of the
study in Malaysia was the appearance of 2 species (C. melasoma and C. marulioides)
that have not been found in Viet Nam. This study provides more evidence that COI
barcoding gene is a powerful tool to complement to traditional taxonomic method.
Especially, 2 new species of Channa are hard to classify based on external
characteristics. Moreover, the genetic distance between species is higher than within
species, so it is easy to distinguish among species in Channa genus. A study on
Cuban freshwater fishes also used DNA barcoding (COI) to have a general view
about fish species to help protect species and ecosystem in Cuba. Similar to our
11
result, the genetic distance between species of Gambusia genus found in Cuba is
from 0.016 to 0.181, with at least 4 cryptic species (Ariagna et al., 2009).
5. CONCLUSION AND RECOMMENDATION
5.1 Conclusion
TH Channa and SH Channa are the same species with C. striata evidenced by
similar countable traits and high identity of COI sequence, although they are
different in the shape of head. Therefore, C. striata is more within-species diversified
compared to the other species of Channa genus.
Four Channa species in the Mekong Delta create 2 large branches (C. striata – C.
gachua and C. micropeltes – C. lucius) in the phylogenetic tree based on COI
sequences. Genetic distance between species is large (0.1836 – 0.2449), therefore,
COI sequence can be used to easily classify Channa species.
5.2 Recommendation
− Further studies on the reasons leading to the differences in morphology of these
phenotypes of C. striata including SH Channa, TH Channaand Projected lip
Channa.
− Applying DNA barcoding genes on classification of other species that are
difficult to distinguish by morphological methods such as Glossogobius genus of
Gobiidae family.
ACKNOWLEDGEMENT
I want to express my special thanks to Ms. Pham Thi Trang Nhung and all of my
classmates who always instructed me, helped me, gave me useful advices, and
encouraged me during doing this study.
REFERENCES
Ariagna L, Jose Luis Ponce De Leo N, Rodet Rodri´Guez, Didier Casane, Guillaume
Co Te, Louis Bernatchez and Erik Garci A-Machado, 2010. DNA barcoding of
Cuban freshwater fishes: evidence for cryptic species and taxonomic conflicts.
Molecular Ecology Resources. 10: 421-430.
Bui Minh Tam, Ambok Bolong Abol-Munafi, Mohd Azmi Ambak, and Patimah
Ismail, 2007. Molecular Data from the Cytochrome b for the Phylogeny of
Channidae (Channa sp.) in Malaysia. Biotechnology 6. 1: 22-27.
Dasgupta, M., 2000. Adaptation of the alimentary tract to feeding habits in four
species of fish of the genus Channa. Indian J. Fish. 47 (3): 265-269.
Duong Thuy Yen, 2014. Sequence comparison of DNA barcoding genes between
new phenotype and wild strains of climbing perch (Anabas testudineus BLOCH,
1792). Scientific Journal, Can Tho University. 30: 29-36.
Duong Thuy Yen and Truong Ngoc Trinh, 2013. Morphological comparison between
new phenotype and wild strains of climbing perch (Anabas testudineus).
Scientific Journal, Can Tho University. 29: 86-95.
Haas, T.C., Blum, M.J., Heins, D. C., 2010. Morphological responses of a stream
fish to water impoundment. Biology letters. 803-806.
Hebert, P. D. N., Cywinska, A., Ball, S. L. and Waard, J. R., 2003. Biological
identifications through DNA barcodes. Proc. R. Soc. B. 270: 313–322.
Hui-Ling Ko, Yu-Tze Wang, Tai-Sheng Chiu, Ming-An Lee, Ming-Yih Leu, Kuang-
12
Zong Chang, Wen-Yu Chen, Kwang-Tsao Shao, 2013. Evaluating the Accuracy
of Morphological Identification of Larval Fishes by Applying DNA Barcoding.
PLOS ONE. 8: e53451.
Langerhans, R. B., Chapman, L. J., and Dewitt, T.J., 2007. Complex phenotype–
environment associations revealed in an East African cyprinid. Journal of
Evolutionary Biology. 20: 1171–1181.
Nguyen Bach Loan and Hirata Y., 2002. Study on diversity of snakehead fish species
(genus Channa Block, 1797) in Dong Thap, An Giang and Ca Mau province,
Vietnam. In: Proceedings of the Final Workshop on “Improvement of
Environmental Education in Agricultural Sciences”. College of Agriculture,
Cantho University. 136 – 141.
Nguyen Van Hoa, 2008. Comparing Channa sp. in the Mekong Delta using
morphology method and PCR mtDNA. Master thesis – College of A quaculture
and Fisheries, Can Tho University. 60 pages.
Nguyen Van Trong and Lam Ngoc Chau, 2005. Analyze morphology of Projected lip
Channa and natural Channa in the Mekong Delta, Vietnam. Mekong Delta
Fisheries Collection. Agricultural Publisher, Ho Chi Minh City. 554: 226-241.
Nikolsky, G. V., 1963. The Ecology of Fishes. Academic press, London. Page 352.
Rainboth, W.J. , 1996. Fishes of the Cambodian Mekong. FAO Species Identification
Field Guide for Fishery Purposes. FAO, Rome. 265 pages.
Steinke, D., Zemlak, T.S., Hebert, P.D.N., 2009. Barcoding Nemo: DNA-based
identifications for the ornamental fish trade. PLoS ONE 4: e6300.
Taggart, J.B., Hynes, R.A., Prodohl, P.A., Ferguson, A., 1992. A simplified protocol
for routine total DNA isolation from salmonid fishes. J Fish Biol, 1992; 40:963965.
Tran Dac Dinh, Shibukawa Koichi, Nguyen Thanh Phuong, Ha Phuoc Hung, Tran
Xuan Loi, Mai Van Hieu and Utsugi Kenzo, 2013. Fishes of the Mekong Delta,
Viet Nam. Can Tho University Publisher. 174 pages
Truong Thu Khoa, Tran Thi Thu Huong, 1993. Identification of freshwater fish,
Mekong Delta. College of Aquaculture and Fisheries, Can Tho University. 361
pages.
Turan, C., Yalcin, S., Turan, F., Okur, E. & Akyurt, I., 2005. Morphometric
comparisons of African catfish, Clarias gariepinus, populations in Turkey. Folia
Zool. 54(1-2): 165-172.
Ward, R. D., Zemlak, T. S., Innes, B. H., Last, P. R. & Hebert, P. D. N. , 2005.
Barcoding Australia‟s fish species. Philosophical Transactions of the Royal
Society of London. B360: 1847–1857.
Zemlak, T.S., Ward, R.D., Connell, A.D., Holmes, B. H., Hebert P. D. N., 2009.
DNA barcoding reveals overlooked marine fishes. Molecular Ecology Resources.
237–242.
13