Expression and characterization of FAT1 and atrophin 1 proteins regulating planar cell polarity and MBD1 protein involved in lymphoma
Bạn đang xem bản rút gọn của tài liệu. Xem và tải ngay bản đầy đủ của tài liệu tại đây (2.08 MB, 92 trang )
EXPRESSION AND CHARACTERIZATION OF
FAT1AND ATROPHIN 1 PROTEINS REGULATING PLANAR
CELL POLARITY AND MBD1 PROTEIN INVOLVED IN
LYMPHOMA
ANUPAMA VAASUDEVAN
A THESIS SUBMITTED FOR
THE DEGREE OF MASTER OF SCIENCE
DEPARTMENT OF BIOLOGICAL SCIENCES
NATIONAL UNIVERSITY OF SINGAPORE
2008
EXPRESSION AND CHARACTERIZATION OF
FAT1AND ATROPHIN 1 PROTEINS REGULATING PLANAR
CELL POLARITY AND MBD1 PROTEIN INVOLVED IN
LYMPHOMA
ANUPAMA VAASUDEVAN
(B.E.)
A THESIS SUBMITTED
FOR
THE DEGREE OF MASTER OF SCIENCE
DEPARTMENT OF BIOLOGICAL SCIENCES
NATIONAL UNIVERSITY OF SINGAPORE
2008
ACKNOWLEDGEMENT
In the words of Ludwig Wittgenstein “Knowledge is in the end based on
acknowledgment.” The entire process of my knowledge acquisition would be incomplete
without due recognition of each and every contributing member.
I would start by thanking my P.I. Dr. K Swaminathan. To me, as a novice at
research, he provided me with flexibility. He was extremely encouraging and patient at
all times and helped me learn things very clearly. His excellent teaching of the basics of
crystallography has helped me understand a tiny spec of this vast interesting topic and
appreciate the need to solve structures to understand the working of complex protein
pathways. The two projects that I worked on were not only of high biological
significance, but also empowered me with the ability to think, plan independently, which
is the hallmark of a true researcher. I would thus wholeheartedly like to thank him for this
enriching experience that I experienced as a part of his lab.
I would proceed to thank the two collaborators, Professors Sarah Miller and
Mariusz Wasik from the University of Pennsylvania for providing me with the initial
mRNA, to start my project.
All my labmates have played a vital role in my journey as a graduate student. No
words suffice to thank them for providing such a pleasant environment throughout:
Vindhya for being my friend and confident always while Shiva and Kuntal deserve a
special word of thanks. Starting out together, I remember all the times we troubleshooted
and brainstormed solutions for each other, the great camaraderie we shared and
i
enjoyment both at lab and outside it. I thank Pankaj for his help, especially during my
pre-thesis defense and Toan for his cheerful spirit, for enlivening me at all times.
A note of thanks to all members of Lab 5 for always being responsive to any
technical doubt I have had. I thank Karthik for teaching the basics of CD and helping me
with valuable suggestions at all time. I owe big thanks to my friends Sunita, Sujatha,
Nilofer, Ambalika, Gayathri, Suguna, Kripa, Suketa, Rashmi and all the others both at
NUS and outside for playing a very sweet and special role in making my stay in
Singapore extremely enjoyable and pleasant.
A huge thanks to my cousin Mahalakshmi and her family, for providing me a
home away from home, for always being there for me and being the lovable elder sister I
always wanted.
Finally I would like to dedicate this thesis to my parents and thank them, for being
my support system and backbone, through good and trying times and for the
unconditional love they have showered on me. Thank you amma and appa for everything.
ii
TABLE OF CONTENTS
Page
Acknowledgement
i
Table of contents
ii
Summary
ix
List of Abbreviations
xi
List of Figures
xiii
List of Tables
xvi
CHAPTER 1
MACROMOLECULAR X-RAY CRYSTALLOGRAPHY
1.1
Protein Structure Determination
1
1.2
Protein crystallography
1
1.2.1 X-ray crystallography of proteins
2
1.3
2
Basic Concepts in Crystallography
1.3.1 Unit-cell and lattices
2
1.3.2 Symmetry, point groups and space groups
3
1.3.3 Crystals and X-rays
4
1.3.4 X-Ray Diffraction
5
1.3.5 Bragg’s Law
5
1.3.6 Reciprocal Lattice and Ewald sphere
6
1.3.5.1 Ewald sphere
6
iii
1.3.7 Fourier transform, structure factor and phase Problem
7
1.4
Geometric Data Collection
7
1.5
Structure Determination
9
1.5.1 Phasing Techniques
9
1.5.1.1 Direct method
9
1.5.1.2
Molecular replacement
9
1.5.1.3
Multiwavelengh isomorphous replacement
9
1.5.1.4 Anomalous Dispersion
1.5.2 Model building and refinement
1.5.2.1 R Factor
1.5.3 Validation and presentation
10
10
11
11
1.5.3.1
Ramachandran Plot
11
1.5.3.2
Folding profile methods
12
CHAPTER 2
BIOLOGICAL BACKGROUND
2.1
Cell Signaling
13
2.2
WNT Signaling Pathway
13
2.2.1 Classification of Wnt pathways
14
2.3
16
Planar Cell Polarity (PCP)
2.3.1 Biological significance
16
2.4
17
Fat 1
iv
2.4.1 Architecture of Fat1
18
2.5
19
ATROPHIN 1
2.5.1 Architecture of Atrophin 1
20
2.6
21
Role of Fat and Atrophin1 in PCP
2.6.1 Domains of interest
23
2.7
24
DNA Methylation
2.7.1 Components of DNA methylation
25
2.8
25
Methyl Binding Domain Protein 1
2.8.1 Domain architecture of MBD1
26
2.8.2 Biological significance of MBD1
27
2.9
27
OBJECTIVE
CHAPTER 3
3.1
MATERIALS AND METHODS
Cloning Of C-Terminal Fat1 and Atrophin1
30
3.1.1 Cloning of C-terminal Fat1
30
3.1.2 Cloning of C-terminal Atrophin1
31
3.1.3 Blue white colony screening
32
3.2
33
Subcloning Of Fat1 and Atrophin1
3.2.1 Touch up PCR for Fat1 and Atrophin1
33
3.2.2 Double digestion, phenol-chloroform purification and ligation of Fat1
33
3.2.3 Digestion, Phenol Chloroform extraction and Ligation of Atrophin1
35
3.3
35
PROTEIN Expression And PurificatiON
3.3.1 Expression of Fat1
35
v
3.3.2 Purification of Fat1
36
3.3.2.1 Affinity Purification
36
3.3.2.2
36
Size exclusion chromatography
3.3.3 Dynamic Light Scattering
37
3.3.4 Crystallization
37
3.4
37
Expression and Purification of Atrophin1
3.4.1 Expression analysis of Atrophin1 cloned in pQE30
37
3.4.2.1
Affinity purification and refolding
38
3.4.2.2
Slow dilution and reverse phase HPLC
38
3.4.2.3
Circular dichrorism
39
3.4.2 Expression and Purification of Atrophin1 cloned in pET32A
3.4.2.1
39
Expression
39
3.4.2.2 Affinity purification
39
3.423.3 Size exclusion chromatography
40
3.4.3 Thioredoxin tag cleavage
40
3.4.4 Dynamic Light Scattering
40
3.4.5 Crystallization set up
41
3.5
41
Cloning and Expression of MBD1
3.5.1 Cloning of MBD1
41
3.5.2 Expression of MBD1
42
CHAPTER 4
RESULTS AND DISCUSSION
vi
4.1
Cloning of Fat1 and Atrophin1
43
4.2
Expression of Fat1 and Atrophin1
47
4.2.1 Expression of Fat1
47
4.2.2 Expression of Atrophin1
48
4.2.2.1 Final Expression
48
4.3
50
Purification of Fat1
4.3.1 Affinity purification and Size exclusion Chromatography
50
4.3.2. Dynamic light scattering
52
4.3.3 Maldi-TOF and peptide mass finger printing
54
4.4
55
Purification of Atrophin1
4.4.1 Refolding of Atrophin 1
55
4.4.1.1 Denaturation ,Refolding and Purification
55
4.4.1.2 Circular Dichrorism
57
4.4.2 Final Expression using pET32 construct
58
4.4.2.1 Affinity purification and size exclusion chromatography
58
4.4.3 Dynamic Light Scattering and Thioredoxin Tag Cleavage
60
4.4.4 Peptide mass finger printing
61
4.5
62
Cloning Methyl Binding Domain Protein 1
4.5.1 Subcloning of MBD1
62
4.5.2 MBD1 expression
62
CHAPTER 5
CONCLUSION AND FUTURE STUDIES
vii
5.1
Conclusion
65
5.2
Future directions
67
5.2.1 Fat1 and Atrophin1
67
5.2.2 MBD1
68
REFERENCES
APPENDIX
viii
SUMMARY
Fat, the first tumor suppressor gene to be discovered in Drosophilla melanogester,
is one of the most important regulators of planar cell polarity which controls the
directional alignment of hair bristles and photoreceptors in the eyes of Drosophilla. The
mammalian counterpart of Fat known as Fat1 has been found to play a vital role during
cerebral development, glomerular slit formation and gastrulation. Atrophin1 (also known
as grunge) is a nuclear receptor which is predominately found in the nucleus but
sometimes shuttles to the cytoplasm. The C-terminus of Atrophin is shown to interact
with the C-terminal domain of Fat in the regulation of planar cell polarity. The precise
role of these two important molecules in planar cell polarity is yet to be fully understood.
Apart from its role in the Fat-Atrophin complex, Atrophin1 like proteins have been
implicated in Dentatorbral Pallidoluysian Atrophy, is a dominantly inherited neuronal
degenerative disease characterized by the variable combination of ataxia epilepsy and
dementia. The disease is caused by the expansion of a polyglutamine tract with a
Atrophin1 protein. The structures of the C-terminal domains of Fat1 (160 a.a.) and
Atrophin1 (196 a.a.) from Mus musculus (to be solved, separately and for their complex,
using X-ray crystallography) will provide a pedestal for understanding the roles of Fat1
and Atrophin1 in the mechanism of regulation in planar cell polarity.
MBD1 or Methyl binding domain 1 protein belongs to the class of Methyl CpG
binding proteins (MBD 1-4 and MeCP2).The sequence similarity of these proteins is
ix
restricted only in their MBD domain, thus highlighting different roles. MBD1 has
additional TRD and Zinc finger domains, which bind to non-methylated DNA and silence
them, while the MBD domain silences hypermethylated DNA. The dual DNA binding
capacity of MBD1 is of great importance in understanding tumorigenesis, very little of
which is currently known. The solution structure of the human MBD domain in complex
with DNA has been solved. Currently, we are cloning full length MBD1 (605 a.a.) from a
human lymphoma cell line into the p Fast Bac Htb vector for baculovirus expression.
x
LIST OF ABBREVIATIONS
a.a.
Amino acids
bp
Base pairs
CCD
Charged coupled device
CpG
Cytosine –phosphodiester –Guanosine
DTT
Dithiothreitol
GST
Glutathione-S-Transferase
His
Histidine
HPLC
High performance liquid chromatography
i.e.
That is
IPTG
Isopropyl β-D-1-thiogalactopyranoside
JNK
Jun- N- Kinases
kDa
Kilo Dalton
Maldi Tof
Mass assisted laser desorption ionization Time of Flight
MBD
Methyl Binding Domain Protein
mFat
Mouse Fat
NR
Nuclear Receptors
PCP
Planar Cell Polarity
PCR
Polymerase chain reaction
PMSF
Phenyl Methyl Sulphonyl Fluoride
Q Tof
Quadruple Time of Flight
RT-PCR
Reverse Transcriptase polymerase chain reaction
xi
RPHPLC
Reverse phase high performance liquid chromatography
SDS-PAGE
Sodium deodecyl sulphate polyacrylamide gel electrophoresis
TFA
Trifluroacetic acid
xii
LIST OF FIGURES
Page
CHAPTER 1
Figure 1.1
A protein crystal
2
Figure 1.2
Bravais Lattice
4
Figure 1.3
Interference of Two waves
5
Figure 1.4
Reciprocal space lattice and Ewald sphere
6
Figure 1.5
Anatomy of X-ray diffractometer
8
Figure 2.1
The two Wnt pathways
15
Figure 2.2
Domain architecture of Fat, a tumor suppressor cadherin
19
Figure 2.3
Domain architecture of Atrophin1 like protein
21
Figure 2.4
Depicts the planar cell polarity in the compound eye of
CHAPTER 2
the Drosophila
21
Figure 2.5
Fat and Atrophin interaction
22
Figure 2.6
Comparison between the Drosophila Atrophin and the
two Atrophins in humans
24
Figure 2.7
Domain architecture of MBD1
26
Figure 2.8
The mechanism of gene silencing and tumorigenesis
27
CHAPTER 4
xiii
Figure 4.1
Subcloning Fat1
44
Figure 4.2
Verification of Fat1 clones using double digest
45
Figure 4.3
Subcloning of Atrophin1 using Touch up PCR
45
Figure 4.4
Double digest verification of Atrophin1 clones in
different vectors
46
Figure 4.5
Expression check of Fat1
47
Figure 4.6
Expression check of Atrophin1 in different vectors
49
Figure 4.7
Final expression of Atrophin 1 in pET32A
50
Figure 4.8
Purification of Fat1 sing TALON resin
51
Figure 4.9
FPLC profile of Fat1
51
Figure 4.10
DLS and native gel profile of Fat1
53
Figure 4.11
Mass determination and verification of Fat1
54
Figure 4.12
Refolding of Atrophin1
56
Figure 4.13
CD spectrum of refolded Atrophin1 at 25μM
58
Figure 4.14
Purification of Atrophin1 using TALON matrix
59
Figure 4.15
The FPLC profile for purification of Atrophin1
59
Figure 4.16
DLS profile of Atrophin1 with Thioredoxin Tag
60
Figure 4.17
Pilot scale Trx-tag cleavage
61
Figure 4.18
Peptide mass fingerprinting of Atrophin1
62
Figure 4.19
Gradient PCR of MBD1 from pGem T-Easy
63
Figure 4.20
Double Digest verification of pET32a:MBD1
63
Figure 4.21
Expression check of MBD1
64
xiv
CHAPTER 5
Figure 5.1
Proposed possible interaction of Fat
66
Figure 5.2
Role of MBD’s in tumorigenesis
66
xv
LIST OF TABLES
Page
CHAPTER 3
Table 3.1
Primers used for cloning of Fat1 into pQE30 and
31
pET Duet vectors and Atrophin1 into respective
vectors
Table 3.2
Primers for pET14b,pET32a and pFas Bac Htb
Of MBD1
41
xvi
CHAPTER 1
MACROMOLECULAR X-RAY CRYSTALLOGRAPHY
1.1
PROTEIN STRUCTURE DETERMINATION
The causative agents of most diseases like cancer and Alzheimer’s are
proteins. As basic cell constituents and regulatory players, proteins are indispensable
part of the human body and its functions. The function of a protein can be fully
appreciated only when we have a complete knowledge of its 3-dimensional structure,
as structure and function go hand in hand to provide a complete picture.
Currently, Nuclear Magnetic Resonance (NMR) and X-ray crystallography are
two of the most popular methods used for protein structure determination at atomic
details. X-ray crystallography has an advantage over NMR, which poses a restriction
on protein size that can be solved. Even though around 35,000 protein structures have
been solved, this number is only a small fraction of the thousands of proteins whose
structures are waiting to be determined.
1.2
PROTEIN CRYSTALLOGRAPHY
Crystallography is the study of atomic arrangements in crystals and minerals.
With the help of X-ray diffraction, it has been used as a method to determine the
structure (or atomic distribution) of several molecules. Crystallization is one of the
several means (including nonspecific aggregation/precipitation) by which a
metastable supersaturated solution can reach a stable lower energy state by reduction
of solute concentration (Weber, 1991). The three stages of crystallization that are
common to all molecules are nucleation, growth, and cessation of growth.
1
1.2.1
X-ray crystallography of proteins
Earlier studies of crystallography were primarily based on the geometry of
crystals. After 1912, structure determination depends on the study of diffraction
patterns produced when a crystalline sample is irradiated by X-rays (and neutrons in
some cases). The diffraction pattern obtained in X-ray crystallography is due to the
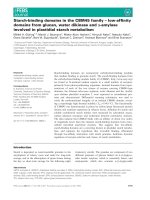
scattering of X-rays by the electron in the sample. However, the protein of interest has
to be crystallized first (Fig. 1.1) because of the ordered arrangement of atoms,
obeying certain symmetry, in a crystal.
Figure 1.1.
A Protein Crystal
1.3
BASIC CONCEPTS IN CRYSTALLOGRAPHY
1.3.1
Unit-cell and lattices
A crystal consists of a large number of molecules, which are arranged in a
particular manner. A regular pattern of arrangement of an array of points periodically
in three dimensional spaces is known as a lattice. In a crystal, a unique volume of
space, which is repeated in three dimensions, is called a unit-cell. If each box is
represented by a point, then the arrangement of all unit-cells will form a lattice. Even
though every crystal has a reduced unit–cell (minimum volume), in some crystals we
select a bigger unit-cell (that would include smaller unit-cells), which would satisfy
the full symmetrical needs of the crystal. The least volume unit-cell, which is the
2
natural unit-cell in several crystals, is called the primitive unit-cell and the bigger
unit-cell in some selected cases is called a centered unit-cell.
The geometry of a unit-cell is defined by three non-coplanar axes (a, b, c) and
their inter-axial angles (α, β, γ). A crystal system is named after the symmetrical
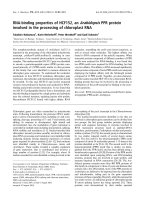
requirements of that system and it adopts the corresponding unit-cell. The seven
systems are triclinic, monoclinic, orthorhombic, tetragonal, trigonal, hexagonal, and
cubic. While all other systems use the corresponding unit-cell, the trigonal system
uses either a hexagonal unit-cell or a rhombohedral unit-cell, depending on the
symmetry of that particular crystal. These seven systems, depending on the use of the
corresponding unit-cell, produce 14 Bravais lattices (Fig. 1.2).
1.3.2
Symmetry, point groups and space groups
Symmetry in a crystal can be defined as the arrangement of atoms occupying
minimum volume, identical and repeats itself throughout the crystal. There are three
types of symmetry operations in crystallography, rotation, reflection and inversion.
The rotational symmetry needs an axis to act upon and produces identical images of
an object, around the axis. The number of images generated in crystallography by the
rotational symmetry can be 1, 2, 3, 4 or 6. The reflection symmetry acts upon a plane
and inversion occurs through a point. The 32 point groups in crystallography
describe the unique combinations of these symmetry elements (without any
translational component applied to them) in all unit-cell. When a translational
component is applied to the symmetry operations rotation and reflection, two
additional types of symmetry, the screw axis and the glide plane, are generated. The
complete description of a crystal, including the crystal system, lattice type and
symmetry elements, is known as the space group of that crystal. There are 230 space
3
groups in crystallography and proteins crystallize only in 65 space groups (without
inversion and reflection) that do not warrant the need for D amino acids.
Figure 1.2.
1.3.3
The Bravais lattices (figure adopted from www.infosteel.net)
Crystals and X-rays
Visible light has the advantage of being focused by a lens and thus it can
produce an enlarged image of an object. X-rays, on the other hand cannot be focused.
However, the electrons in a crystal diffract X-rays and virtually we look at the
structure of electron distribution. The objective in X-ray crystallography is to grow
crystals to an optimum size and quality for study by diffraction. Crystals are generally
grown to 0.1-0.3mm by using different techniques. In case of small molecules,
crystals are easier to form than proteins. This is due to the complexity of protein
4
molecules and their low availability. Protein crystals are grown by several techniques,
including the most common vapor diffusion (hanging drop and sitting drop method)
and batch methods.
1.3.4
X-Ray Diffraction
X-ray diffraction is best explained if the radiation is taken as a wave, Eq. 1.1.
E=Asinωt
(Eq. 1.1)
Where A is the amplitude, ω is circular velocity, t is time and E is the energy of the
wave. X-rays interact with matter and get scattered in all directions. These scattered
rays travel different length as they originate from different places in a crystal. They
differ from one another with respect to their phase and amplitude. Two waves interact
constructively when they are in phase (their amplitudes are magnified as the sum of
the two waves) while the resultant wave decreases in amplitude if the waves are out of
phase (Fig. 1.3).
a
b
Figure 1.3.
1.3.5
Interference of two waves (a) constructively and (b) destructively.
Bragg’s law
In crystals, atoms diffract X-rays. Each reflection is the combined effect of
waves diffracted by all atoms in the crystal, governed by a set of parallel and equally
spaced planes that slice all unit-cells in that particular orientation. According to
Bragg’s law when X-rays with a wavelength λ are incident on a set of planes with
Miller indices hkl (where h, k, l are the integral divisions of the unit-cell axes a, b, c,
5
respectively) and interplanar spacing of dhkl at an angle θ, they will produce a
diffracted beam only if θ meets the following condition, Eq.1.2.
2 dhkl sinθ = nλ
(Eq. 1.2)
where n is an integer (Rhodes, 2000).
1.3.6
Reciprocal lattice and Ewald sphere
A set of parallel planes with Miller indices hkl in real space is related to a
point (hkl) in the reciprocal space. The direction of the reciprocal vector corresponds
to the plane normal and the magnitude of the reciprocal vector is equal to the
reciprocal of the interplanar spacing of the real space planes.
1.3.6.1 Ewald sphere
Bragg’s law can be rearranged in the reciprocal space using Eq. 1.4.
Sinθ = λ/2dhkl = (1/dhkl) / (2/λ)
(Eq. 1.4)
The aim of the Ewald sphere is to determine which set of real space planes
(represented by the grid points on the reciprocal space) will result in a diffracted
signal for a given wavelength, λ, of incident radiation (Fig. 1.4).
Figure 1.4.
Reciprocal space lattice and the Ewald sphere
6
1.3.7
Fourier transform, structure factor and phase problem
The diffraction pattern of atoms in a crystal is related to the atomic
arrangement through their Fourier transforms. Thus the electron density at any point
in the unit-cell can be calculated by Eq. 1.5
ρ (x, y, z) =1/V ∑∑∑ Fhkl e-2πi (hx+ky+lz)
(Eq. 1.5)
Through this equation, we transform the diffraction effect in inverse space to real
space electron density at every point x, y, z. In the above equation, if the structure
factor Fhkl is known, we can calculate the atomic positions and thus the real structure.
However, in crystallography to calculate the structure factor Fhkl, we need to know the
atomic positions. The reverse Fourier transform of the structure factor equation, will
give back the atomic position which is our ultimate aim, i.e. to ascertain the location
of every atom in the structure from their diffraction pattern. This statement sounds
illogical. In order to calculate the position of an atom in a structure we need to know
two parameters about a diffracted wave: amplitude and the phase. While the
amplitude is calculated from the intensity of a reflection, the phase of the wave, which
depends on the positions of all atoms with respect to the origin of the unit-cell, is not
measurable. This non-availability of phases is called the ‘phase problem’ in X- ray
crystallography.
1.4 GEOMERICAL DATA COLLECTION
For crystal structure determination, the intensities most of, if not all, the
diffracted beams must be measured. All corresponding reciprocal points must be
bought to diffracting positions by rotating the crystal. First, the geometry of
diffraction which includes the shape, size and symmetry information, is confirmed.
7