Capillary and microchip electrophoresis for the analysis of small biomolecules
Bạn đang xem bản rút gọn của tài liệu. Xem và tải ngay bản đầy đủ của tài liệu tại đây (540.82 KB, 95 trang )
CAPILLARY AND MICROCHIP ELECTROPHORESIS
FOR THE ANALYSIS OF SMALL BIOMOLECULES
ELAINE TAY TENG TENG
NATIONAL UNIVERSITY OF SINGAPORE
2008
I
CAPILLARY AND MICROCHIP ELECTROPHORESIS FOR
THE ANALYSIS OF SMALL BIOMOLECULES
ELAINE TAY TENG TENG
(B.Sc. (Hons), NUS)
A THESIS SUBMITTED
FOR THE DEGREE OF MASTER OF SCIENCE
DEPARTMENT OF CHEMISTRY
NATIONAL UNIVERSITY OF SINGAPORE
2008
II
ACKNOWLEDGEMENTS
Foremost, I would like to express my gratitude to my supervisor, Prof Sam Li
Fong Yau. For the past few years, he had showered me with encouragement and
valuable advices in various aspect of my MSc work despite his hectic schedule. In
addition, Prof Li had provided me with plenty of opportunities to acquire new
analytical and instrumental skills as well as encouraged me to attend overseas
conferences to gain greater exposures to the research arena. For all these, I am
grateful for his support.
My enriching and pleasant MSc research experience was also attributed to the
guidance and assistance provided by my mentors and lab mates in Prof Sam Li’s
research group. I would like to express special appreciation to Wai Siang, Hiu Fung
and Guihua who had often set aside time to discuss and troubleshoot tricky problems
encountered during my MSc research work. Their jokes and laughter provided me
relief during this stressful period.
I would also like to express my immense gratitude to my friends, Seah Ling
and Kim Huey, and my family for their love, understanding and moral support
throughout the course of my studies. They listened to my grumbles patiently and had
been tolerant with my long working hours in research lab.
Last but not least, I would also like to show my appreciation to NUS for
providing me with a research scholarship that had financed my study throughout my
MSc research term. My heartfelt thanks to the NUS technical staff from CMMAC,
Lab Supply and Department of Chemistry, in particularly Mdm Frances, Ms Tang,
Mdm Han, Suria and Agnes, for aiding me in various aspects of my MSc research
project and administrative work.
III
Table of Contents
Acknowledgements .................................................................................. I
Table of Contents .................................................................................... II
Summary ............................................................................................... VI
List of Tables ...................................................................................... VIII
List of Figures ....................................................................................... IX
List of Schemes ...................................................................................... XI
List of Symbols ...................................................................................... XII
CHAPTER 1 Electrophoresis of Small Biomolecules ........................... 1
1.1 Principles of capillary electrophoresis ........................................................... 1
1.2 Microchip capillary electrophoresis ............................................................... 5
1.3 Analysis of small biomolecules.................................................................... 10
1.4 Project Objectives ........................................................................................ 12
1.5 References .................................................................................................... 13
CHAPTER 2 Analysis of Adenosine ..................................................... 16
2.1 Importance of the adenosine analysis........................................................... 16
2.2 Liquid-liquid extraction of adenosine .......................................................... 17
2.2.1 Liquid-liquid extraction using ionic liquid .......................................... 17
IV
2.2.2 Target specific liquid-liquid extraction with ionic liquid-aptamer ...... 20
2.3 Experimental ................................................................................................ 23
2.3.1 Materials and apparatus ....................................................................... 23
2.3.1.1 Instrumentation ........................................................................ 23
2.3.1.2 Reagents and chemicals ........................................................... 23
2.3.2 Microwave Synthesis of 1-butyl-3-methylimidazolium chloride ....... 24
2.3.3 Analysis of 1-butyl-3-methylimidazolium based ionic liquid via CEUV ....................................................................................................... 25
2.3.4 Synthesis of 1-butyl-3-methylimidazolium based ionic liquid ........... 25
2.3.5 Synthesis of 1-butyl-3-methylimidazolium hexafluorophosphate ...... 27
2.3.6 Liquid-liquid extraction of adenosine using 1-butyl-3methylimidazolium based ionic liquid-42-mer extractant ................. 27
2.3.7 CE-UV analysis of adenosine ............................................................. 28
2.4 Results and Discussion ................................................................................. 29
2.4.1 DNA aptamer of adenosine .................................................................. 29
2.4.2 Synthesis of 1-butyl-3-methylimidazolium-2’-deoxycytidine-5’monophosphate .................................................................................... 30
2.4.3 Liquid-liquid extraction of adenosine using 1-butyl-3methylimidazolium based ionic liquid-42-mer extractant ................. 34
2.5 Conclusion ............................................................................................................. 41
2.6 References .............................................................................................................. 43
V
CHAPTER 3 Floating Resistivity Detector for Microchip
Electrophoresis ............................................................... 45
3.1 Microchip and its detection modes............................................................... 45
3.2 Conductimetry – universal detection method............................................... 49
3.3 Floating resistivity detector (FRD) ............................................................. 52
3.4 Working principles of floating resistivity detector ..................................... 53
3.5 Experimental ................................................................................................ 56
3.5.1 Materials and apparatus ....................................................................... 56
3.5.1.1 Instrumentation .......................................................................... 56
3.5.1.2 Reagents and chemicals............................................................. 56
3.5.2 Fabrication of microchip ...................................................................... 57
3.5.3 Designing and optimization of FRD microchip ................................... 58
3.5.4 Standard microchip electrophoresis procedures .................................. 60
3.6 Result and Discussion ................................................................................. 61
3.6.1 Optimized microchannel layout of FRD microchip............................. 61
3.6.2 Applications of FRD ............................................................................ 64
3.6.2.1 Metal cations analysis ............................................................... 64
3.6.2.2 Amino acids analysis ................................................................. 66
3.6.2.3 Biogenic amines analysis .......................................................... 67
3.7 Conclusion ................................................................................................... 69
3.8 References ................................................................................................... 70
VI
CHAPTER 4 Concluding Remarks ...................................................... 73
Appendices............................................................................................... 76
VII
SUMMARY
Capillary electrophoresis and its miniaturized counterpart, microchip capillary
electrophoresis are becoming increasingly popular analytical techniques among the
research groups due to the simple instrumental set-up, high throughput sensitive
analysis as well as low reagents and sample consumption while allowing analysis of
various analytes to reach up to ultra-trace level.
Thus, such analytical techniques are apt for the analysis of small biomolecules.
The quantitative analysis of small biomolecules in the body system allows better
understanding of a patient’s health since any health deterioration can be accompanied
by an abnormal changes in the level of these small biomolecules. However, these
small biomolecules are present in small amount in the human body such that their
analyses are often laborious due to the need for extensive sample preparation and
sensitive detection method. Such an analysis also impedes routine analysis. However,
with the high separation efficiency that can be expected from capillary electrophoresis
and its miniaturized counterpart, it can allow more analyses to be carried out on these
small biomolecules. Hence, a study with capillary electrophoresis (CE) and microchip
capillary electrophoresis (MCE) was chosen to be carried out on these biomolecules
in this work.
A target specific liquid-liquid extraction of an endogenous nucleoside,
adenosine, was investigated. The extraction served to aid in improving the detection
of adenosine via pre-concentrating the adenosine in a small volume of extractant.
Ionic liquid, a tunable stable solvent with negligible vapour pressure, was utilized as
an extractant in place of the toxic volatile organic solvents in this extraction. The
aptamer of adenosine, a polynucleotide with structural recognition for adenosine, was
further added into the ionic liquid extractant to assess any improvement in the latter’s
VIII
extraction for adenosine, a biomarker for inflammatory diseases and cell stress.
Various methods of obtaining the ionic liquid-aptamer based extractant were
attempted. The structure and quantity obtained were subsequently analyzed via
various spectroscopic methods as well as capillary electrophoresis. The extraction
efficiency of these extractants was then examined with a capillary electrophoresis
system coupled to an ultraviolet/visible detector due to adenosine’s UV-absorbing
nature.
In view of the non-UV absorbing property of many small biomolecules like
amino acids and biogenic amines as well as the need for rapid analysis, a novel
contact conductivity detection system for microfluidic devices was developed. This
detector served to provide a universal mode of detection while the microfluidic device
aided in enhancing the analytical throughput. Its detection principle was similar to
most conductivity detectors except that it measured with its “liquid electrode voltage
probes” that minimized fouling of the detection electrode surface and thereby
increasing the repeatability of analysis. Its analytical performance was consequently
evaluated with simple metal ions as well as in the separation of amino acids and
biogenic amines.
IX
LIST OF TABLES
Page
Table 2.1 The extraction efficiency of [C4MIM] based ionic liquid and [C4MIM]
based ionic liquid-42-mer extractants for adenosine in aqueous sample .... 39
Table 2.2 The extraction efficiency of [C4MIM] based ionic liquid and [C4MIM]
based ionic liquid-42-mer extractants for adenosine and its analogues
in aqueous sample ...................................................................................... 41
Table 3.1 The limits of detection of various modes of detection in MCE .................. 46
Table 3.2 The parameters and their respective conditions in the stepwise
optimization of the dimensions of the microchip detection window .......... 59
Table 3.3 The resolution between the respective peaks in the stepwise optimization
of the length between detection probe and buffer waste reservoir ............. 62
X
LIST OF FIGURES
Page
Figure 1.1 Schematic diagram depicting the basic setup of a capillary
electrophoresis system ................................................................................. 2
Figure 2.1 Representative cations used in the synthesis of ionic liquids .................... 19
Figure 2.2 Chemical structures of [C4MIM]OH and four nucleotides ...................... 22
Figure 2.3 Molecular recognition section of the 42-mer of adenosine ....................... 30
Figure 2.4 Chemical structure of adenosine................................................................ 30
Figure 2.5 Electrophereogram of varying concentrations of methylimidazole
and synthesized [C4MIM]OH .................................................................... 33
Figure 2.6 Electrophereogram of adenosine, dimethylsulfoxide and 42-mer ............. 36
Figure 2.7 Electrophereogram of adenosine, blank water and two-fold
acetonitrile diluted ionic liquid layer after extraction of adenosine .......... 36
Figure 2.8 Electrophereogram of adenosine and cytosine in various solvents .......... 37
Figure 2.9 Chemical structures of adenosine and its analogues ................................. 41
Figure 3.1 Schematic diagram depicting the arrangement of the microelectrodes
on the microchannel ................................................................................... 50
Figure 3.2 Schematic diagram of the circuit of the floating resistivity detector
microchip capillary electrophoresis system ............................................... 53
Figure 3.3 Schematic diagram of the floating resistivity detector microchip ............. 59
Figure 3.4 The peak intensity and resolution between the respective peaks in
the optimization of the length of the detection probe, Parameter 2 ........... 63
Figure 3.5 The peak intensity and resolution between the respective peaks in the
optimization of the length of the detection window, Parameter 3 ............. 64
XI
Figure 3.6 Electrophereogram of 4 metal cation standards determined by
microchip electrophoresis with floating resistivity detector ...................... 65
Figure 3.7 Electrophereogram of 4 amino acids determined by microchip
electrophoresis with floating resisitivity detector ...................................... 67
Figure 3.8 Electrophereogram depicting the effect of separation voltage on the
separation of biogenic amines .................................................................... 68
XII
LIST OF SCHEMES
Page
Scheme 2.1 Acid-base reaction between [C4MIM]OH and 42-mer of adenosine
......... 31
Scheme 2.2 Acid-base reaction between [C4MIM]OH and
2’-deoxycytidine-5’-monophosphate ...................................................... 33
XIII
LIST OF SYMBOLS
[C4MIM]: 1-butyl-3-
DNA: Deoxyribonucleic acid
methylimidazolium
DNase: Deoxyribonuclease
µ-CAE: Micro-capillary array
dsDNA: Double stranded
electrophoresis
deoxyribonucleic acid
µ-TAS: Micro-total analysis system
EA: Ethyl acetate
3-D: three-dimensional
ECEEM: Equilibrium capillary
AC: Alternating current
electrophoresis equilibrium
ACN: Acetonitrile
mixture
ATP: Adenosine triphosphate
EOF: Electroosmotic flow
BR: Buffer reservoir
ESMC: Electrolyte solution mediated
BuCl: 1-chlorobutane
contact
BW: Buffer waste reservoir
FRD: Floating resistivity detector
C4D: Capacitively coupled contactless
GC: Gas chromatography
conductivity detector
GC-MS: Gas chromatography-mass
CCD: Contact conductivity detector
spectrometry
CE: Capillary electrophoresis
HPLC: High performance liquid
CGE: Capillary gel electrophoresis
chromatography
CIEF: Capillary isoelectric focusing
HPLC-MS: High performance liquid
COC: Cyclic olefin copolymer
chromatography – mass
DA: “liquid electrode voltage probe” A
spectrometry
DAQ: Data acquisition
ILs: Ionic liquids
DB: “liquid electrode voltage probe” B
IPA: Isopropyl alcohol
DC: Direct current
ISE: Ion-selective electrode
deoxyAMP: 2’-Deoxyadenosine-5’-
LC-MS: Liquid chromatography –
monophosphate
mass spectrometry
deoxyCMP: 2’-Deoxycytosine-5’-
LIF: Laser induced fluorescence
monophosphate
LLE: Liquid-liquid extraction
deoxyGMP: 2’-Deoxyguanosine-5’-
LOD: Limit of detection
monophosphate
LPME: Liquid phase micro-extraction
deoxyTMP: 2’-Deoxythymidine-5’-
MALDI-MS: Matrix assisted laser
monophosphate
desorption/ionization-mass
DI: Deionized
spectrometry
XIV
MCE: Microchip capillary
SPD: Spermidine
electrophoresis
SPM: Spermine
MEEKC: Microemulsion
SR: Sample reservoir
electrokinetic chromatography
ssDNA: Single stranded
MEKC: Micellar electrokinetic
deoxyribonucleic acid
capillary chromatography
SW: Sample waste reservoir
MES: 2-(N-morpholino)-
Tg: Glass transition temperature
ethanesulfonic acid
Tris:Trishydroxymethylaminomethane
MIM: Methyl imidazole
UV: Ultraviolet
MS: Mass spectrometry
UV-Vis: Ultraviolet-visible
NACE: Non-aqueous capillary
VOCs: Volatile organic compounds
electrophoresis
NMR: Nuclear magnetic resonance
PAHs: Polycyclic aromatic
hydrocarbons
PAs: Polyamines
PC: Polycarbonate
PDMS: Polydimethylsiloxane
PETG: Polyethyleneterephthalate
glycol
PFPEs: Perfluoropolyethers
PGD: Potential gradient detection
PMMA: Polymethylmethacrylate
PS: Polystyrene
PTFE: polytetrafluoroethylene
PUT: Putrescine
PVA: Poly(vinylalcohol)
PVC: Polyvinylchloride
RNA: Ribonucleic acid
RNase: Ribonuclease
RSD: Relative standard deviation
S/N: Signal-to-noise
SELEX: Systematic evolution of
ligands by exponential enrichment
XV
CHAPTER 1
Electrophoresis of Small Biomolecules
1.1
Principles of capillary electrophoresis
Capillary electrophoresis (CE) refers to an analytical technique that separates
compounds according to their charge-to-size ratios in an aqueous buffer filled fused
silica capillary under the influence of an externally applied electric field.
Electrophoresis was first described by Tiselius et. al.1 in 1930 for the separation of
proteins and Hjerten et. al.2 subsequently introduced the first CE setup in 1967.
However, CE only sparked off immense interest in the research arena when its
simplicity and high separation efficiency was first demonstrated by Lukacs and
Jorgensen3 in the separation of small compounds and biomolecules.
The CE instrumental system is relatively inexpensive and uncomplicated to set
up as seen in Figure 1.1 below. It consists of a high voltage power supply unit (0 – 30
kV), a detector (optical, electrochemical or mass spectrometric) and a computer
equipped with a data acquisition (DAQ) software. A fused silica capillary, (with inner
bore of 25 – 100 of µm wide) together with electrodes from the power supply unit are
placed in the sample buffer reservoir and the buffer waste reservoirs, forming a closed
electrical circuit. When high voltage is applied to the capillary through platinum
electrodes, the charged compounds will be attracted to their oppositely charged
electrodes. As they migrate past the detector placed near the capillary end, peak
signals will be registered and recorded against time by the DAQ software in the form
of an electropherogram.
1
(d)
(b)
(g)
(a)
(f)
(e)
(c)
CE HV Power Supply
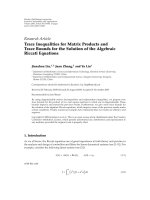
Figure 1.1 A schematic diagram depicting the basic setup of a CE system where (a) Platinum
electrodes, (b) Buffer filled capillary, (c) High voltage (HV) Power supply, (d) Detector, (e)
Buffer reservoir or sample reservoir during sample injection (f) Buffer waste reservoir and (g)
DAQ displaying an electropherogram
In CE, the resultant mobility of each charged compound is dependent on the
combinatory effects of the electroosmotic force (EOF) and their respective inherent
electrophoretic mobility in the capillary as shown in Equation 1.1:
μeff = μep + μEOF ------------ (1.1)
Where μeff refers to the effective electrophoretic mobility of the analyte,
μep refers to the electrophoretic mobility of the analyte as determined by its
charge as well as size and
μEOF refers to the electroosmotic mobility of the buffer.
The fused silica capillary consists of silanol (Si-OH) groups lining along its inner
surface. When a solution of pH above 3 is passed through, these silanol groups will be
deprotonated, forming negatively charged silanoate (Si-O-) groups. A diffuse double
film of positively charged buffer cations is electrostatically attacted to these silanoate
groups, leading to the formation of the EOF. Within this film, a fixed layer of cations
is tightly held to the silanoate groups followed by a mobile layer where the buffer
cations are loosely bound to these groups4. In a normal CE mode, when a positive
2
voltage is applied, the mobile layer of buffer cations migrates towards the cathode. As
it does, it drags the bulk of the buffer solution along with it and thereby generating the
EOF. The strength of this EOF is determined by Equation 1.2 below:
μEOF = єζ/4πη ------------------ (1.2)
Where є refers to the dielectric constant of the buffer,
ζ is the zeta potential and
η is the viscosity of the buffer.
The buffer parameters are affected by the composition of the buffer used, its pH as
well as the type of organic additives introduced. For instance, when the pH of the
buffer is increased, the zeta potential is high and a strong EOF is resulted. However,
when an organic additive such as acetonitrile is added, this will raise the buffer’s
viscosity and thereby lowering the strength of the EOF.
The EOF, thus, determines the times at which the charged compounds migrate
out. When a strong EOF is generated in normal CE mode, the cations will reach the
detector first, followed by the neutrals. The anions will also be swept towards the
negatively charged electrodes. Conversely, when the EOF is weak, the inherent
electrophoretic mobilities of the anions will cause them to be attracted to the anode
instead.
Although CE is not as routinely used as compared to other separation
techniques like high performance liquid chromatography (HPLC) and gas
chromatography (GC), it is still an attractive technique that draws the attention of
researchers. For instance, it can attain relatively higher separation efficiency
compared with HPLC and GC as its sample plug is electrically driven through the
capillary as a flat plug in which all the molecules travel at the same velocity, resulting
in narrow, sharp peaks. In addition, the narrow bore of the capillary aids in reducing
3
band dispersion across the capillary. Conversely, the sample in HPLC is pumped
through the packed column, of 1 - 10 mm wide, under the laminar flow profile which
leads to diffused sample zone and hence broad peaks. Moreover, the analysis in CE is
not limited to only charged compounds but neutral ones as well. The micellar
electrokinetic capillary chromatography (MEKC) mode can be applied to such sample
analysis in which charged surfactants, introduced in the buffer system, will form
micelles which act as pseudo stationary phase to interact with the neutrally charged
compounds and thereby influencing their mobilities through the capillary5. Besides
these neutral compounds, CE also allows the analyses of a wide variety of analytes in
different matrices, for example, inorganic ions in postblast residues6, environmental
pollutants such as polycyclic aromatic hydrocarbons (PAHs) and herbicides7, 8, food
additives and organic contaminants (dyes, preservatives and acrylamide)5,
9, 10
,
pharmaceuticals11 as well as biomolecules12, 13. This can be readily achieved by the
application
of
different
modes
of
CE
like
microemulsion
electrokinetic
chromatography (MEEKC), capillary gel electrophoresis (CGE), non-aqueous
capillary electrophoresis (NACE) and capillary isoelectric focusing (CIEF). These CE
modes can be carried out simply by adjusting the buffer constituents (aqueous or
organic solvents), the type of buffer additives used (surfactants and chiral selectors) as
well as the concentration and pH of the electrophoresis buffer. In addition, CE is a
sensitive analytical technique that can analyze up to ultra-trace amounts of analytes in
complex sample matrices. It is also environmental friendly due to its low reagent
consumption and the simplicity of its instrumental setup that allows for automation
and portability.
4
1.2
Microchip capillary electrophoresis
With the rapid development of CE in the 1980s, there is a shift in trend in the
1990s towards miniaturization to further exploit its advantages. This is in particular so
with the first paper reporting on the CE application on a glass microchip fabricated
via photolithographic method by Manz et. al.14 in 1992. Since then, there is an
increasing number of publications on the various aspects of microchip capillary
electrophoresis (MCE) that range from device technology (microfabrication
techniques, surface modification, design of the microchip etc) 15-17; analytical methods
(sample preparation, detection, separation modes and methods etc)18,
19
and the
application areas (immunoassay, clinical diagnosis, cell handling and analysis)20, 21.
Despite its small size, microchip CE is still able to achieve high separation
efficiency. It provides high separation power of up to 160,000 theoretical plates on a
50 μm wide and 20 μm deep microchannel with only a separation length of 50 mm22.
With typically short microchannels of 50 - 100 mm long, 10 - 100 μm wide and less
than 50 μm deep, only about 1 – 5 kV is required to drive the electrophoresis on
microchip23. Hence, Joule heating and consequently dispersive mass transport can be
minimized. Furthermore, high throughput can also be realized on this small device
with μ-capillary array electrophoresis (μ-CAE). The μ-CAE has progressed from the
48-separation lanes24 to as many as 384-separation lanes on a 20 cm wide substrate25.
In addition, minimal sample and reagents are required since the sample and buffer
reservoirs hold only 50 - 200 μL of solution. Thus, it is suitable for the analyses of
samples that are precious and available only in limited amounts like proteins,
neuropeptides, biogenic amines and amino acids in body fluids like serum and
neurological fluids26. Moreover, with the combination of efficient pumping
mechanism of electroosmosis and electrophoresis, the integration of various
5
laboratory functions (sample preparation, mixing, reactors, preconcentration and
analysis) can be done on a microchip without compromising the separation efficiency.
The various fluid manipulation components (separation channels, valves and filters)
as well as miniaturized auxiliary instruments like power supply, detectors and pumps
can be incorporated on a single microchip to allow device integration27, 28. With such
integration, microchip CE devices can be developed as portable sensors that allow
point-of-care or fast on-site analysis, allowing the preservation of the sample integrity.
Besides being a “lab-on-a-chip”, the microchip can be custom-designed to
further enhance detection sensitivity, throughput and to allow integration of detector.
This can be observed in the introduction of microchip with integrated potential
gradient detection (PGD), a new conductivity detector, as reported by Feng et. al.29
and in μ-CAE where the microchannels are radially distributed on a small microchip
by Mathies and his coworkers25. All these can be achieved by using computer aided
design softwares like AutoCAD, CorelDraw or FreeHand so as to tailor the fluid
circuit on the microchip for the intended analytical methods. A master template is
then created so as to allow the transfer of the design directly onto the chosen
microchip substrate or for further replication.
However, an appropriate substrate and its complementary microfabrication
technique have to be chosen before making the master template. The selection of
substrate is of importance as its properties, such as the charges on the microchannel’s
surface, electrical conductivity, thermal insulation, optical clarity and solvent
compatibility as well as the availability of established modifications/surface chemistry
of the substrate, can significantly affect the MCE’s separation capability and
efficiency30. Moreover, the physical properties of the substrate like rigidity, glass
transition temperature, melt temperature and thermal expansion coefficient need to be
6
considered in deciding the type of microfabrication technology to be used as well as
microfabrication parameters, like the thickness of the photoresist layer to be applied,
the duration of UV exposure and wet etching, to be optimized31.
There are mainly two types of microchip substrates to be considered – rigid
glass and silicon or elastomeric polymers. Glass substrate is commonly known for its
good optical clarity and good solvent compatibility. In addition, it has a stable
microchannel surface that gives rise to reproducible EOF closely resembling that of
the fused silica capillary32, 33. Due to the rigid physical property, micromachining
technique, which involves photolithography or electron beam lithography and etching,
is utilized to fabricate glass and Si microchips. Such a technique is stringent and
tedious owing to the need for a clean room facility. Furthermore, glass substrate is
fragile and requires delicate handling. Hence, the microfabrication of such microchip
is expensive and makes it cost inefficient to be disposable.
Polymer based microchips are, thus, preferred in both the research and
industrial fields. These polymers can be moulded readily with simplified
microfabrication process and thus allowing the mass production of such microchips.
There are generally three classes of polymers with varying rigidity – elastomeric
polymers, duroplastic polymers and thermoplastic polymers34. Elastomeric polymers
like polydimethylsiloxane (PDMS) and perfluoropolyethers (PFPEs) are weakly
cross-linked polymer chains that will return to its original state even after it is
deformed by the application of external forces. Hence, soft lithography technique is
commonly utilized for the microfabrication of such microchips35. The design of the
fluid circuit is first printed on a transparency or chrome mask. The smallest feature
size of the former is limited to only 8 μm while the latter’s, which is more costly, can
be further reduced36. Photolithography is typically used to transfer the fluid circuit
7
design to a silicon substrate which is used as a master template for replica moulding
of multiple microchips. Such a technique allows multi-layering of the elastomers
thereby creating a three-dimensional (3-D) microchip system. With the simplicity of
such technique, soft lithography enables one to vary the design of the fluid circuit
with ease.
A similar technique to soft lithography is also used to fabricate duroplastic
based microchip37. Duroplastic polymers such as thermoset polyester, resist materials
and polyimide are more strongly cross-linked. Thus, it is harder to re-mould them. A
refined soft lithography technique has to be used instead. Its difference from soft
lithography lies in that the polymer is partially cured using UV light before removing
it from the template. The final product is then obtained with complete curing against
another partially cured polymer, thereby providing a good sealing between polymers.
Polymethylmethacrylate
copolymer
(COC),
(PMMA),
polystyrene
(PS),
polycarbonate
(PC),
polyvinylchloride
cyclic
olefin
(PVC)
and
polyethyleneterephthalate glycol (PETG) are examples of thermoplastic polymers.
Like elastomeric polymers, they are formed from weakly linked chain molecules. The
moulding of such polymers requires the careful manipulation of the polymer’s glass
transition temperature (Tg). As such, embossing38 and injection moulding39 are more
suitable microfabrication techniques for this class of polymeric microchips.
Embossing involves the use of pressure and heat with hydraulic vacuum pumps to
pattern the polymers against the master silicon or metal template. The silicon template
can be constructed from the previously mentioned micromachining method while the
metal stamps are either electroplated from the silicon masters or manufactured with
the LIGA (lithography, electroplating and moulding in German) process39,
40
.
Although embossing procedure seems uncomplicated, the template making process is
8
time consuming and limiting. Furthermore, only mono-layer planar microchips can be
obtained and an initial costly capital investment in the equipment is needed. Hence,
such a technique is only suitable for routine production of proven microchip designs.
Alternatively, injection moulding can also be used for making these polymeric
microchips. It involves the use of the melted pre-polymerized pellets of the
thermoplastic polymers before injecting them into a heated mould cavity under high
pressure. This is followed by the release of the polymer from the mould after cooling
it to below Tg. It is sometimes preferred over embossing as it allows for higher
throughput and is thus more efficient in mass production.
Beside the various microfabrication techniques as described above, laser
ablation41 can also be used to create the fluid circuit designs on the thermoplastic
polymers. A high-powered pulsed laser, like ArF excimer laser (193 nm), KrF (248
nm) and the CO2 lasers, incised the designs onto the substrate. Such a technique
allows fast fabrication of newly designed microchip since the design can be directly
inputted into the microfabrication system to allow direct translation of the design onto
the substrate. Unfortunately, it is unsuitable for mass production because of the
inherent serial nature of the system36.
With the numerous benefits and the wide variety of substrates and techniques
available for microfabrication of microchips, it is of no doubt that microchip can be a
potentially useful tool that can aid in the advancement of various research fields like
the life science, clinical analysis and biomedicine. The possibility of “lab-on-a-chip”
on a single platform, fast analysis results, high throughput and the availability of
biocompatible polymers like PDMS coupled with relatively low cost of production
will continue to attract researchers in these fields towards MCE.
9
1.3
Analysis of small biomolecules
Biomolecules refer to molecules that are formed naturally from various
biological processes, like metabolism and biosynthesis, in living organisms. They are
comprised primarily of carbon, hydrogen, nitrogen, oxygen, phosphorous and sulfur
of varying molecular weight that range from small biomolecules like amino acids,
catecholamine neurotransmitters, polyamines, hormones, nucleosides and nucleotides
to
macrobiomolecules
like
proteins,
deoxyribonucleic
acids
(DNA)
and
polysaccharides. The analysis of larger biomolecules, that are separated based on the
differences in molecular weights, is so well established that techniques like gel
electrophoresis or CE with electrolytes containing sieving matrices are commonly
used by most researchers when they encounter such analytes42-46. With these
techniques,
structural,
conformational
and
biological
information
of
macrobiomolecules can be obtained. Conversely, the study on small biomolecules is
often neglected since they are regarded to be too small to contain any useful genetic
information. But these small biomolecules are the building blocks needed for
biosynthesis of macrobiomolecules, intermediates of metabolism or cofactors of
biochemical processes. Any abnormality occurring to these biomolecules is usually an
indication of the occurrence of diseases. As such, the analysis of these biomolecules
enables the detection of early onset of diseases (i.e. malfunctioning metabolism or
biosynthesis system), to control and monitor their progress as well as to obtain
information for drug discovery. Consequently, these biomolecules are being
investigated as biomarkers of potential diseases.
Biomarkers are biomolecules that are subjected to cellular, biochemical,
molecular or genetic alterations such that a biological process can be recognized and
monitored47. When the biological process is disrupted, the level of biomarkers will be
10