Aggregate and spatial distributions of DNA palindromes and their applications to replication origins prediction in some viral genomes
Bạn đang xem bản rút gọn của tài liệu. Xem và tải ngay bản đầy đủ của tài liệu tại đây (1.07 MB, 112 trang )
AGGREGATE AND SPATIAL
DISTRIBUTIONS OF DNA PALINDROMES
AND
THEIR APPLICATIONS TO REPLICATION
ORIGINS PREDICTION IN SOME VIRAL
GENOMES
CHEW SOON HUAT DAVID
(M.Sc, B.Sc.(Hons.), NUS)
A THESIS SUBMITTED
FOR THE DEGREE OF DOCTOR OF PHILOSOPHY
DEPARTMENT OF MA THEMATICS
NATIONAL UNIVERSITY OF SINGAPORE
2006
To Carolyn . . .
ACKNOWLEDGEMENTS
I would like to thank my advisor and friend, Professor Choi Kwok Pui, for investing
a great deal of his time and energy during the past few years in me. Thanks for help-
ing me go through this “enduring” process. I am very grateful for all you have done
for me, in particular, the last few months while applying for jobs. The conversations
we had in your office, especially the encouragement you gave, advice for my career;
I will bear them in my mind for a long time to come. I feel blessed and fortunate to
have you as my advisor.
My gratitude also goes to Professor Leung Ming-Ying, for your guidance all this
while. I can still remember the day I first heard about the palindrome problem in a
seminar you gave, which started my journey in this field. I have learnt a great deal
from you even though we work long distance most of the time. Therefore, I greatly
cherish the few times we were able to work together in person. I especially remember
the encouragement you gave on the last day of my visit to El Paso in December 2005.
I would also like to thank the Department of Mathematics, especially Professor Tan
Eng Chye, for employing me as a TA with the department throughout my candida-
ture. It has enabled me to pursue my PhD degree and at the same time help support
my brothers through university, which I otherwise would not have been able to do.
Many thanks.
I am indebted to my family, who have supported me in their own quiet ways all
these years.
iii
Acknowledgements iv
Most of all, I want to thank my fiancée Carolyn, for standing by, encouraging,
cheering me on and taking very good care of me, evermore so during the last stage of
this journey. You are God’s gift to me.
D
A
V
I
D C
H
E
W
July 2006
TABLE OF CONTENTS
Acknowledgements iii
Table Of Contents v
Summary viii
List of Tables x
List of Figures xii
1 Introduction 1
1.1 A Little Biology for the Mathematician . . . . . . . . . . . . . . . . . . . 2
1.2 Organization of the Thesis . . . . . . . . . . . . . . . . . . . . . . . . . . 4
2 Palindromes in SARS 7
2.1 Introduction . . . . . . . . . . . . . . . . . . . . . . . . . . . . . . . . . . 7
2.2 Palindrome Counts in Markov-Chain Models . . . . . . . . . . . . . . . 9
2.3 Palindrome Counts in Coronaviruses . . . . . . . . . . . . . . . . . . . . 17
2.4 Discussion . . . . . . . . . . . . . . . . . . . . . . . . . . . . . . . . . . . 22
2.5 Concluding Remarks . . . . . . . . . . . . . . . . . . . . . . . . . . . . . 25
3 Prediction of replication origins in herpesviruses 27
3.1 Introduction . . . . . . . . . . . . . . . . . . . . . . . . . . . . . . . . . . 27
3.2 Methods . . . . . . . . . . . . . . . . . . . . . . . . . . . . . . . . . . . . . 30
3.3 Results And Discussion . . . . . . . . . . . . . . . . . . . . . . . . . . . . 34
v
Table Of Contents vi
3.3.1 Scan Statistics method versus the new scoring schemes . . . . 34
3.3.2 Prediction accuracy . . . . . . . . . . . . . . . . . . . . . . . . . 35
3.3.3 Difference between PLS and BWS . . . . . . . . . . . . . . . . . 41
3.3.4 Further improvement of the algorithm . . . . . . . . . . . . . . 41
3.4 Concluding Remarks . . . . . . . . . . . . . . . . . . . . . . . . . . . . . 43
4 Compound Poisson Approximation of Palindrome Length Score 45
4.1 Introduction . . . . . . . . . . . . . . . . . . . . . . . . . . . . . . . . . . 45
4.2 Implementing The Palindrome Length Score . . . . . . . . . . . . . . . 46
4.3 Properties of the Compound Poisson Distribution . . . . . . . . . . . . 46
4.4 Modeling the Palindrome Length Score . . . . . . . . . . . . . . . . . . 48
4.5 Compound Poisson Approximation . . . . . . . . . . . . . . . . . . . . . 50
4.6 Probability Mass Function of Y . . . . . . . . . . . . . . . . . . . . . . . 50
4.7 Goodness of Approximation . . . . . . . . . . . . . . . . . . . . . . . . . 54
4.8 Identifying High Scoring Windows . . . . . . . . . . . . . . . . . . . . . 57
4.9 Binomial Approximation to the Sliding Window Score . . . . . . . . 62
5 AT Excursions for Prediction of Replication Origins 64
5.1 Background . . . . . . . . . . . . . . . . . . . . . . . . . . . . . . . . . . . 64
5.2 Methods . . . . . . . . . . . . . . . . . . . . . . . . . . . . . . . . . . . . . 67
5.2.1 Score-based sequence analysis . . . . . . . . . . . . . . . . . . . 67
5.2.2 Scoring the bases. . . . . . . . . . . . . . . . . . . . . . . . . . . . 67
5.2.3 Probability Model. . . . . . . . . . . . . . . . . . . . . . . . . . . 68
5.2.4 Excursions and their value. . . . . . . . . . . . . . . . . . . . . . 68
5.2.5 Distribution of the Maximal Aggregate Score. . . . . . . . . . . 69
5.2.6 High-scoring Segments. . . . . . . . . . . . . . . . . . . . . . . . 70
5.2.7 Prediction Performance. . . . . . . . . . . . . . . . . . . . . . . . 70
5.3 Discussion/Conclusion . . . . . . . . . . . . . . . . . . . . . . . . . . . . 73
5.3.1 Other Families of Viruses . . . . . . . . . . . . . . . . . . . . . . 76
Table Of Contents vii
6 Palindrome Excursions and Summary 84
6.1 Palindrome Excursions . . . . . . . . . . . . . . . . . . . . . . . . . . . . 84
6.2 Summary . . . . . . . . . . . . . . . . . . . . . . . . . . . . . . . . . . . . 88
6.3 Future Work . . . . . . . . . . . . . . . . . . . . . . . . . . . . . . . . . . . 90
Bibliography 91
SUMMARY
One of the problems we will look at in this thesis concerns the over-representation Chapt. 2
(or under-representation) of palindromic words in genomic sequences, particularly
in the SARS and other coronavirus genomes. Based on a Markov-chain model for the
genome sequence, the mean and standard deviation of the number of palindromes
at or above a certain length are derived. Using these results and extensive simula-
tion, palindromes of a certain length are assessed whether they are statistically over-
represented (or under-represented).
Many empirical studies show that there are unusual clusters of palindromes, closely
spaced repeats and inverted repeats around the replication origins of herpesviruses.
As the search for replication origins involves labor-intensive laboratory procedures,
the long-term goal of my project is to develop sound computational and statistical
methods to predict the likely locations of replication origins in the herpesvirus fam-
ilies. This results in huge savings of time and resources. This long-term project con-
sists of two stages.
Stage 1 is to devise new scoring schemes to measure the spatial abundance of Chapt. 3
palindromes, which generalize and refine the scan-statistics approach of Leung et
al. (Leung et al., 2005, 1994; Leung and Yamashita, 1999). The new prediction meth-
ods, based on these new scoring schemes, when applied to 39 known or annotated
replication origins in 19 herpesviruses have close to 80% sensitivity in the prediction
accuracy (compared to about 15% by the scan statistics approach).
viii
Summary ix
Stage 2 is to develop the mathematics needed to compute or approximate the dis- Chapt. 4
tribution of the scores so as to determine which scores obtained are statistically sig-
nificant. We approximate the scores in one of the new schemes, the Palindrome
Length Score by a compound Poisson distribution with parameters entirely deter-
mined by the base pair composition of the genome.
As an alternative approach to predict the locations o f replication origins in the Chapt. 5
double stranded herpesvir u ses, we propose looking at a simple, yet natural, sequence
feature - the content. We adopt Karlin’s score based approach (Karlin, 1994, 2005;
Karlin and Altschul, 1990, 1993; Karlin et al., 1992 ) to quantitate local abundance
reflecting the genome’s base pairs composition. We then develop a computational
method, called the excursion method, to complement the prediction methods we
have developed in the first part of the thesis.
Finally, we conclude this thesis by reporting some prel iminary results on ou r at- Chapt. 6
tempt in adopting Karlin’s excursion approach to palindromic word patterns. A sum-
mary of the approaches we have tried in this thesis in predicting locations of repli-
cation origins i s presented. Some possible extensions to works in this thesis are also
proposed.
LIST OF TABLES
2.1 List of Seven Coronaviruses and Four Other RNA Viruses to be Analyzed . 19
2.2 z Scores for Counts of Palindromes of Length Four and Above . . . . . . . 19
2.3 z Scores for Palindromes of Various Le ngths Under the M0 Model . . . . . 21
2.4 z Scores for Palindromes of Various Le ngths Under the M1 Model . . . . . 21
3.1 The list of herpesviruses to be analyzed. . . . . . . . . . . . . . . . . . . . . 31
3.2 High Scoring Windows of PLS. The numbers in the table indicate the mid-
dle positions of the windows. Rows that are shaded indicate that the par-
ticular viruses have known replication origins either from literature or
from annotation. Underlined entries denote the middle positions of the
windows which are within 2 map units (i.e. 2% of the genome length) of
known replication origins. . . . . . . . . . . . . . . . . . . . . . . . . . . . . 36
3.3 High Scoring Windows of BWS
1
. . . . . . . . . . . . . . . . . . . . . . . . . . 37
3.4 Regions with significant clusters of palindromes as found by the PCS. For
example, for the virus EBV, the region 6771-10590 bp is deemed to contain
a high concentration of palindromes. BOHV4, BOHV5, CEHV2, CEHV7,
EHV4, GAHV1, GAHV2, HHV6, HSV1, HSV2, ICHV1, OSHV1, SAHV2 and
VZV have no significant clusters of palindromes. . . . . . . . . . . . . . . . 38
3.5 Prediction performance of various scoring schemes, PLS and BWS, based
on top 3 scoring windows. The table shows the distance between each
known origin from the nearest significant palindrome cluster for PCS, or
the nearest high scoring window for PLS and BWS
1
if the center of the
cluster or window is within 2 mu of the origin. For example, one of the
top 3 scoring windows under the PLS (and BWS) for RCMV is 0.62 map
unit away from the RCMV oriLyt. . . . . . . . . . . . . . . . . . . . . . . . . 39
4.1 Total Variational Distance (d
T V
) and Kolmogorov Distance (d
K
) between
the Compound Poisson and Empirical Distributions for the training set. . 56
x
List of Tables xi
4.2 Summary for Total Variational Distance (d
T V
) and Kolmogorov Distance
(d
K
) between the Compound Poisson and Empirical Distributions. . . . . 56
4.3 Prediction performance of PLS with compound Poisson approximation. . 58
4.4 Total Variational Distance (d
T V
) and Kolmogorov Distance (d
K
) between
the Compound Poisson and Empirical Distributions under M0 and M1
model. . . . . . . . . . . . . . . . . . . . . . . . . . . . . . . . . . . . . . . . . 59
4.5 Windows with scores exceeding the critical score at 5% for M0 Model.
Rows on upper half list viruses with known replication origins, those on
lower half without. Entries in bold indicate that window score is also sig-
nificantly high at 1%. Underlined entries indicate that window is within
2mu of some known ORI. . . . . . . . . . . . . . . . . . . . . . . . . . . . . . 60
4.6 Windows with scores exceeding the critical score at 5% for M1 Model. . . 61
5.1 Prediction results at 5% level using the conservative bound. . . . . . . . . 72
5.2 Prediction Performance: Summary. (C) indicates that the “Conservative”
bound is used while (G) indicates that the “Generous” bound is used. . . 73
5.3 The list of Irido and Pox vir u ses to be analyzed. . . . . . . . . . . . . . . . . 78
5.4 Herpesviruses : HSS at 5% level using the conservative bound. . . . . . . . 79
5.4 Herpesviridae : HSS at 5% level using the conservative bound. (Cont’d) . . 80
5.4 Herpesviridae : HSS at 5% level using the conservative bound. (Cont’d) . . 81
5.5 Irido and Pox viruses: HSS at 5% level using the conservative bound. . . . 82
5.6 Irido and Pox viruses: Top 10 high-scoring windows under BWS
1
. . . . . . 83
6.1 Herpesviruses: ψ values. . . . . . . . . . . . . . . . . . . . . . . . . . . . . . 87
6.2 Prediction Performance of Palindrome Excursion. . . . . . . . . . . . . . . 88
6.3 Summary of All Prediction Schemes. . . . . . . . . . . . . . . . . . . . . . . 89
LIST OF FIGURES
1.1 DNA replication . . . . . . . . . . . . . . . . . . . . . . . . . . . . . . . . . . 2
1.2 A palindrome of length 10. . . . . . . . . . . . . . . . . . . . . . . . . . . . . 3
2.1 Overlapping Structures of Palindromes C
k
and C
k+d
for Different Valu es
of d. Note that (a), (b), and (c) are Drawn with Different Scales. . . . . . . 11
2.2 Normal Q-Q Plots of Counts of Palindromes of Length Four (Left) and Six
(Right) in the 1000 Random Sequences Under the M1 Model for the SARS
Genome . . . . . . . . . . . . . . . . . . . . . . . . . . . . . . . . . . . . . . . 20
3.1 Sliding window plots of HCMV and HSV1 using PCS, PLS and BWS
0
. The
first window spans the first through the w-th bases, the second the
w
2
+ 1
st
to
3w
2
th bases, and so on. The score of a window is the total of the scores
of all the palindromes occurring in this window according to PCS, PLS or
BWS
0
. . . . . . . . . . . . . . . . . . . . . . . . . . . . . . . . . . . . . . . . . 35
3.2 Sensitivity and positive predictive values of the PLS and BWS. In our con-
text, sensitivity is the percentage of known origins that are close to the
regions suggested by the prediction; and positive predictive value is the
percentage of identified regions that are close to the known origins. The
sensitivity and positive predictive values of the PCS are 16 and 37 respec-
tively. . . . . . . . . . . . . . . . . . . . . . . . . . . . . . . . . . . . . . . . . . 40
3.3 Sensitivity and positive predictive values o f Local BWS. . . . . . . . . . . . 42
5.1 The Excursion Plot o f the VZV virus. . . . . . . . . . . . . . . . . . . . . . . . 71
5.2 Predictions of excursion and BWS
1
. In this figure, the set A consists of
origin replications predicted by the excursion method and B consists
of those predicted by the BWS
1
method. A ∩ B
C
= {cehv7
1
, cehv7
2
, ehv4
1
,
hsv2
1
, hsv2
2
, hsv2
3
}, A
C
∩ B = {cehv16
2
, cehv16
3
, ebv
1
, ebv
3
, hhv6, hhv6b,
rcmv},
(
A ∪ B
)
C
= {bohv4, ehv4
2
, ehv4
3
, hhv7}. The rest of the replication
origins (26 of them) are predicted by both methods. (Note: For viruses
with several known replication origins, such as hsv2, we denote the repli-
cation origins as hsv2
1
,hsv2
2
,hsv2
3
, etc.) . . . . . . . . . . . . . . . . . . . 75
xii
He giveth power to the faint; and to them that have no might he in-
creaseth strength .
Isaiah
This grace gives me fear, and t his grace draws me near,
And all that it asks i t provides .
Sandra McCracken
C H A P T E R
INTRODUCTION
Advances in biochemical techniques have led to an exponential increase in the amount
of genomic sequence data available to us. Mathematical and computational meth-
ods play an increasingly important role in managing, organizing, analyzing and in-
terpreting the rapidly accumulating DNA data. Computer algorithms can be used
to compare and extract sequence features of interest while probability models and
statistical techniques tell us if these features are random or not.
This thesis deals with measuring spatial abundance of some word patter ns in
genomic sequences. There are three main themes that we will be looking at:
(i) Over-representation (or under-representation) of RNA-palindromes in the SARS
and other coronavir uses;
(ii) Novel scoring schemes to quantify the spatial abundance of DNA-palindromes;
and
(iii) excursions to quantitate local abundance in genomic sequences.
In particular, we are interested to look at (ii) and (iii) and make use of them to predict
the locations of replication origins in some families of double stranded viruses which
includes the herpesviruses, amongst others.
1
1.1. A Little Biology for the Mathematician 2
1.1 A Little Biology for the Mathematician
Before we go on, let us review some relevant biological concepts and background.
Deoxyribonucleic acid (DNA) is a nucleic acid – usually in the form of a double
helix – that contains the genetic instructions specifying the biological development
of all cellular forms of life, and many viruses. Contrary to a common misconcep-
tion, DNA is not a single molecule, but rather a pair of molecules joined by hydro-
gen bonds: it is organized as two complementary strands, head-to-toe, with the hy-
drogen bonds between them. Each strand of DNA is a chain of chemical “building
blocks”, called nucleotides, of which there are four types: adenine (abbreviated ),
cytosine ( ), guanine ( ) and thymine ( ).
Between the two strands, each base can only “pair up” with one single predeter-
mined other base: , , and are the only possible combinations; that
is, an “ ” on one strand of double stranded DNA will “mate” properly only with a
“ ” on the other, complementary strand; therefore, naming the bases on the con-
ventionally chosen side of the strand is enough to describe the entire double strand
sequence. We call the complement of (vice versa), and the complement of .
Two nucleotides paired together are called a base pair.
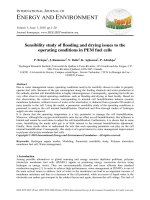
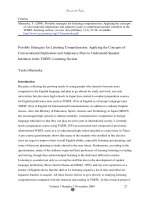
Figure 1.1 – DNA replication
The double stranded structure of DNA provides a simple mechanism for DNA
replication: the DNA double strand is first “unzipped” down the middle, and the
1.1. A Little Biology for the Mathematician 3
“other half” of each new single strand is recreated by exposing each half to a mixture
of the four bases. An enzyme makes a new strand by finding the correct base in the
mixture and pairing it with the original strand. In this way, the base on the old strand
dictates which base will be on the new strand, and the cell ends up with an extra copy
of its D NA.
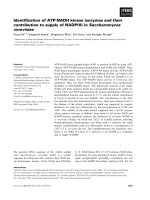
DNA palindromes are DNA words which are symmetrical in the sense that they
read exactly the same as their complementary sequences in the reverse direction (see
Figure 1.2 for example). A DNA palindrome is necessarily even in length because the
middle base in any odd-length nucleotide string cannot be identical to its comple-
ment. More precisely, we can define a palindrome to be a word pattern of the form
b
1
b
L
b
L
b
1
, where b
is the complement of base b and L is called the stem length
(or half-length) of the palindrome. We call the letter b
L
the left-center and b
L
the
right-center of the palindrome. The length of the palindrome in Figure 1.2 is 10 and
L = 5.
5
←−−−−
3
3
−−−−→
5
Figure 1.2 – A pali ndrome of length 10.
Palindromes play important roles as protein binding sites in DNA replication pro-
cesses (Kornberg and Baker, 1992, Chapter 1 ). The local two-fold symmetry created
by the palindrome provides a binding site for DNA-binding proteins which are of-
ten dimeric in structure. Such double binding markedly increases the strength and
specificity of the binding interaction (Creighton, 1993, Chapter 8). High concentra-
tion of palindromes around replication origins is generally attributed to the reason
that the initiation of DNA replication typically requires the binding of an assembly of
enzymes to these DNA sequences. Helicase is an example of these enzymes known to
bind with the initiation site, locally unwind the DNA helical structure, and pull apar t
the two complementary strands. This explanation is consistent with the observation
1.2. Organization of the Thesis 4
of AT-rich regions, believed to facilitate the unwinding, in replication origin domains
of the genome (Lin et al., 2003).
Ribonucleic acid (RNA) is primarily made up of four different bases: adenine,
guanine, cytosine, and uracil (abbreviated ). The first three are the same as those
found in DNA, but uracil replaces thymine as the base complementary to adenine.
RNA serves as the template for translation of genes into proteins, transferring amino
acids to the ribosome to form proteins, and also translating the transcript into pro-
teins. The definition of a RNA palindrome is similar to that of a DNA palindrome,
with uracil ( ) taking on the role of thymine ( ).
1.2 Organization of the Thesis
We are firstly interested to measure the abundance of palindromic word pattern at
a global and local level. The assessment of whether DNA/RNA palindromes are over-
represented or under-represented can be broadly classified into (i) global count –
total count of palindromes in a biological sequence; and (ii) local count – spatial
distributions of palindromes in a biological sequence.
One of the problems we will look at in this thesis concerns the over-representation Chapt. 2
(or under-representation) of palindromic words in genomic sequences, particularly
in the SARS and other coronavirus genomes. Based on a Markov-chain model for the
genome sequence, the mean and standard deviation of the number of palindromes
at or above a certain length are derived. Using these results and extensive simula-
tion, palindromes of a certain length are assessed whether they are statistically over-
represented (or under-represented). Our conclusions are (i) length 4 palindromes
are statistically significantly under-represented in all coronaviruses; and (ii) most
interestingly, length 6 palindromes are significantly under-represented only in the
SARS sequence and not in any other coronaviruses. These findings lead to the hy-
pothesis that this avoidance of length-six palindromes in the SARS genome per haps
offers a protective effect on the virus, making it comparatively more difficult to be de-
1.2. Organization of the Thesis 5
stroyed. This is a joint work with Kwok Pui Choi (NUS), Hans Heidner (University of
Texas, San Antonio) and Ming-Ying Leung (University of Texas, El Paso) and has been
published in a special issue on computational molecular biology/bioinformatics of
INFORMS Journal on Computing, 16(4):331-340 (Chew et al., 2004).
Many empirical studies show that there are unusual clusters of palindromes, closely
spaced repeats and inverted repeats around the replication origins of herpesviruses.
As the central step in the reproduction of herpesviruses, viral DNA replication has
been the target for a number of anti-herpesvirus drugs. Understanding the molecu-
lar mechanisms involved in DNA replication is of great importance in further devel-
oping strategies to control the growth and spread of viruses. As the search for repli-
cation origins involves labor-intensive laboratory procedures, the long-term goal of
my project is to develop sound computational and statistical methods to predict the
likely locations of replication origins in the herpesvirus families. This results in huge
savings of time and resources. This long-term project consists of two stages.
Stage 1 is to devise new scoring schemes to measure the spatial abundance of Chapt. 3
palindromes, which generalize and refine the scan-statistics approach of Leung et
al. (Leung et al., 2005, 1994; Leung and Yamashita, 1999). The new prediction meth-
ods, based on these new scoring schemes, when applied to 39 known or annotated
replication origins in 19 herpesviruses have close to 80% sensitivity in the predic-
tion accuracy (compared to about 15% by the scan statistics approach).
1
This joint
work with Kwok Pui Choi and Ming-Ying Leung has been published in Nucleic Acids
Research, 33(15):e134 (Chew et al., 2005).
Stage 2 is to develop the mathematics needed to compute or approximate the dis- Chapt. 4
tribution of the scores so as to determine which scores obtained are statistically sig-
nificant. We approximate the scores in one of the new schemes, the Palindrome
Length Score by a compound Poisson distribution with parameters entirely deter-
1
For this thesis, we work with a slightly larger data set and so the above sentence would read “ . 43
known or annotated replication origins in 20 herpesviruses. . . ”.
1.2. Organization of the Thesis 6
mined by the base pair composition of the genome. Based on this approximation, we
are able to identify windows with statistically high scores which are then proposed
as possible locations of replication origins of herpesviruses. Work is in progress for
the other scheme.
As an alternative approach to predict the locations o f replication origins in the Chapt. 5
double stranded herpesvir u ses, we propose looking at a simple, yet natural, sequence
feature - the content. It has been observed that regions around the replication
origins are rich in AT. One possible explanation is that segments of DNA with high
content, i.e., lower content, are less stable and hence more likely candidates
for replication origins. We adopt Karlin’s score based approach (Karlin, 1994, 2005;
Karlin and Altschul, 1990, 1993; Karlin et al., 1992 ) to quantitate local abundance
reflecting the genome’s base pairs composition. We then develop a computational
method, called the excursion method, to complement the prediction methods we
have developed in the first part of the thesis. The idea is to assign positive scores
to bases and negative ones to bases and look for regions in the genomic se-
quence with high positive additive scores. Our method is statistical-based. Building
on the work of Karlin and his collaborators, we have statistical tools to determine
statistically high scoring segments. When this is used to predict replication o rigins
of viruses from the herpesvirus family, we obtained results that complement the ap-
proach mentioned earlier.
Finally, we conclude this thesis by reporting some prel iminary results on ou r at- Chapt. 6
tempt in adopting Karlin’s excursion approach to palindromic word patterns. A sum-
mary of the approaches we have tried in this thesis in predicting locations of repli-
cation origins i s presented. Some possible extensions to works in this thesis are also
proposed.
C H A P T E R
PALINDROMES IN SARS AND OTHER
CORONAVIRUSES
2.1 Introduction
In March 2003, a novel coronavir u s associated with the severe acute respiratory syn-
drome (SARS) was identified. The outbreak of SARS in different parts of the world,
causing hundreds of deaths, has initiated much international effort that includes
clinical, epidemiologic, and laboratory investigations with the aim of controlling the
spread of the virus (Bloom, 2003; Marra et al., 2003 ; Rota et al., 2003; Ruan et al.,
2003). Although the world was cleared of new SARS cases by July 2003, the pursuit for
a thorough understanding of the or igin, evolution, and pathogenicity of this deadly
virus continues.
With the availability of the complete genome sequence of the SARS and several
other coronaviruses in public databases (e.g., GenBank), it is possible to do a compu-
tational analysis of the viral genome, looking for unusual genome sequence features
either unique to the SARS virus or common to the coronavirus family. Such informa-
tion can give clues to the origin, natural reservoir, and evolution of the virus. It may
7
2.1. Introduction 8
contribute to the studies of the immune response to this virus and the pathogenesis
of SARS-related disease (Rota et al., 2003).
Statistical and experimental studies of palindromes in the other classes of viral
genomes, such as the double stranded DNA viruses, bacteriophages, retroviruses,
etc., have been performed (Cain et al., 2001; Dirac et al., 2002; Hill et al., 2003; Kar-
lin et al., 1992; Leung et al., 2005; Rocha et al., 2001, among others). These studies
have suggested that palindromes might be involved in the viral packaging, replica-
tion, and defense mechanisms. Unlike these well-studied viruses involved in fatal
diseases such as AIDS and various cancers, the coronaviruses have not received as
much attention until the recent outbreak of SARS.
In the present study, we focus our attention on palindromes in the positive stranded
RNA genomes of coronaviruses. In accordance with GenBank convention, we repre-
sent an RNA sequence as a string of letters from the alphabet A ={ , , , }. The
four letters respectively stand for the RNA bases adenine, cytosine, guanine, and
uracil. The letters and are complementary to each other because adenine and
uracil form hydrogen bonds with each other. The same applies to and . A palin-
drome is a symmetrical word such that when it is read in the reverse direction, it is
exactly the complement of itself. For example, is a palindrome of length four. A
palindrome is necessarily even in length because the middle base in any odd-length
nucleotide string cannot be identical to its complement.
Several points are worth noting from this initial exploratory analysis of palin-
dromes in the coronavirus genome sequences:
(1) The palindrome cou nts in the coronavirus genomes seem lower than what would
be expected from random sequences.
(2) The SARS virus contains an exceptionally long palindrome with 22 nucleotide
bases. This is the longest among all palindromes observed in the coronaviruses.
(3) There are two copies of a length-12 palindrome situated within 100 bases of each
other in the SARS genome. This is not observed in the other coronaviruses.
2.2. Palindrome Counts in Markov-Chain Models 9
Whether or not these palindrome-related features have any biological relevance
will, of course, have to rely on careful laboratory investigations by the virologists.
At this stage, however,it would be only reasonable to assess whether these features
can indeed be considered statistically unusual when compared to random-sequence
models. Our observations call for investigations into the probability distributions of
palindrome counts, lengths, and locations in a random sequence. For this chapter,
we will focus only on the palindrome counts, leaving the others for future studies.
In the next section, the mathematical formulas for the theoretical mean and vari-
ance for the number of palindromes at or above a prescribed length are derived
based on a Markov -chain random-sequence model. Section 2.3 summar izes the
computational results in comparing palindrome counts of the coronavirus genomes
to the random-sequence models. In Section 2.4, we propose some biological ques-
tions that may be investigated in relation to these observed nonrandom features. A
few concluding remarks are given in Section 2.5.
2.2 Palindrome Counts in Markov-Chain Models
The main objective of this chapter is to assess whether the palindrome counts in the
coronavirus genomes are observed more (or less) frequently than expected, under
some specified probability models. We model the genome sequence as a realization
of a sequence of random variables ξ
1
,ξ
2
, ,ξ
n
taking values in A ={ , , , } where
n is the genome length.
Throughout, we will assume that either
(i) {ξ
1
,ξ
2
, ,ξ
n
} are independent and identically distributed (M0); or
(ii) {ξ
1
,ξ
2
, ,ξ
n
} form a stationar y Markov chain of order one (M1).
For studying DNA words of length k, one can choose to use Markov chains of or-
der up to the maximum order of k −2 as the sequence model. A higher-order Markov
chain will better fit the data sequence, but at the same time the number of param-
eters in the model increases e xponentially. In this study, we carried out some sim-
2.2. Palindrome Counts in Markov-Chain Models 10
ulations using the second-order Markov-chain model (M2). The computation takes
much longer but the z scores obtained gave the same interpretation as that of the M1
model. We therefore content ourselves with the M0 and M1 models for our analysis
of palindromes of length four and above.
We are interested in deriving the mean and standard deviation of the random
variable X
L
, total number of palindromes of length at least 2L under the M0 and
M1 sequence models. This will help quantify the extent of dev iation of the observed
palindrome counts i n the coronavirus genome from the expected counts u nder the
specified probability model.
For L ≤ k ≤ n − L, define
I
k
=
1 if the kth base is the left center of a palindrome of length ≥ 2L
0 otherwise
.
We say that a palindrome occurs at k when I
k
= 1. Therefore, X
L
=
n−L
k=L
I
k
. Note
that the distribu tion of I
k
depends only on the joint distribution of (ξ
k−L+1
, ,ξ
k+L
).
Under the M0 or M1 model, the joint distribution of (ξ
k−L+1
, ,ξ
k+L
) is independent
of k. Hence IP[I
k
= 1] is a constant in k. Similarly IP[I
j
= 1, I
k
= 1] depends only on
| j − k|. Therefore, for L ≤ k ≤ n − L and 1 ≤ d ≤ n − L − k, we define
γ(0) := IP[I
k
= 1] and γ(d) := IP[I
k
= 1, I
k+d
= 1].
The expressions of γ(0) and γ(d) are crucial to calculating the mean and variance
of X
L
(see Proposition 2.3 below). Lemma 2.1 (respectively, Lemma 2.2) deals with
the computation of γ(0) and γ(d) under the M1 (respectively, M0) sequence model.
Indeed, we will deduce Lemma 2.2 from Lemma 2.1.
Throughout, we use b
to denote the complementary base of b, and w
the inver-
sion (i.e., the complementary word read in reverse) of the word w. There are quite
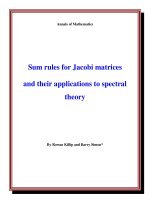
a few details to work out all the possible overlap cases since the overlap structures
depend on the relative sizes of d (the extent of overlap) and 2L (the cut-off length of
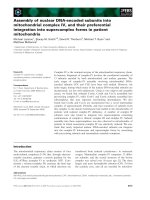
2.2. Palindrome Counts in Markov-Chain Models 11
a palindrome). However, there are only two basic patterns in the overlap. In the first
pattern (as illustrated by Figure 2.1(b)), the shaded segment, due to the complimen-
tary requirement of a palindrome, will uniquely determine the left and right ends of
C
k
and C
k+d
. And in the other pattern (as illustrated by Figure 2.1(c)), the shaded
segment will determine the rest of both palindromes. In Figure 2.1(a), e ven though
palindromes C
k
and C
k+d
do not actually overlap (i.e., d ≥ 2L), the occurrence of a
palindrome at k will still have an effect on the probability that a palindrome will oc-
cur at k + d under the M1 sequence model. Lemma 2.1 provides expressions of γ(d)
under all possible situations.
(a) d ≥ 2L. Here the palindromes C
k
and C
k+d
do not overlap
and c denotes the segment between them.
(b) L ≤ d < 2L. Here w denotes the common segment of palindromes C
k
and
C
k+d
. And w determines the left end and right end of C
k
and C
k+d
.
(c) 1 ≤ d < L with q as quotient when L is divided by d and r the remainder. The
shaded segment determines the rest of both palindromes
Figure 2.1 – Overlapping Structures of Palindromes C
k
and C
k+d
for Different Values
of d. Note that (a), (b), and (c) are Drawn with Different Scales.