Theoretical study of the molecular processes occurring during the growth of silicon on si(100) and sixge1 x si(100
Bạn đang xem bản rút gọn của tài liệu. Xem và tải ngay bản đầy đủ của tài liệu tại đây (1.3 MB, 169 trang )
THEORETICAL STUDY OF THE MOLECULAR
PROCESSES OCCURRING DURING THE GROWTH OF
SILICON ON Si(100) AND Si
X
Ge
1-X
/Si(100)
LIM CHIANG HUAY, FREDA
NATIONAL UNIVERSITY OF SINGAPORE
2007
THEORETICAL STUDY OF THE MOLECULAR
PROCESSES OCCURRING DURING THE GROWTH OF
SILICON ON Si(100) AND Si
X
Ge
1-X
/Si(100)
LIM CHIANG HUAY, FREDA
(B.Sc. (Hons.) NUS)
A THESIS SUBMITTED FOR THE DEGREE OF
DOCTOR OF PHILOSOPHY
DEPARTMENT OF CHEMISTRY
NATIONAL UNIVERSITY OF SINGAPORE
2007
Acknowledgement
I
Acknowledgement
I would like to acknowledge and extend my heartfelt gratitude to the following persons
and organizations that have made the completion of this thesis possible:
My supervisor and co-supervisor, Assoc. Prof. Kang Hway Chuan and Assoc. Prof. Tok
Eng Soon, for their mentorship and time taken to vet through, reprove and approve my
thesis.
The Department of Chemistry, NUS, as well as Chartered Semiconductor Manufacturing
Ltd., Singapore, for the scholarship and scholarship top-up provided during the course of
this work.
My research group mates, Sheau Wei, Shi Jing, Li Qiang and Sofian for their time in
discussion and their advice.
My friend, Serene, for the precious time taken to proof read my thesis.
My parents, Mabel and Jack, and auntie Sandy, for their emotional and moral support
during the course of this work.
My sibling, Tian Xiang and Vera, for helping me to check through the references made in
this work and helping with the printing logistics.
My Husband and family, Chin Ming and Mr. and Mrs. Chong, for their patience and
understanding during the times that I needed to focus on the writing of my thesis.
And to the Almighty God, who made all things possible.
Table of Contents
II
Table of Contents
Description Page number
Acknowledgement I
Table of Contents II – IV
Summary V
List of Tables VI – VII
List of Figures VIII – XIII
Chapter 1 Introduction 1 – 10
1.1
Motivation & Research Objectives 1
1.2
Organization of thesis 10
Chapter 2 An overview of the Silicon(100) and Silicon-
Germanium(100) surfaces and related studies
11 – 39
2.1
The clean silicon (100) and silicon-germanium (100)
surfaces
11
2.2
The hydrogenated surface 17
2.3
The decomposition of Silane and Disilane 20
2.3.1
Silane 20
2.3.2
Disilane 23
2.4
Decomposition of silyl group and the configuration of
the decomposition product
27
2.5
Decomposition of silylene group 30
2.6
Diffusion of silylene 34
2.7
Diffusion on Strained Silicon 37
Table of Contents
III
Chapter 3 Theoretical Background 40 – 67
3.1
The Schrödinger equation 40
3.2
Born-Oppenheimer approximation 41
3.3
Variational Principle 42
3.4
Many-Body problem 44
3.5
Hartree and Hartree-Fock methods 45
3.6
Density Functional Theory 48
3.6.1
The Hohenberg-Kohn Theorems 49
3.6.1.1
The First Hohenberg-Kohn Theorem 49
3.6.1.2
The Second Hohenberg-Kohn Theorem 51
3.6.2
The Thomas-Fermi Model 52
3.6.3
The Kohn-Sham approach 53
3.6.3.1
Exchange and correlation energy 57
3.6.3.1.1
LDA 57
3.6.3.1.2
GGA 59
3.6.3.1.3
Perdew-Berke-Ernzerhof
functional
61
3.7
Implementation for surface calculations 63
3.7.1
Planewave basis 63
3.7.2
Pseudopotentials 66
Table of Contents
IV
Chapter 4
Calculation details – Ab initio calculations using the slab
model
68 – 72
4.1
Overview 68
4.2
Comparison between LDA and GGA 70
Chapter 5 Decomposition of SiH
3
to SiH
2
on Si(100) – (2×1) 73 – 95
5.1
Introduction 73
5.2
Results and Discussion 79
5.3
Conclusions 95
Chapter 6 Diffusion of SiH3 decomposition products on Si(100) –
(2×1)
96 – 115
6.1
Introduction 96
6.2
Results and Discussion 101
6.3
Conclusions 115
Chapter 7 Diffusion on strained and germanium-doped silicon
surface
116 - 128
7.1
Introduction 116
7.2
Results and Discussion 119
7.3
Conclusions 128
Chapter 8 Final Conclusions and Recommendations 129-134
8.1
Overview of conclusions 129
8.2
Recommendations for future work 134
Chapter 9 Bibliography 135 - 154
Summary
V
Summary
This thesis summarizes some of the work done in an attempt to elucidate the
mechanisms of several surface processes. The focus of this work was on the processes
occurring on the surface of pure, strained silicon(100)-2×1 as well as silicon-germanium
during the growth of silicon by gas-source molecular beam epitaxy (GSMBE). First-
principles calculations were mainly used in this work. The surface processes of interest
include the initial decomposition process of the silyl species arising from silane and
disilane and the surface diffusion process of the decomposition. An attempt was made to
address several puzzles pertaining to the growth of silicon by GSMBE using silane and
disilane as precursors.
Our results on the energetics of various species are consistent with those that had
been reported in the literature, and we added on to the understanding of this topic by
providing justification using kinetics. We had also trace out the path by which these
species take on the surfaces of the above mentioned substrate.
List of Tables
VI
List of Tables
Table 1.1
A summary of the Semiconductor Industry Association (SIA) National Technology
Roadmap for Semiconductor (NTRS; Adapted from ITRS 2005 update, Overall roadmap
technology characteristic.
Table 1.2
A non exhaustive summary of the methods employed in the study of the surface
processes occurring during the growth of silicon. These are listed randomly not based on
preference, priority or seniority.
Table 2.1
Decomposition temperature of substrate-hydrogen bond estimated by different
experimental techniques.
Table 2.2
Kinetic parameter for first order H
2
desorption from Si(100)
Table 2.3
Kinetic parameter for first order H
2
desorption from Ge(100)
Table 2.4
Variation of initial sticking coefficient of silane with respect to surface temperature.
Table 2.5
Variation of sticking coefficient of silane with respect to the surface hydrogen coverage.
Table 2.6
Variation of initial sticking coefficient of disilane with respect to surface temperature at
different incident kinetic energy
Table 2.7
Fragments of Si
x
H
y
observed with respect to temperature
Table 2.8
Kinetic parameters for the decomposition of silane and disilane
List of Tables
VII
Table 2.9
Kinetic parameters for the decomposition of SiH
2
Table 2.10
Temperature window for SiH
2
decomposition estimated by different techniques.
Table 4.1
Comparison of our GGA & LDA calculations.
Table 4.2
Comparison of our GGA calculated structure with literature values.
Table 5.1
Bond lengths and bond angles for the intra-row and the on-dimer configurations
illustrated in Figs. 5.2 and 5.3. Lengths a – h are in angstroms, angles i - j are in degrees.
Table 5.2
A summary of the methods previously used and the relative adsorption energetics of the
on-dimer and intra-row configuration on clean and co-adsorbed silicon surfaces
Table 6.1
Diffusion barrier of silylene with and without co-adsorbed hydrogen atom. The starting
structure and ending structure are labeled according to that illustrated in figure 6.2.
Table 8.1
A summary of the diffusion barrier corresponding to figure 8.1
List of Figures
VIII
List of Figures
Figure 1.1
Surface processes occurring during growth. Illustrated processes include Nucleation,
Migration, Inter-diffusion, Adsorption and Desorption. This figure omits details of
pyrolysis reaction and contains only processes related to physical deposition.
Figure 2.
Silicon crystal structure – the diamond structure. The (100) plane is outlined in grey.
Figure 2.2
An illustration of the various steps on the silicon (100) surface
Figure2.3
An illustration of the monohydride and the hemihydride.
Figure 2.4
An illustration of silane decomposition.
Figure 2.5
SiH
4
decomposition at different temperature regime.
Figure 2.6
Si
2
H
6
decomposition mechanism
Figure 2.7
Local arrangement of the silylene species on the Si(100) surface
Figure 2.8
A schematic diagram showing the two types of dihydrides – adjacent dihydrides and
isolated dihydrides. An illustration of how coupled monohydride can be generated by the
surface rearrangements of isolated dihydrides.
Figure 2.9
A schematic diagram showing the possible decomposition mechanism of silylene group.
List of Figures
IX
Figure 2.10
An illustration of the diffusion mechanisms proposed by Bowler et. al. [112] (a) on-dimer
to on-dimer hop (represented by red arrows) with a barrier of 1.4 eV (b) intra-row to
intra-row hop (represented by blue arrows) with a barrier of 1.4 eV (c) on-dimer to intra-
row (represented by black arrows) with a barrier of 1.1 eV
Figure 3.1
An illustration of the individual terms in the Hamiltonian and what they represent. While
i and j run over N electrons, A and B denote the M nuclei in the system of interest.
Figure 3.2
A simplified illustration of the pseudo-potentials. Thick curves represent the real
potential of the electrons while the thin curve represents the pseudo-potential of the
electrons. It is important to note that these curves are well matched at the valence electron
region and thereby are useful when we are only concerned with the interactions of the
valence electrons.
Figure 4.1
An illustration of the slab model that we used for our calculations
Figure 4.2
An illustration of the “2 by 2” supercell, “2 by 4” supercell and the “4 by 2” supercell
used in this series of calculations
Figure 4.3
An illustration of how strain is modeled in our calculation. On the left of the figure is the
unstrained slab. On the right of the figure is the strained slab. When a slab undergoes
expansion in the x-y plane, there is an observed compression of the slab in the direction
perpendicular to the x-y plane. (Not drawn to scale).
Figure 4.4
An illustration of slab compression due to strain. dxy refer to the distance between the xth
layer and the (x+1)th layer. With layer 1 referring to the topmost surface layer. From our
calculation, the average inter-layer distances of silicon decreased from 2.49Å for 0%
strained slab to 2.37Å for the 4% strained slab.
Figure 5.1
An illustration of possible adsorption sites of the silylene group. Black circles in indicate
the silicon atom of the silylene group. Thick lines indicate the two hydrogen atoms of the
List of Figures
X
silylene group. Empty circles indicate the silicon atoms of the dimer. Dashed lines
indicate the bonds between silylene and surface silicon atoms. The difference between
the on-dimer and the in-dimer configuration is that in the former, only the π bond of the
dimer is broken while in the latter, both the σ bond and the π bond of the dimer are
broken to accommodate the silylene insertion.
Figure 5.2
An illustration of the silylene group adsorbed in the intra-row configuration without any
neighbouring hydrogen atom (structure A), with one co-adsorbed hydrogen atom
(structure B) and with two co-adsorbed hydrogen atoms (structure C). The labels a to k
indicate the lengths and angles given in Table 5.1. Buckled up atom on the dimer (dark
brown); buckled down atom on the dimer (light brown); un-buckled dimer (yellow).
Figure 5.3
An illustration of the silylene group adsorbed in the on-dimer configuration without any
neighbouring hydrogen atom (structure D), with one co-adsorbed hydrogen atom
(structure E) and with two co-adsorbed hydrogen atoms (structure F). The bond lengths
and angles of optimized structures denoted by a to k are given in Table 5.1. Buckled up
atom on the dimer (dark brown); buckled down atom on the dimer (light brown); un-
buckled dimer (yellow).
Figure 5.4
The positions of the silyl group () and the hydrogen atom (◊) along the decomposition
path to a) the intra-row configuration, and b) the on-dimer configuration. The initial,
transition and final states are denoted by I, T and F, respectively.
Figure 5.5
Plots of energy versus structure number for (a) the intra-row path and (b) the on-dimer
path. For both paths, structure number “0” corresponds to the initial structure. The initial,
transition and final states are denoted by I, T and F, respectively.
Figure 5.6
Plots of energy versus Si-H distance for the intra-row path () and the on-dimer path(◊).
The initial, transition and final states are denoted by I, T and F, respectively.
Figure 5.7
Structures of the (a) reactant, (b) transition and (c) product states for the intra-row path.
List of Figures
XI
Figure 5.8
A plot of work done on the silicon atom in the [110] direction along the dimer row during
the silyl decomposition into the intra-row silylene group. The initial position, transition
state and its final position are as indicated on the plot as I, T and F, respectively. It can be
seen from the plot that the silylene species gains energy as it moves in the direction of the
dimer row after it breaks apart from the silyl species.
Figure 5.9
Plots of work done on the hydrogen atom that dissociated from the silyl group during the
decomposition process: (a) work done in moving the hydrogen atom closer to the surface;
(b) work done in moving the hydrogen atom in the direction along the dimer bond. Its
initial position, transition state and its final position are as indicated on the plot as I, T
and F, respectively. It can be seen from both plots that the atomic hydrogen gains energy
in the exit channel of the dissociation path.
Figure 6.1
An illustration of the diffusion mechanisms proposed in Bowler’s work. (a) on-dimer to
on-dimer hop with a barrier of 1.4 eV (b) intra-row to intra-row hop with a barrier of 1.4
eV (c) on-dimer to intra-row with a barrier of 1.1 eV
Figure 6.2
An illustration of the Si(100) surface from the top view. Surface dimers are shown by
open circles joint by a horizontal line. Capital letters A-E and black dots marks the
different local minima the silylene group could exist in. Small letters a-d and crosses
marks the various saddle points. Subscripts and superscripts differentiates equivalent
structures, for instance, A
1
, A
2
and A
3
are equivalent minima while a and a’ are
equivalent saddles. (a) silylene adsored on bare silicon (100) surface (b) silylene
coadsorbed with hydrogen on the silicon (100) surface.
Figure 6.3
This graph shows the superposition of the total energy variation when the two SiH
2
diffusional paths A
1
-C
1
-A
2
and B
2
-C
2
-B
3
are superimposed.
Figure 6.4
This graph shows the energy variation for the inter-row SiH
2
diffusion via the A
2
-D
1
-A
3
path.
Figure 6.5
This graph shows the total energy variation for the inter-row SiH
2
diffusion via the B
2
-
C
2
-B
3
-E
1
-B
4
path.
List of Figures
XII
Figure 6.6
An illustration of the absence of a direct path between structures A
1
and B
1
. A possible
path between A
1
and B
1
is via C
1
. The positions A
1
, B
1
and C
1
are illustrated in the lower-
right-hand corner of the figure.
Figure 6.7
Total energies variation along the path between structures A
1
and B
1
and corresponding
to the points with lateral coordinates of the silicon on the silylene fixed diagonally across
A
1
and B
1
.
Figure 6.8
Total energy variation for the SiH
2
diffusion path via the A-C-B path.
Figure 6.9
Total energy variation of the intra-row SiH2 diffusion path via the on-dimer-on-dimer
hop. The path in the presence of co-adsorbed H is plotted on the same graph as the path
on bare surface.
Figure 7.1
Plots of energy versus position of silylene-silicon in the direction along the dimer row for
the strained () and unstrained (O) silicon substrate. Positions of the silylene species (A
1
,
b, b’, C
1
, A
2
) are marked respectively as illustrated in the figure attached.
Figure 7.2
Plot of hydrogen diffusion energy barrier versus % of lattice strained applied. Dotted
lines joining the data points are trend-lines added to guide the eye. Vertical dotted line
denotes the transition point (at ~1.3% lattice strain) for gradual and drastic change in
hydrogen diffusion energy barrier.
Figure 7.3
Plot of relative energy versus % of lattice strain applied for site 1(),site 2(O) and site
3(∆). Each sites are clearly illustrated in Figure 4. Dotted lines joining the data points are
trend-lines added to guide the eye. Below ~1.3% lattice strain, the higher energy
hydrogen can only take on position illustrated by site 3. At ~1.3% lattice strain, hydrogen
can take on positions illustrated by either site 2 or site 3 with site 3 at a relatively higher
energy. Beyond ~1.3 % lattice strain, position illustrated by site 3 does not exist anymore.
This is a point beyond which hydrogen becomes unable to pin the buckling of
neighbouring dimers.
List of Figures
XIII
Figure 7.4
An illustration of the different adsorption sites of hydrogen. Corresponding to figure 7.3,
site 1 is the lowest energy state while site 2 and 3 is the higher energy state.
Figure 7.5
An illustration of the energy barrier for hydrogen to surmount for each forward and
reversed motion for 2 hydrogen adsorbed sites. x% Ge indicates the amount of
germanium incorporated in to the surface of the slab. Arrows “→” and “←” indicate
forward motion and backward motion respectively. Energy values indicated above the
arrows are the energy barrier for hydrogen to surmount for that particular motion.
Figure 7.6
Plot of hydrogen diffusion energy barrier versus % germanium content and the
corresponding strain induced. Dotted lines joining the data points are trend-lines added to
guide the eye. (O) Chemical effects of germanium, (◊) Combined effects of germanium
and strain, and () Effects of lattice strain corresponding to the % of germanium
incorporated are plotted on the same graph.
Figure 8.1
An illustration of the diffusion barrier for silylene and hydrogen to move on the silicon
(100)-(2×1) surface.
Chapter1 Introduction
1
1 Introduction
It is the aim of this work to study the atomic-scale processes occurring on the
surface of a semiconductor during the molecular beam epitaxial growth of the material.
The focus of this work is on the molecular beam epitaxy of silicon using precursors such
as silane and disilane on substrates such as silicon(100), germanium-doped silicon and
strained silicon.
1.1 Motivation & Research Objectives
Table 1.1: A summary of the Semiconductor Industry Association (SIA) National
Technology Roadmap for Semiconductor (NTRS; Adapted from ITRS 2005 update,
Overall roadmap technology characteristic.
Year of production
From 2005 - 2013
’05 ’06 ’07 ’08 ’09 ’10 ’11 ’12 ’13
Technology Node (nm)
65 45 32
DRAM ½ Pitch (nm)
80 70 65 57 50 45 40 36 32
MPU physical gate
length (nm)
32 28 25 23 20 18 16 14 13
The Semiconductor Industry Association (SIA) roadmap summary shown in
Table 1.1 above is a collective view on the future of the microelectronic industry which
facilitates the continuation of the evolution of the semiconductor industry along the
famous Moore’s Law [1]. While the Moore’s law is a “linear extrapolation” of industrial
trends, the roadmap shows a forecast based on laboratory technology as well as some
medium term predictions. Considering the rate at which the dimensions of semiconductor
devices are shrinking, a detailed knowledge and understanding of the fundamental growth
Chapter1 Introduction
2
processes in epitaxy is desirable, since at such scales, the effects of defects and
reconstructions on the fabrication and performance of microelectronic devices will
become increasingly important.
Furthermore, as the semiconductor devices continue to shrink to meet the
demands of Moore’s Law, atomic level interactions are bringing the anticipated
performance enhancement to the limits of the material in use. The main material, silicon
will eventually have to be replaced by materials such as strained silicon or silicon-
germanium in-order to continue enhancing the speed of semiconductor devices. This is
because it was found that by simply incorporating a strain on a semiconductor crystal, the
speed at which charges travels through the crystal can be significantly altered. Putting
that in perspective, straining the crystal by one percent can cause a five to twenty percent
enhancement in transistor speed. [2]
In the growth of silicon and related materials using chemical vapor deposition or
gas-source molecular beam epitaxy technique, the common gas-source precursors
employed in the reactions are silane and disilane. The mechanisms of the pyrolysis of
these precursors have been an area of intense research for many years. There have been
debates about whether the kinetics of the pyrolysis is controlled by homogeneous gas
phase reactions or by heterogeneous gas-surface reactions. Much of the earlier work by
Purnell [3] and Walsh [4] concluded that silane thermolysis is primarily a homogeneous
process. However it was due to more research progress in this area later in the 1980s that
led people to the current understanding of these reactions. It is now generally accepted
that surface reactions contribute significantly to the overall rate of dissociation of these
Chapter1 Introduction
3
precursors. Especially at conditions of low pressure and high temperature employed
during growth, surface pyrolysis of the growth precursors predominates.
The low-temperature reactivity of the silicon(100)-(2×1) surface toward silane
and disilane has been attributed to the surface dangling bonds. As silane and disilane
chemisorbs on the growing surface, they readily decompose upon interacting with
available dangling bonds on the surface. Both precursors dissociate to first give SiH
3
and
eventually other SiH
x
products. It is the subsequent decomposition of the SiH
x
that leads
to film growth and H
2
evolution. The availability of dangling bonds on the surface is a
key factor for growth. Various investigations have demonstrated that when the surface
dangling bonds are passivated, with e.g. hydrogen, growth is severely retarded.
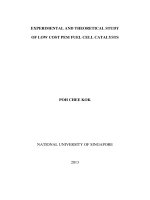
Figure 1.1: Surface processes occurring during growth. Illustrated processes include
Nucleation, Migration, Inter-diffusion, Adsorption and Desorption.
This figure omits details of pyrolysis reaction and contains only processes related to
physical deposition.
Molecular
Beam
Inter-diffusion
Desorption
Adsorption
Migration
Nucleation
Substrate
Completed
layers
Forming
layers
Overgrowth
Chapter1 Introduction
4
Figure 1.1 above shows some examples of the various surface processes that are
occurring during molecular beam epitaxy of thin films. They include adsorption,
migration, nucleation, inter-diffusion and desorption. Various research groups all over the
world have already been studying the growth processes of silicon since the late 60’s.
Many experimental techniques have been employed throughout the quest to understand
such processes.
Chapter1 Introduction
5
Table 1.2: A non exhaustive summary of the methods employed in the study of the surface processes occurring during the growth
of silicon. These are listed randomly not based on preference, priority or seniority.
Methods employed Research Groups
Electron Microscopy United Aircraft Research Laboratories, East Hartford, Connecticut
[5]
(Since late 60’s).
Optical microscopy Research Institute of Electrical Communication, Tohoku University, Sendai, Japan
[6]; Semiconductor Research Institute, Sendai, Japan
[6].
UV photoemission spectroscopy Bell Laboratories (since around late 70’s) [7-15]; Max-Planck-Institut für
Festkörperforschung (since around late 70’s)
[16].
Low energy electron diffraction
Bell Laboratories (since around late 70’s)
[7-15]; Department of Chemical
Engineering, Massachusetts Institute of Technology (since around late 80’s) [17; 18;
19].
Reflection high energy electron diffraction Department of Physics and Interdisciplinary Research Center for Semiconductor
Materials, Blackett Laboratory [20, 21]; Imperial College of Science, Technology and
Medicine
[20, 21].
Chapter1 Introduction
6
Methods employed
Research Groups
Infrared spectroscopy
Bell Laboratories (since around late 70’s) [7-15]; Research Institute of Electrical
Communication, Tohoku University
[22-25]; The Graduate University for Advanced
Studies in collaboration with the Department of Vacuum UV Photoscience, Institute
for Molecular Science
[26].
Static Secondary Ion Mass Spectroscopy
Department of Chemical Engineering, Massachusetts Institute of Technology (since
around late 80’s)
[17-19].
Temperature Programmed Desorption;
Temperature Desorption Spectroscopy
Department of Chemical Engineering, Massachusetts Institute of Technology (since
around late 80’s)
17-19]; Department of Chemistry, University of California [28];
Department of Physics and Interdisciplinary Research Center for Semiconductor
Materials, Blackett Laboratory
[20, 21]; Imperial College of Science, Technology and
Medicine [20, 21].
Chapter1 Introduction
7
Methods employed Research Groups
Supersonic molecular beam scattering
techniques
School of Chemical Engineering, Cornell University [27-29].
Scanning Tunneling Microscopy Department of Chemistry, University of Wisconsin [30-32]; Abteilung
Oberflächenchemie und Katalyse, Universität Ulm
[33-36]; Department of Materials,
Oxford University
[37-41]; Faculté des Sciences de Luminy, Groupe de Physique des
Êtats Condensés, Université de la Mediterranée [42].
Electron beam irradiation technique Advanced Technology Research Center, Mitsubishi Heavy Industries
[43, 44].
Semi-empirical calculation Department of Chemistry, Oklahoma State University
[45, 46].
First Principle Total Energy calculations Philips Research Laboratories, The Netherlands
[47, 48]; National Research Institute
for Metals, Japan
[49]; Institute of Physics, University of Tsukuba, Japan [50,51];
Centro de Ciencias de la Materia Condensada, Universidad Nacional Autonoma de
Mexico
[N. Takeuchi, Surf. Sci. 529, 274 (2003)].
Kinetic model calculations Abteilung Oberflächenchemie und Katalyse, Universität Ulm
[33-35, 52].
Chapter1 Introduction
8
Methods employed Research Groups
Density functional calculations Department of Materials, Oxford University [37-41]; School of Physics, Georgia
Institute of Technology [53]; Department of Chemistry and Biochemistry, University
of Delaware [54, 55]; Department of Chemistry, Pennsylvania State University [56];
Department of Chemical Engineering, University of California-Santa Barbara [57-61];
Thermosciences Institute, NASA Ames Research Center [61]; Department of
Chemistry, Tamkang University [62, 63]; Department of Physics, Tamkang University
[63]; Department of Material Science and Engineering, Stanford University [64];
Department of Chemical Engineering, Stanford University [64]
Molecular dynamics simulation
Department of Chemistry and Physics, University of California, Santa Barbara [57,
58]; Department of Chemical Engineering, University of California-Santa Barbara
[57-61]
Monte Carlo simulation Department of Chemical Engineering, University of California-Santa Barbara
[57-61]
Molecular statics simulation Department of Chemical Engineering, University of California-Santa Barbara [57-61]
Chapter1 Introduction
9
While current experimental methods, such as the atom-tracking STM, allows one
to measure individual dynamic events occurring over time scales as short as 5
milliseconds, they are still not good enough for the experimental determination of the
atomic pathway of SiH
3
decomposition. Five milliseconds is a lot longer than the 10
-13
seconds timescale for typical elementary processes such as a silyl group hopping from
one adsorption site to another or its molecular decomposition. Hence in order to
understand the details of the motion of the atoms during growth, theoretical analysis is
essential. Various theoretical groups have therefore worked on this problem using
methods ranging from semi-empirical to density functional theory.
As mentioned earlier, the most common precursors for the gas source molecular
beam epitaxy of silicon are silane and disilane. It has been demonstrated that the growth
rate of silicon on the silicon(100) surface is enhanced when disilane is used instead of the
conventional silane. This is because of the higher adsorption rates associated with the
greater ease with which silicon-silicon bonds are broken compared to silicon-hydrogen
bonds [42, 65y studies indicate fact that when these precursors dissociate on the substrate
surface, especially at low coverage, they form the trihydride (SiH
3
), and dihydride (SiH
2
)
before they decompose to a surface monohydride (SiH) species [17, 20, 21, 66]. Without
doubt, one common species will be formed momentarily, the SiH
3
species. According to
Gates et. al. [66], the initial decomposition of SiH
3
occurs at substrate temperature of
150-200K regardless of the coverage. Gates et. al. also reported that SiH
2
decomposes at
a temperature of 750K. Hence SiH
2
and H will be the predominant growth species during
growth. The bulk of this work is therefore dedicated to the understanding of how these
Chapter1 Introduction
10
species are formed on the surface and how these species move on the surface after their
formation to achieve growth.
1.2 Organization of Thesis
The motivation of this work has been briefly discussed in this section of the
thesis. In the subsequent section, an overview of related work carried out by other
researchers will be discussed. Chapter 3 and 4 will be dedicated to the discussion of the
calculation method involved during the course of this work. In the discussion section
starting from chapter 5 to chapter 7, some of the findings from this work will be reported.
Firstly, the relative stabilities of the various stable configurations of SiH
2
on the surface
of silicon(100) will be presented. These SiH
2
species are decomposition products of the
SiH
3
species which are the most prevalent growth species on the surface during GSMBE.
Next, the work that go on to elucidate the possible pathway via which the SiH
3
species
decomposes will be discussed. Most of the previous theoretical investigations on this
topic address only the energetics of the initial and possible final states, and only a few
address the dissociation pathway of the SiH
3
group. In this work, an attempt was made to
trace the reaction path and hence gain insight into the kinetics of the SiH
3
decomposition
process in addition to the studies of the energetics. Finally, the surface diffusion process
of the decomposition products of SiH
3
namely, SiH
2
and H, on silicon(100) will be
discussed and compared to that on strained silicon to understand the impact of strain and
germanium on the surface diffusion behavior.