Atomistic simulation on low k ultra low k materials
Bạn đang xem bản rút gọn của tài liệu. Xem và tải ngay bản đầy đủ của tài liệu tại đây (3.45 MB, 141 trang )
Atomistic Simulation of Low-k/Ultra Low-k Materials
DAI LING
(M. Eng, NUS)
(B. Eng, SJTU)
A THESIS SUBMITTED
FOR THE DEGREE OF DOCTOR OF PHILOSOPHY
DEPARTMENT OF MECHANICAL ENGINNERING
NATIONAL UNIVERSITY OF SINGAPORE
2007
II
ACHNOWLEDGEMENTS
First and most, I am sincerely grateful to my supervisors A/Prof. Vincent, Tan Beng
Chye, Dr. Wu Ping, Dr. Chen Xiantong and Dr. Yang Shuowang who have patiently
helped me throughout the project. Discussion with them is always fruitful, more
importantly, encouraging. Their advice will always be appreciated.
Great thanks to my wife, my parents and family members who have been always
strongly supporting my research works. They are part of my life.
Thanks to Institute of High Performance Computing and Institute of Microelectronics
that offered me computational facilities and experimental resources, which are the
basement for carrying out my works.
Thanks to the Nanoscience and Nanotechnology Initiative, NUS, that offered me
financial support for my research work.
Thanks to the staffs at the department of MIC, Institute of High Performance
Computing, for their friendships and moral support they had lent when I most needed it.
Finally, thanks to all the friends who know me, and give me their kind support. All
have been deeply impressed in my mind.
III
TABLE OF CONTENTS
Page
ACKNOWLEDGEMENTS II
SUMMARY VI
LIST OF PUBLICATIONS VIII
LIST OF TABLES IX
LIST OF FIGURES X
1. Introduction 1
1.1 Cu conductor 1
1.2 Low Dielectric Constant (low-k) Materials 3
1.2.1 Requirement of low-k materials 4
1.2.2 Classification of low-k materials 6
1.2.3 Deposition of low-k polymers 8
1.2.4 SiLK 9
1.3 Diffusion Barrier 12
1.4 Objective 15
2. Literature Review 17
2.1 Diffusion 20
2.2 Diffusion Barrier 29
2.3 Pore-sealing 37
2.4 Ta Crystal Structure 39
2.5 Interfacial Mechanical Property 42
2.6 Summary 44
3. Methodology 50
IV
3.1 Monte Carlo Method 50
3.2 Molecular Dynamics 52
3.3 Ab initio Molecular Dynamics (AIMD) 59
3.4 Model Building 63
3.4.1 SiLK 63
3.4.2 Fabrication process 65
3.5 Simulation Conditions 68
3.5.1 Time step 68
3.5.2 Pseudopotential 69
3.5.3 Cutoff energy 70
3.5.4 K-points setting 71
3.5.5 Equilibration 72
4. Investigation of Metal Diffusion into Polymers 77
4.1 Introduction 77
4.2 Methodology 78
4.3 Diffusion analysis 79
4.4 Conclusion 83
5. Investigation of Ta Film Growth Mechanisms and Atomic Structures on Polymer and
SiC Amorphous Substrates 84
5.1 Introduction 84
5.2 Experiment 84
5.3 Simulation 87
5.4 Transferability of model size 94
5.5 Surface roughness 96
5.6 Conclusion 96
V
6. Hydrogen-induced Degradation of Ta Diffusion Barriers in Ultra Low-k Dielectric
Systems 99
6.1 Introduction 99
6.2 Methodology 100
6.3 Results and discussions 102
6.4 Conclusion 106
7. Understanding the Nitrogen-induced Effects on Structural Performance in Ultra Low-
k Dielectric Systems 109
7.1 Introduction 109
7.2 Methodology 110
7.3 Results and discussions 113
8. Conclusion 122
Appendix 125
VI
SUMMARY
The introduction of Cu and low-k/ultra low-k dielectric material, has incrementally
improved the situation as compared to the conventional Al/SiO
2
technology by reducing
both resistivity of and capacitance between wires. In order to curb the diffusion of Cu into
the dielectrics, it has been proposed to implement a layer of Ta between Cu and
dielectrics. However, the suitability of the Cu/Ta/dielectrics system is not well established
yet. Theoretical studies are required to investigate the structure, property and functional
mechanisms of these materials. In this report, we carried out ab initio molecular dynamics
simulations to characterize these materials.
Firstly, ab initio molecular dynamics simulations were carried out to study the motion
of single metal atoms and atom clusters of Cu and Ta in SiLK low-k polymers to gain an
insight into their diffusion mechanisms and characteristics. The analysis suggests that Cu
atom motions are largely effected by jumps between cavities inside the polymer and that
Ta is more sluggish than Cu not only because of its larger mass but also because of
stronger affinity to polymers. It was also found that crosslinking of polymers with the
same density had not affected much on the motions of metal atoms or clusters.
Then, large scale ab initio molecular dynamics simulations were undertaken to study
the entire process of sputtering deposition of Ta atoms and Ta film formation on two
different substrates, SiLK low-k polymer and amorphous SiC. The calculation results
gave insights into the Ta film growth mechanisms and their atomic ordering
configurations on these substrates. Their effectiveness in blocking Cu diffusion was also
investigated. Reasons for experimental observations of poor and good diffusion-barrier
performances of Ta-polymer and Ta-SiC dielectric systems respectively were revealed
from the simulations.
VII
With the introduction of ultra low-k dielectric polymer materials, the porous
dielectrics are normally sealed by a SiC film before the deposition of a Ta diffusion
barrier layer. However, the Ta barrier effects are negated when the SiC films are
fabricated by Plasma-Enhanced Chemical Vapor Deposition (PECVD). Through
simulations, we found that the barrier degradation is due to H atoms introduced during
PECVD. The H impurities diffuse into and transform an otherwise dense Ta layer into a
loose amorphous phase which is ineffective as a diffusion barrier.
Lastly, simulations were performed to investigate how Cu/ultra low-k systems are
improved when N is incorporated into the pore-sealing layers. It was found that the high
affinity of N to Ta and H gives rise to new phases that prevent H atoms from penetrating
the Ta diffusion barrier layer. Consequently, the Ta layer forms organized structures with
good barrier performance and electrical conductivity. Furthermore, a continuous ductile
film is formed to seal the highly porous polymer dielectrics. Interfacial adhesion between
the pore-sealing layer and the dielectrics is also enhanced by inter-diffusion.
In conclusion, after a serial of simulation works, a Cu/Ta/SiCN/ultra low-k polymer
system is proposed that is able to cope with the industrial size shrinking trend and offer
satisfactory functional performances.
VIII
LIST OF PUBLICATIONS
Journal papers
[1] Ling Dai, Shuo-Wang Yang, Xian-tong Chen, Ping Wu, V.B.C. Tan, “Investigation of metal
diffusion into polymers by ab initio molecular dynamics”, Applied Physics Letters, 87
(2005) 032108.
[2] Ling Dai and Shuo-Wang Yang, Xian-tong Chen, Ping Wu, V.B.C. Tan, “Investigation of Ta
film growth mechanisms and atomic structures on polymer and SiC amorphous
substrates”, Applied Physics Letters, 88 (2006) 112902.
[3] Ling Dai, Shuo-Wang Yang, Xian-tong Chen, Ping Wu, V.B.C. Tan, “Large-scale ab initio
molecular-dynamics simulations of hydrogen-induced degradation of Ta diffusion
barriers in ultralow-k dielectric systems”, Applied Physics Letters, 90 (2007) 1.
[4] Ling Dai, V.B.C. Tan, Shuo-Wang Yang, Xian-tong Chen, Ping Wu,
“Understanding
Nitrogen-induced effects on the performance of Ultra Low-k Dielectric Systems
through Ab Initio Simulations”, Surface Science, 601 (2007) 3366.
Conference papers
[1] Ling Dai, Shuo-Wang Yang, Xian-tong Chen, Ping Wu, V.B.C. Tan, “Diffusion of Single Cu
and Ta Atoms in Silk-like Amorphous Polymer”, The International Conference on
Computational Methods, December 15-17, 2004, Singapore
[2] Ling Dai, Shuo-Wang Yang, Xian-tong Chen, Ping Wu, V.B.C. Tan, “Investigation of
Copper and Tantalum atoms Diffusion in Polymers by ab initio Molecular Dynamics”,
Technical Proceedings of the 2005 Nanotechnology Conference and Trade Show, Volume 3,
Page 107-110, Anaheim, California, U.S.A.
[3] Ling Dai, Shuo-Wang Yang, Xian-tong Chen, Ping Wu, V.B.C. Tan, “Study of Adhesion
Properties of Ta with Si-based Compounds via ab initio Simulations”, 3rd International
Conference on Materials for & 9th International Conference on Advanced Technologies
(ICMAT 2005) Advanced Materials (ICAM 2005) July3-8, 2005, Singapore
[4] Ling Dai, Shuo-Wang Yang, Xian-tong Chen, Ping Wu, V.B.C. Tan, “Atomistic Simulation
of Cu/low-k materials”, SERC Inter-RI Poster Symposium, 3
rd
Best Technical Content
Award, Sep 10, 2005, Institute of Materials Research and Engineering, Singapore
IX
LIST OF TABLES
Table-1-1. Some properties of SiLK. 10
Table-2-1. Predicted requirements for the node size, barrier thickness and k values for the
near future years. 17
Table-2-2. Lattice parameter and electrical resistivity of the two Ta crystal structures. 39
Table-3-1. Values of α
i
parameters of the highest derivative order q. 59
Table-3-2. Parameters for testing the pseudopotential and exchange-correlation functions.
All the lengths are in unit of Å and energies in unit of eV. 70
Table-5-1: Calculated bonding energy (eV) and bond length (Å). 92
Table-7-1. Element ratios and precursors of pore-sealing materials. The SiN composition
is taken from the well known α-Si
3
N
4
; SiCN is prepared by solid solution; and
the rest two are fabricated by chemical reaction. 112
Table-7-2. Binding energy and length of chemical bonds. These values are for the close-
packed structures by ab initio calculations. 115
Table-7-3. Primitive cell parameters of the Ta structures on various pore-sealing
substrates. Except the β-Ta, all the structures are quite close in dimensions.118
X
LIST OF FIGURES
Fig-1-1. Comparison of electromigration lifetimes between e-Beam PVD Cu and
sputtering PVD Al. All liners are as functions of temperature. 2
Fig-1-2. Comparison of (a) traditional process for Al metallization and (b) damascene
process for Cu metallization. 5
Fig-1-3. Classification of low-k materials. 7
Fig-1-4. Stress-strain curve of SiLK. 10
Fig-1-5. Yield stress-temperature curve of SiLK. 11
Fig-1-6. Predicted (solid line) and measured (markers) fracture toughness of silica-based
materials versus dielectric constant in comparison with SiLK. 11
Fig-1-7. Cu-Ta binary phase diagram showing complete immiscibility up to their melting
points. 14
Fig-2-1. Cross-section TEM micrographs of Cu evaporated on polyimide. In each case
the light area is the polyimide. The dark area on top of the polyimide is the Cu
film and the substrate is a thick Al film. 19
Fig-2-2. Cu concentration-depth profile curves at temperatures 500, 650 and 700℃. 24
Fig-2-3. Diffusion coefficient of Cu inside a Ta barrier layer at temperatures between
500-700℃. 24
Fig-2-4. SIMS profile of Cu concentration curves at different thermal treatment
conditions. 26
Fig-2-5. Monte Carlo simulations of Cu cluster formation and diffusion in polyimide: (a)
Cu cluster formation in a top view of the polyimide surface just after deposition;
(b) cross-sectional view after 80s of diffusion at 320℃; (c) cross-sectional view
after 80s of diffusion at 320℃ with metal-metal interaction turned off. 27
Fig-2-6. Categorization of diffusion barriers (a) sacrificial barrier; (b) stuffed barrier; (c)
amorphous barrier. 29
Fig-2-7. Ternary phase diagram of Cu-Ta-Si compounds at the elevated temperature of
700℃. 31
XI
Fig-2-8. Comparison of the failure temperature of Ta barrier layers fabricated by PVD
and ALD on Si <111> phase and polycrystalline Si. 32
Fig-2-9. Diffusion coefficient of Cu inside the TaN film. T
m
is the melting temperature of
TaN; Q is the activation energy in Eq-2-9. 34
Fig-2-10. TEM image of Cu/10 nm TaN/Si structure after annealing at 600℃. 35
Fig-2-11. TEM images of the two structures as (a) Cu/Ta
2
N/SiO
2
and (b)
Cu/Ta
30
Si
18
N
52
/SiO
2
when annealed at 600℃. Grain boundaries can be
defined in Ta
2
N layer, while Ta
30
Si
18
N
52
keeps continuous. 36
Fig-2-12. Mean Time-to-Failure and surface roughness for various films with 0.3 and 2
μm thickness. The PVD fabricated TaSiN film exhibits the best properties. 37
Fig-2-13. TEM image of Cu/Ta structure annealed at 500℃, in which a 2 nm thick Ta
layer was observed. 40
Fig-2-14. TEM image of Cu/Ta structure annealed at 600℃, in which α-Ta phase was
created via phase transformation. 41
Fig-2-15. Schematic diagram for the Ta phase transformation and the inter-diffusion
between Ta and Cu. 41
Fig-2-16. TEM image of α-Ta layer growing on the TaN upon deposition. 42
Fig-2-17. Cohesive strength versus dielectric constant, indicating a linear relationship
between the two. 43
Fig-3-1. Monomer of the aromatic hydro-carbon chains. 63
Fig-3-2. Procedure for generating the initial cell structure. 64
Fig-3-3. Crosslinking of SiLK backbone chains via soft crosslinking agents. 65
Fig-3-4. Sputtering deposition for thin films in a vacuum chamber. Ar
+
is used as the
source ion to bombard the target atoms down to the substrate. 66
Fig-3-5. Model of sputtering process. 68
Fig-3-6 Total energy of SiLK (left) and Ta/SiC (right) models as function of cutoff
energies. 71
Fig-3-7 Total energy of SiLK (left) and Ta/SiC (right) models as function of K-points
settings. In the Ta/SiC model, only 9 Ta atoms are included due to the
XII
computational abilities. 72
Fig-3-8 The plot of electron kinetic energy, ion kinetic energy, ion temperature, potential
energy and total system energy for the model SiLK (left) and Ta/SiC (right). 74
Fig-4-1. Periodic model of amorphous polymer. (a) original view; (b) in-cell view. 78
Fig-4-2. Motion speeds of Cu and Ta atoms in linear amorphous polymer. 79
Fig-4-3. Total normalized displacement of Cu and Ta in SiLK-like LAP and crosslinked
polymer. 80
Fig-4-4. Adhesion locations of Ta with SiLK polymer chain. 80
Fig-4-5. Crosslinking of linear chains by –CH
2
– groups. 81
Fig-4-6. Metal cluster models for Cu and Ta. 82
Fig-4-7. Total displacement for Cu (left) and Ta (right) cluster diffusion inside SiLK
matrix. 82
Fig-5-1. TEM cross-sectional images of (a) Cu/Ta/PS and (b) Cu/Ta/SiC/PS systems. 85
Fig-5-2. Element depth profiles from SIMS analyses for (a) Cu/Ta/PS and (b)
Cu/Ta/SiC/PS systems. 86
Fig-5-3. Model for the Ta sputtering deposition process on substrates. 88
Fig-5-4. Ta film atomic structures after three batches of deposition of 9 Ta atoms per
batch on (a) PS and (b) SiC. Figures of top view (upside) show only Ta atoms
for clarity. 89
Fig-5-5. RDF of nearest pair Ta atoms on various surfaces. 91
Fig-5-6. Preferred bonding locations of Ta to PS monomer. Light atoms stand for H; grey
atoms stand for C and dark atoms stand for Ta. 92
Fig-5-7. The average horizontal distances traveled by each layer of Ta atoms. 93
Fig-5-8. CPMD simulated structures for Cu/Ta/substrate models. 94
Fig-5-9 Two equilibrated Ta/PS model that comprise 98 (left) and 137 (right) atoms,
respectively. 95
Fig-5-10 Two equilibrated Ta/SiC model that comprise 90 (left) and 125 (right) atoms,
XIII
respectively. 95
Fig-6-1. (a) TEM cross sectional image of ULK/Si
x
C
y
H
z
/Ta interfaces. The ULK used is
porous SiLK
TM
, a polystryrene-based porous polymer with average pore size of
8.2 nm and bulk k value of 2.2. Ta atoms were sputtered onto the pore-sealing
layers to form a 10nm thick Ta barrier film, followed by the sputtering
deposition of 25nm thick Cu conductor film.
(b) SIMS profiles for ULK/Si
x
C
y
H
z
/Ta interfaces showing the penetration of Ta
and Cu atoms into the ULK polymer. 100
Fig-6-2. Structures of Ta atoms above three Si
x
C
y
H
z
amorphous surfaces of H molar
percentages (a) 15%, (b) 25% and (c) 35% respectively. Depositions were
carried out in two successive batches of 16 Ta atoms each via a 200 ps CPMD
simulation at 500K. 102
Fig-6-3. RDF of Ta structures on SiC:H substrates with different H concentration. The
curve for Ta structure on pure SiC was reported previously. 103
Fig-6-4. States of Cu diffusion into Ta after (a) 100 ps, (b) 300 ps and (c) one ns. The
bottom substrate is amorphous Si
x
C
y
H
z
with 35% H content. 106
Fig-7-1. TEM profile for (a) Ta/SiC:H/ULK and (b) Ta/SiCN:H/ULK. A comparatviely
mixed region was spotted at the SiCN:H/ULK interface. 111
Fig-7-2. SIMS profile of (a) Cu/Ta/SiC:H/ULK and (b) Cu/Ta/SiCN:H/ULK. It is clear
that the Ta barrier performance in greatly enhanced in the latter case. 111
Fig-7-3. Equilibrated Ta structures on various pore-sealing layers (a) pure SiN (b) pure
SiCN (c) SiN:H (d) SiCN:H (e) SiC:H (35% H concentration). All the Ta
structures look principle except the chart (e) where significant amount of H
atoms were popped up into the Ta layer. 113
Fig-7-4. Peak RDF values and corresponding interatomic distances for Ta structures on
various pore-sealing layers. The involvement of N atoms in the pore-sealing
layer is able to enhance the Ta layer towards more close-packed structures. 115
Fig-7-5. Complete RDF curves for Ta structures on various substrates as indicated in the
chart. 116
Fig-7-6. The equilibrated structures of Cu deposition on (a) Ta/SiC:H and (b) Ta/SiCN:H
show significant different diffusion barrier properties of the two Ta structures.
117
Fig-A-1. Equilibration plots for Ta/SiCH model. 125
Fig-A-2. Equilibration plots for Cu/Ta/SiCH model. 126
XIV
Fig-A-3. Equilibration plots for Ta/SiCNH model. 126
Fig-A-4. Equilibration plots for Cu/Ta/SiCNH model. 127
1
Chapter 1
Introduction
Traditionally, the ability to make electronic devices more compact and to add more
functionality is determined by the ability to manufacture integrated circuits at smaller
length scales. Product miniaturization has progressed at an exponential pace over the past
few decades and soon, the ability to pack in more and faster transistors will not be the
only impediment to further advances. With continuous scaling down of transistors,
interconnection speeds between transistors start to contribute significantly to the overall
performance of a product. Interconnection speeds are largely determined by the resistance
of wires and the capacitance of insulating dielectrics between wires. Shrinking the cross-
section of a wire increases its resistance and packing wires closer together increases
capacitance between the wires. It is predicted that delays in interconnection is posing
serious limitations to further enhancements in performance [1-1]. The most promising
approach to overcome such deficiencies is to use conductors with lower resistivity and
dielectrics with lower dielectric constant instead of the conventional Al and SiO
2
respectively.
1.1 Cu Conductor
Cu is currently the most cost effective candidate material to replace Al. Replacing Al
with Cu will result in a 36% decrease in resistivity. Although Ag has the lowest resistivity,
it is too expensive to justify just 6% reduction in resistivity compared to Cu. Moreover,
the application of Cu improves the resistance to electromigration, which is a phenomenon
associated with the drift of atoms in a metallic line under the influence of an electric field
in the direction of the electron flow. A typical comparison of electromigration between Cu
2
and Al fabricated by unpassivated Physical Vapor Deposition (PVD) in e-beam (Cu) or
sputtering (Al) is shown in Fig-1-1 [1-2].
Fig-1-1. Comparison of electromigration lifetimes between e-Beam PVD Cu and
sputtering PVD Al. All liners are as functions of temperature [1-2].
Apart from the low electrical resistance and satisfactory electromigration resistance,
Cu wiring is also found to allow high current density and increased scalability
comparable to that of Ti/Al wiring [1-2]. These benefits have enabled the scaling-down of
integrated circuits (IC) with high performance and high density needs. The industry has
been looking into implementing Cu instead of Al in ultra-large-scale integration (ULSI)
of ICs.
However, the transition to Cu-based interconnects has brought significant challenges
as Cu has relatively high mobility, which makes it easy to diffuse into the dielectrics,
hence cause system degradation. Studies into blocking Cu diffusion have become an
extremely popular topic of research.
3
1.2 Low Dielectric Constant (low-k) Materials
Besides the low resistance conductor, it is vital to use low-k materials so as to reduce
the signal delay which is related to the capacitance of the dielectrics.
Electrical permittivity (ε) is a physical quantity that describes how an electric field
affects and is affected by a dielectric medium. It is determined by the ability of a material
to polarize in response to an applied electric field, and thereby to cancel, partially, the
field inside the material. Therefore, permittivity relates to a material's ability to transmit
(or "permit") an electric field. The dielectric constant (k), also known as the relative
permittivity, is defined as the ratio of the permittivity of a substance (ε
s
) to that of the
vacuum (ε
0
) as shown Eq-1-1. It can also be considered as a measure of the extent to
which a substance concentrates the electrostatic lines of flux.
0
ε
ε
s
k = (Eq-1-1)
Changing the dielectrics in IC processing requires intensive research, development,
and integration engineering. A traditional dielectric is SiO
2
. However, its k value of 4.2 no
longer meets the industry requirements. In principle, a low-k material needs a k value less
than 4.2; any material with a k value lower than 2.4 is called as ultra low-k (ULK)
dielectrics.
A material containing polar components has a higher k value than one without [1-1],
because the dipoles align themselves with external electric fields. As a result, a capacitor
with a dielectric medium of higher k will hold more electric charge at the same applied
voltage or, in other words, its capacitance will be higher. Thus, decreasing dipole strength
or quantity is an effective way to reduce k. This means using materials with chemical
bonds of lower polarization than Si-O, such as Si-F or Si-C bonds. A more fundamental
reduction can be achieved by using virtually non-polar bonds, like C-C or C-H, in
materials like organic polymers.
4
The other method to reduce the k value is to reduce the material density, normally
though increasing the free volume via rearranging the material structure or introducing
porosity since air has the lowest k value of 1. Porosity can be constitutive or subtractive.
Constitutive porosity refers to the self-organization of a material. After manufacturing,
such a material is porous without any additional treatment. Such porosity is usually less
than 15% and pore size is around 1 nm in diameter. Subtractive porosity involves
selective removal of part of the material. This can be achieved via an artificially added
ingredient (e.g. a thermally degradable substance called a ‘porogen’, which is removed by
annealing to leave behind pores) or by selective etching. Subtractive porosity can be as
high as 90% and pore size varies from 2 nm to tens of nanometers. The organic polymer
can be treated with all three approaches: low polarization, constitutive porosity and
subtractive porosity, which make it a popular candidate as the low-k material.
1.2.1 Requirement of low-k materials
Compared to SiO
2
, low-k materials are mechanically weak, thermally unstable,
incompatible with other materials, and tend to absorb chemicals. There are five general
requirements for a low-k material to be successfully integrated: hydrophobicity,
mechanical stability, thermal stability, chemical and physical stability under processing
conditions, and compability with other materials [1-1].
A low-k material must be hydrophobic because water has extremely polar O-H bonds
and a k value close to 80. Even a small amount of absorbed water significantly increases
the total k value. As water is abundant in air, a low-k material should be as hydrophobic as
possible to prevent deterioration of its k value. This is especially important for porous
materials, as they have a large surface area per unit volume for water to be absorbed.
Hydrophobicity can be achieved by the introduction of Si-H or Si-CH
3
bonds. Oxygen-
5
free polymers are generally hydrophobic.
(a) (b)
Fig-1-2. Comparison of (a) traditional process for Al metallization and (b) damascene
process for Cu metallization.
The need of mechanical stability is of primary consideration in the introduction of Cu
as the electrical conductor. As shown in Fig-1-2, when Al is used, the substrate is coated
with Al, which is then patterned using positive photolithography and metal etching.
Unnecessary Al is removed by chemical mechanical polishing (CMP), leaving behind the
wires. The space between the freestanding wires is then filled with dielectrics (SiO
2
).
Unfortunately, Cu does not form volatile compounds with reactive gasses and, therefore,
etching cannot be used. As a result, the fabrication process is reversed. First, a substrate is
coated with a dielectric layer and trenches are formed by negative photolithography and
dielectric etching where Cu wires should be present. A Cu layer is then deposited by
electroplating to fill the trenches and excess Cu is polished away. This technology is
known as damascene because Cu lines embedded in dielectric resemble a damascene
decoration. In the last step of the damascene process, the dielectric must withstand
6
mechanical stresses during the Cu removal polish. Low-k dielectric materials must also be
able to survive stresses induced by the mismatch of thermal expansion coefficients or
mechanical stresses during the packaging process, when fully processed circuits are
connected to the outside world. Mechanical problem becomes even more crucial when
introducing pores in the dielectrics to develop the ULK materials.
Thermal stability is required for low-k materials to withstand the manufacturing and
processing temperature, which can be as high as 450℃ [1-3]. This is an issue for some
organic polymers, as they begin to decompose at lower temperatures. Furthermore, 3-6
cycles of annealing are necessary for some interconnects manufacturing processes, during
which sever shrinking, cracking or any other damage must be avoided completely.
To withstand various processes, such as etching and cleaning, chemical and physical
stability is also important for low-k materials. For example, oxygen plasma used during
patterning (trench etching) can potentially break Si-H and C-H bonds, replacing them
with highly polar Si-O, C-O bonds [1-1]. The processes have pronounced damaging
effects on porous ULK.
Finally, a broader requirement is the compability of the dielectric with other materials,
such as thermal expansion compatibility with Cu, adhesive properties with other materials
to avoid delamination, etc.
1.2.2 Classification of low-k materials
There are many low-k materials. They can be classified into two groups: Si-based or
non-Si materials (Fig-1-3). Si-based materials, in turn, can be divided into two subgroups:
silsesquioxane (SSQ)-based and silica-based [1-4].
7
Fig-1-3. Classification of low-k materials.
SSQ-based materials have silsesquioxane as the elementary unit. In microelectronic
applications, hydrogen-silsesquioxane (HSSQ) and methyl-silsesquioxane (MSSQ)
materials are well developed. MSSQ materials have a lower k value (2.8) compared to
HSSQ (k=3.0-3.2) because of the lager size of CH
3
group and lower polarizability of the
Si-CH
3
than Si-H. Normally, the materials evaluated for microelectronics applications are
not solely MSSQ, but mixtures of MSSQ and HSSQ.
The silica-based materials have the tetrahedral basic structure of SiO
2
. Lowering the k
value can be accomplished by replacing the Si-O bond with less polarizable bonds, such
as Si-F (producing F doped silica glasses [1-4]), Si-C or Si-CH
3
. The addition of CH
3
not
only introduces less polar bonds, but also creates additional free volume. Such silicon
oxycarbides (SiOCH) are constitutively porous with k values ranging from 2.6 to 3.
Non-Si based materials are mostly organic polymers, containing molecules with low
polarizability C-H bonds, and even totally non-polar covalent bonds, like C-C. Polymer
dielectrics can have k values lower than 2.5 without porosity. Furthermore, polymers are
easier to fabricate and modify by introducing constitutive or subtractive porosities. This
makes it possible to develop ULK (k<2.4) materials. The main disadvantage of low-k
polymers is their low thermal stability, softness, and incompability with the traditional
8
technological processes developed for SiO
2
-based dielectrics. Recently, low-k polymers
have become a hot research topic and many works have been carried out to develop
various low-k polymers and related processes [1-3]. In this report, the focus is on
polymeric low-k dielectric materials.
1.2.3 Deposition of low-k polymers
Low-k polymers can be deposited, either from solution by spin-coating or from the
gas phase by Chemical Vapor Deposition (CVD) [1-3].
Spin-coating is a traditional method, possible with any polymer that is soluble. The
structure of the spin-coating deposited polymer is known exactly, and hence optimization
of the polymer structure to improve adhesion, moisture uptake, mechanical properties, etc.
is possible. However, this method needs a process to evaporate the solvent, which will
cause various problems, like shrinking, internal stress, cracking etc. These are especially
troublesome for the ultra thin films that are required by current industrial developments.
The fundamental principles of CVD involve a wide variety of scientific and technical
principles including gas phase reaction chemistry, thermodynamics, heat and material
transfer, fluid mechanics, surface and plasma reactions, thin film growth mechanism, etc.
Complex as it is, CVD offers some distinctive advantages such as [1-5]:
a) The capability of producing highly dense and pure materials
b) The fabrication of uniform films with good reproducibility and adhesion at
reasonably high deposition rates.
c) The ability to uniformly coat complex shaped components and deposit films with
good conformal coverage.
d) The ability to control crystal structure, surface morphology and orientation of the
products by controlling the CVD process parameters.
9
e) The ease of control deposition rate. (Low deposition rate is favored for the growth
of epitaxial thin films for microelectronic applications. However, for the
deposition of thick protective coatings, a high deposition rate is preferred and it
can be greater than tens of μm per hour.)
f) The flexibility of using a wide range of chemical precursors, such as halides,
hydrides, organometallics which enable the deposition of a large spectrum of
materials including metal, carbides, nitrides, oxides, sulphides, etc.
g) Relative low deposition temperatures and the ability to deposit desired phases in-
situ at low energies through vapor phase reactions, nucleation and growth on the
substrate surface.
h) Reasonable processing cost.
Before the CVD process, the substrate surface can be plasma treated to enhance the
surface reactivity during deposition to achieve a denser film and better interfacial
adhesion. Due to the industrial trend in scaling-down, CVD, especially Plasma-enhanced
Chemical Vapor Deposition (PECVD), is becoming more popular, and many works have
been reported with the CVD and PECVD techniques [1-5]. A main challenge that still
remains for CVD is the control of the chemical structures of the deposited materials.
CVD and PECVD methods are expected to dominate for near future applications [1-5].
1.2.4 SiLK
In 2000, Dow Chemical company announced the successful integration of a new kind
of low-k polymer, SiLK, with promising properties [1-6]. It was reported that the polymer
molecular weight and solution concentration of SiLK can be tuned to enable precise and
convenient deposition via CVD as well as spin-coating. After deposition, the polymer is
thermally cured into an insoluble film that has a high glass transition temperature, good
10
mechanical properties at processing temperatures, and is resistant to process chemicals.
Table-1-1 listed some properties of SiLK.
Table-1-1. Some properties of SiLK [1-6].
Dielectric
constant
Thermal
stability
Glass
transition
temperature
Young’s
modulus
Ultimate
strength
Thermal
expansion
Hardness Toughness
2.65 >425
o
C >490
o
C
2.45
GPa
90 MPa
66
ppm/
o
C
0.38 GPa
0.62
m
1/2
MPa
The approach that was commercially implemented for the synthesis of SiLK dielectric
involves the reaction of polyfunctional cyclopentadienone- and acetylene-containing
materials. A standard process for SiLK resin requires baking at 320
o
C for 90 seconds on a
hot plate in nitrogen immediately following the deposition. Final curing is performed at
temperatures in the range of 400
o
C for 30 min to 470
o
C for 1 min, depending on the
user’s requirement, in a sufficiently anaerobic hot plate, oven, or furnace.
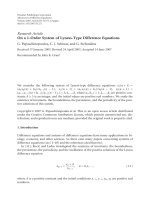
Fig-1-4. Stress-strain curve of SiLK [1-6].
Some mechanical properties of SiLK were studied in detail. Fig-1-4 and 5 show the
stress characteristics as a function of strain and temperature. In Fig-1-5, the heating curve
and cooling curve overlaps each other. This demonstrates that the SiLK still remains
stable when annealed to over 400
o
C.
11
Fig-1-5. Yield stress-temperature curve of SiLK [1-6].
Toughness was also studied with comparison to other dielectric materials as shown in
Fig-1-6. The SiLK has a higher toughness than the silicate-based films with similarly low
dielectric constants.
Fig-1-6. Predicted (solid line) and measured (markers) fracture toughness of silica-based
materials versus dielectric constant in comparison with SiLK [1-6].
Martin [1-6] reported that after fabrication, the interconnect composed of Cu and
SiLK dielectric shows a 37% improvement in resistance-capacitance delay over a
comparable aluminum and silicon dioxide interconnect at 0.13 μm technology node.
The thermal stability was studied by Maisonabe et al. who reported that SiLK is able