Decomposition analysis of industry sector CO2 emissions from fossil fuel combustion in kazakhstan
Bạn đang xem bản rút gọn của tài liệu. Xem và tải ngay bản đầy đủ của tài liệu tại đây (1.08 MB, 10 trang )
INTERNATIONAL JOURNAL OF
ENERGY AND ENVIRONMENT
Volume 6, Issue 1, 2015 pp.37-46
Journal homepage: www.IJEE.IEEFoundation.org
ISSN 2076-2895 (Print), ISSN 2076-2909 (Online) ©2015 International Energy & Environment Foundation. All rights reserved.
Decomposition analysis of industry sector CO
2
emissions
from fossil fuel combustion in Kazakhstan
Almaz Akhmetov
1,2
1
ENCA Management Ltd., 7 Pobedy Str., Esik, 040400, Kazakhstan.
2
Orizon Consulting, 6481 Elm Str., Suite 161, McLean, VA, USA.
Abstract
The changes in industrial structure of Kazakhstan resulted in significant transformation on its CO
2
emissions profile. Understanding the driving factors in CO
2
emissions profile is essential given the
emissions reduction targets committed by Kazakhstan. The study applies Index Decomposition Analysis
to identify factors affecting industrial CO
2
emissions caused by fossil fuel combustion for the period
1990-2011. The results of the analysis indicated that the main factor affecting increase in total industrial
emissions was the change in the industrial activity, while improvements in energy intensity helped to
reduce the emissions. Analysis of six subsectors was used to define the main reasons underlying changes
in CO
2
emissions.
The study underlines policy contradictions between national plans on expansion of carbon intense
commodity based industries and Kazakhstan’s international commitments on CO
2
reduction.
Furthermore, the changes in structure of industrial output towards overreliance on commodity based
industries and decline of manufacturing could indicate that Kazakhstan is vulnerable to resource curse.
Copyright © 2015 International Energy and Environment Foundation - All rights reserved.
Keywords: Kazakhstan; Index decomposition analysis; Industry; Decomposition; Fossil fuel.
1. Introduction
The Republic of Kazakhstan is a landlocked country located in the center of the Eurasian continent.
Kazakhstan is the ninth largest in the world and it represents around 0.2% of the world’s population,
0.3% of the world’s GDP and 0.7% of world total CO
2
emissions [1]. The breakup of the USSR in 1991
has resulted in a sharp contraction of the economy. That led the Government of Kazakhstan to undertake
reforms to establish a market economy, improve economic freedom and extensively develop its oil
sector. As a result since 2000 the economy of Kazakhstan has been steadily growing mainly due to
increased prices of oil on the world market. The economy of Kazakhstan is among the most energy and
carbon intense in the world.
Kazakhstan’s industry is primarily based on the extraction and export of the natural resources, primarily
crude oil that country possesses in enormous amounts. Share of industrial output in GDP has increased
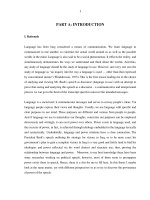
from 20.5% in 1990 till 31.6% in 2011 [2]. The industry of Kazakhstan has undergone a significant
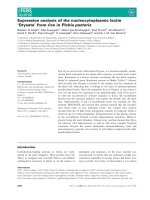
structural transformation since the Soviet period as seen in Figure 1. Kazakhstan has transformed from
diverse economy with a dominant share of processing industries into mostly oil export-dependent
economy. Hence, the economy of Kazakhstan could be vulnerable to oil price volatility.
International Journal of Energy and Environment (IJEE), Volume 6, Issue 1, 2015, pp.37-46
ISSN 2076-2895 (Print), ISSN 2076-2909 (Online) ©2015 International Energy & Environment Foundation. All rights reserved.
38
Figure 1. Structure of industrial output in Kazakhstan
1.1 Power industry
Power production in Kazakhstan mainly relies on thermal power plant. About 80% of all heat and
electricity is produced by coal combustion. Traditionally, most of electricity generation comes from coal-
fired power plants mainly built in the Soviet time. Due to harsh climatic conditions in winter, a
significant amount of energy is utilized for district heating purposes. The heat is provided by
cogeneration plants and boiler stations. Existing power plants and distribution infrastructure are often
highly deteriorated and ineffective, what results in significant energy losses. The power generation sector
is responsible for a majority of CO
2
emissions from industrial production and it is the most energy
intense among the sectors.
1.2 Iron and steel industry
Although productions of steel and pig iron have decreased by 1.8 and 1.7 times respectively since 1990,
the industry remains one of the most developed in the country. The industrial output has been on rise
since 2000 following the decline caused by demand disruption after the collapse of the USSR in 1990s.
The peak of industrial production was in 1992, and the output has not reached that value yet.
Historically, coal has been the fuel of choice for the industry due to its abundance and cheap mining and
transportation costs as the iron and steel production plants are located near the major coal mines.
1.3 Non-ferrous metals industry
Copper, lead and zinc has long been produced in the country. However, more recently production of
aluminum, titanium, magnesium and other metals have become the focus. The industrial output has
already surpassed 1990 level and the further growth is expected. The industry has increased its coal
consumption by almost eight times since 1990. The metals are mainly exported.
1.4 Chemical industry
The chemical industry is based on the utilization of phosphate and various salt reserves and
petrochemical industry. The industrial output has reduced 3.6 times since 1990 and the share of the
industry in the total industrial output has shrunk from 4% till just 0.1% for the same period. However, the
industry has been on the recovery path with the average annual growth of 5% since 1998, when the size
of the industry has shrunk almost six times.
1.5 Coal, oil and gas industry
The industry is significantly important for the economy of Kazakhstan due to large reserves of
hydrocarbons. The reserve-to-production (R/P) ratios of oil, natural gas and coal are 46, 82.5 and 293
years respectively [3]. Kazakhstan has strategic plans to increase production of coal, oil and gas. While
oil and gas present a valuable export commodity, domestic consumption of coal is expected to increase
International Journal of Energy and Environment (IJEE), Volume 6, Issue 1, 2015, pp.37-46
ISSN 2076-2895 (Print), ISSN 2076-2909 (Online) ©2015 International Energy & Environment Foundation. All rights reserved.
39
by 12% by 2020 [4]. The share of coal, oil and gas industries in total industrial output has increased from
just fewer than 10% in 1990 till almost 60% in 2011, while the shares of all other industries have reduced
almost twice for the same period. This may indicate that the economy of Kazakhstan maybe vulnerable
to the oil curse [5]. This study includes CO
2
emissions related to production and refining activities and
does not include emissions caused by flaring associated petroleum gas.
1.6 Other industries
The industries included are machinery, food processing, pulp and paper industry, light industry and other
non-specified industries. In other words, mostly processing and manufacturing industries. The share of
the industries in the total national industrial output has dropped from 64% in 1990 till 19% in 2011.
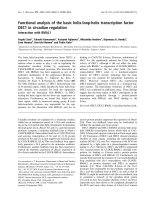
Due to heavy dependence on cheap domestic coal, the environmental impact of the industry is significant
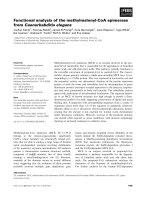
in Kazakhstan. The industry causes almost 60% of the total national CO
2
emissions [6]. The power
industry has had the biggest contribution to CO
2
emissions due to industrial activities as seen in Figure 2.
Total CO
2
emissions caused by coal, oil and gas industry, non-ferrous metals industry and other
industries increased comparing to 1990 level, while CO
2
emissions from iron and steel and chemical
industries have reduced. The main driving factor for CO
2
emissions increase is rise in coal consumption.
Figure 2. The total amount of CO
2
emissions related to fossil fuel combustion in six different industries
Kazakhstan is the non-Annex I party to the United Nations Framework Convention on Climate Change
(UNFCCC). Quantified Emission Limitation or Reduction Objectives (QELROs) committed by
Kazakhstan is 95% of 1990 base level by 2020 in Annex B of the Kyoto Protocol for the second
commitment period [7]. The Government has developed the Concept of transition to green economy,
where it has set the targets to reduce by 50% from the 2008 level, cut CO
2
emissions caused by
electricity production by 40% and increase the share of renewable energy in electricity production by
50% by 2050 [8]. On top of that, the national Emission Trading Scheme with cap and trade approach has
been launched. Hence, it is important to determine the factors affecting the growth of industry sector CO
2
emissions related to fossil fuel combustion.
In 2005, Karakaya and Ozcag [9] used decomposition analysis to define the driving forces of CO
2
emissions in Central Asia from fossil fuel combustion. The study distinguished between total primary
energy supply and total final energy consumption. The factors investigated were: emission factor, energy
intensity, fossil fuel intensity, conversion efficiency, economic output per capita and population for the
period 1992-2001. The study revealed that the main driving force for CO2 emissions reduction in
Kazakhstan due to reduction of economic activities following the collapse of the Soviet Union. Kojima
and Bacon (2009) performed a multi-country decomposition analysis of CO
2
emissions from energy use
for several time periods from 1994 till 2006 [10]. The methodologies used are five-factor decomposition
(carbon intensity, fossil fuel share, energy intensity, GDP per capita and population effect) and six-factor
International Journal of Energy and Environment (IJEE), Volume 6, Issue 1, 2015, pp.37-46
ISSN 2076-2895 (Print), ISSN 2076-2909 (Online) ©2015 International Energy & Environment Foundation. All rights reserved.
40
decomposition that used methodology similar to Karakaya and Ozcag (2005) study. The study indicated
that primarily economic activity was the main driving force for CO
2
emissions change in Kazakhstan.
2. Methodology
Index Decomposition Analysis (IDA) has been identified as the preferred methodology in energy and
environmental studies to investigate the factors influencing energy consumption and its environmental
impact [11]. Among the existing IDA methodologies the Logarithmic Mean Divisia Index (LMDI)
method has become popular due to its theoretical robustness, adaptability, and ability to provide perfect
decomposition [12].
This study aims to conduct a year-to-year decomposition analysis of the factors affecting industrial CO
2
emissions from 1990 to 2011 in Kazakhstan. The existing studies suggest decomposition of CO
2
emissions into five explanatory effects as follows [11-13]:
C =
C
ij
=
Q
Q
i
Q
E
i
Q
i
E
ij
E
i
C
ij
E
ij
=
QS
i
I
i
M
ij
U
iji,ji,ji,j
(1)
where C is the total CO
2
emissions (kt), Cij are CO
2
emissions caused by consumption of fuel j by i
industry, Q is total industrial output (billion Kazakhstani Tenge (bln KZT)), Q
i
is the output of i industry
(bln KZT), E
i
is the use of fossil fuel by i industry (PJ), E
ij
is the fossil fuel consumption of j type by i
industry (PJ), S
i
is the share of i industry in total industrial output, I
i
is the energy intensity of i industry,
M
ij
is the energy mix of i industry, U
ij
is the CO
2
emission factor of j fuel consumed by i industry.
Total changes in CO
2
emissions between target year T and base year (1990) could be expressed as
follows:
C
tot
= C
T
C
1990
= C
act
+ C
str
+ C
int
+ C
mix
+ C
emf
(2)
where ∆C
act
is the changed in CO
2
emissions caused by changes in activity, ∆C
str
is the changes in CO2
emissions caused by industrial output structure, ∆C
int
is the changes in CO
2
emissions caused by energy
intensity, ∆C
mix
is the changes in CO
2
emissions caused by fuel mix, ∆C
str
is the changes in CO
2
emissions caused by emission factor. Where:
C
act
=
w
ijij
ln
Q
T
Q
1990
(3)
C
str
=
w
ijij
ln
S
i
T
S
i
1990
(4)
C
int
=
w
ijij
ln
I
i
T
I
i
1990
(5)
C
mix
=
w
ijij
ln
M
ij
T
M
ij
1990
(6)
C
emf
=
w
ijij
ln
U
ij
T
U
ij
1990
(7)
where w
ij
is the logarithmic mean of industrial CO
2
emissions in year T and base year (1990) and
expressed as follows:
w
ij
=
C
ij
T
C
ij
1990
ln C
ij
T
ln C
ij
1990
(8)
3. Data
The time interval under investigation ranged from 1990 till 2011 (Table 1). The industrial outputs in
current prices for each sector were obtained from the Agency of the Committee on Statistics of the
International Journal of Energy and Environment (IJEE), Volume 6, Issue 1, 2015, pp.37-46
ISSN 2076-2895 (Print), ISSN 2076-2909 (Online) ©2015 International Energy & Environment Foundation. All rights reserved.
41
Ministry of National Economy of the Republic of Kazakhstan [2], and adjusted to the constant prices of
FY2005 using price deflator the United Nations Statistics Division [14].
Data on fossil fuel consumption, CO
2
emissions and implied CO
2
emission factors were acquired from
Kazakhstan’s national GHG inventory submitted to United Nations Framework Convention on Climate
Change [6]. Biomass combustion and related CO
2
emissions are excluded from analysis as they are
carbon-neutral.
Table 1. Fuel mix by industries in Petajoule (PJ)
Industry
1990
2011
Oil
Coal
Gas
Other
Total
Oil
Coal
Gas
Other
Total
Power
190.4
871.6
193.7
2.5
1258.3
12.8
797.7
145.8
0.0
956.3
Iron and steel
27.2
59.5
14.5
0.0
101.1
13.2
51.2
10.6
0.0
75.0
Non-ferrous
metals
13.6
13.9
1.9
0.1
29.5
11.2
107.8
0.1
0.0
119.1
Chemical
2.0
1.9
23.9
2.7
30.6
0.0
0.5
11.9
0.0
12.4
Coal, oil and
gas
47.4
4.3
42.1
5.9
99.7
60.7
3.0
112.8
0.0
176.6
Other
25.1
36.1
22.3
0.2
83.7
9.5
70.8
34.3
0.0
114.6
Total
305.7
987.3
298.4
11.4
1602.9
107.5
1031.0
315.6
0.0
1454.0
4. Results and discussion
Table 2 represents the results of decomposition analysis of CO
2
emissions in Gg. The results indicate that
total CO
2
emissions from industrial activities in Kazakhstan have reduced by 15,455.1 Gg or 11% from
1990, while the total fossil fuel consumption have reduced by 9% for the same period. Coal and gas
combustion have increased by 4% and 6% respectively, while oil consumption have dropped by 65% for
the period 1990-2011. The activity effect indicates that CO
2
emissions would have grown by 24% if
other effects had stayed constant. Improved energy intensity was the main factor for total CO
2
emissions
reduction.
Table 2. Results of decomposition analysis 1990-2011 (Gg of CO2)
∆C
tot
∆C
act
∆C
str
∆C
int
∆C
mix
∆C
emf
Power industry
-24,175.5
24,665.7
-6.485.7
-43,451.1
2,269.1
-1,173.5
Iron and steel industry
-5,720.5
2,170.1
1,949.4
-6,541.9
274.8
-3,572.9
Non-ferrous metals industry
8,419.9
1,399.7
-902.6
6,802.6
1,126.8
-6.6
Chemical industry
-1,138.4
290.2
-1,666.3
401.0
-41.7
-121.5
Coal, oil and gas industry
4,319.3
2,153.0
15,238.5
-12,795.7
-38.1
-238.3
Other industries
2,840.2
1,992.1
-9,084.9
9,426.1
342.4
164.5
Total
-15,455.1
32,670.9
-951.8
-46,159.0
3,933.3
-4,948.5
The results of the analysis are presented in the form of indexed time-series charts. The results indicate
that coal, oil and gas industry, non-ferrous metals industry and other industries surpassed CO
2
emissions
level of 1990, while power industry, iron and steel industry and chemical industry are still below that
level.
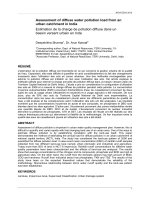
The total CO
2
emissions from the power industry have reduced by 23% since 1990. However, the
industry remains the biggest cause of CO
2
emissions in Kazakhstan. The main driving factor affecting
CO
2
emissions changes caused by power industry is the industrial activity of the sector as seen in Figure
3. Energy intensity had the biggest contribution to the emissions reduction. The share of oil consumption
in the fuel mix of the industry has dropped by 93% from 1990. Despite being the main cause of CO
2
emissions from total industry in Kazakhstan, the share of the power industry never exceeded 25% of the
total industrial output.
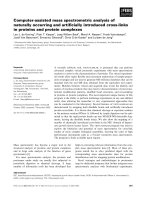
CO
2
emissions related to the iron and steel industry have reduced by 51% since 1990. The decline in CO
2
emissions in 1990s was caused by output contraction, while improvements in energy intensity and
emission factor due to fuel switching were the main causes of CO
2
emissions reduction in 2000s as in
International Journal of Energy and Environment (IJEE), Volume 6, Issue 1, 2015, pp.37-46
ISSN 2076-2895 (Print), ISSN 2076-2909 (Online) ©2015 International Energy & Environment Foundation. All rights reserved.
42
Figure 4. For the whole period from 1990 to 2000, the main factors affecting emissions increase were the
industrial activity and the output structure, while the energy intensity drove down the emissions by 58%.
Figure 3. Results of decomposition analysis for power industry
Figure 4. Results of decomposition analysis for iron and steel industry
The total CO2 emissions caused by the non-ferrous industry have increased by 347% for the whole
period. The main reason behind CO
2
emissions increase is the energy intensity rise by 3.7 times since
1990 as displayed in Figure 5. Furthermore, the share of coal has reached 90% from 47% in 1990. This
combination caused significant boost in CO
2
emissions caused by the industry.
International Journal of Energy and Environment (IJEE), Volume 6, Issue 1, 2015, pp.37-46
ISSN 2076-2895 (Print), ISSN 2076-2909 (Online) ©2015 International Energy & Environment Foundation. All rights reserved.
43
Figure 5. Results of decomposition analysis for non-ferrous metals industry
The total CO
2
emissions from chemical industry have declined by 62% since 1990. The main driving
factor behind the decrease was the industrial structure effects that caused over 90% decline as seen in
Figure 6. The industry is the only sector where gas is the dominant fuel in the mix and consisted 96% of
the total fuel mix in 2011.
Figure 6. Results of decomposition analysis for chemical industry
The industrial output of coal, oil and gas industry has been increasing at the average rate of 14% annually
since 1999 following the decline from 1992. Total CO
2
emissions caused by the industry have increased
by 67% for analysis period. The main factor affecting the dynamics of CO
2
emissions from coal, oil and
gas sector is the structure of industrial output in spite of improvements in energy intensity as seen in
Figure 7. The industrial structure effect caused 237% increase in CO
2
emissions, while energy intensity
factor pushed down emissions by almost 200% for the whole period. Furthermore, the results of the
study most likely indicate that the industrial output of the coal, oil and gas sector highly depends on oil
price fluctuations on the world market. This possibly explains energy intensity improvements of the
sector despite increased fossil fuel consumption by 77% since 1990.
International Journal of Energy and Environment (IJEE), Volume 6, Issue 1, 2015, pp.37-46
ISSN 2076-2895 (Print), ISSN 2076-2909 (Online) ©2015 International Energy & Environment Foundation. All rights reserved.
44
Figure 7. Results of decomposition analysis for coal, oil and gas industries
CO
2
emissions from the other sectors have increased by 45% since 1990. However, the emissions are
below 1992 level when the industrial output and consequent environmental impact were at the peak as
displayed in Figure 8. The biggest cause of CO2 emissions increase from the industry was energy
intensity factor, while structure effect was the main driving force for reduction. The industry has
increased coal consumption almost twice since 1990.
Figure 8. Results of decomposition analysis for other industries
5. Conclusion
From 1990 to 2011, CO
2
emissions related to fuel combustion by industry have increased by 11%. By
applying LMDI methodology it was identified that changes in industrial activity pushed up total CO
2
emissions from industry by 24% followed by fuel mix with 3% increase, while changes in emission
intensity, emission factor and structure of industrial output pushed down emissions by 34%, 4% and 1%
respectively. Analysis of industries revealed that the relative CO
2
emissions reduction was achieved in
chemical and iron and steel and power industries by 62%, 51% and 23% respectively since 1990.
International Journal of Energy and Environment (IJEE), Volume 6, Issue 1, 2015, pp.37-46
ISSN 2076-2895 (Print), ISSN 2076-2909 (Online) ©2015 International Energy & Environment Foundation. All rights reserved.
45
Meanwhile, CO
2
emissions caused by non-ferrous metals, coal, oil and gas and other industries have
increased by 347%, 67% and 45% respectively. Furthermore, it was identified that changes in industrial
activity was the main driving force in emissions increase in power and iron and steel industries; energy
intensity in non-ferrous metals, other and chemical industries; and the structure effect has significantly
pushed up CO
2
emissions in coal, oil and gas industry. The energy intensity was the main factor to push
down CO
2
emissions from coal, oil and gas, iron and steel and power industries, while changes in
industrial output structure pushed down emissions in non-ferrous metals, chemical and other industries.
Although, Kazakhstan has achieved 31% increase in total industrial output since 1990, the growth
occurred in power, iron and steel, non-ferrous metals and coal, oil and gas industries by 22%, 66%, 10%
and impressive 770% respectively. On the other hand, chemical and other industries have dropped in size
by 72% and 61% respectively. The transformation of industrial output towards over-reliance on natural
resources export, crude oil in particular, may indicate that Kazakhstan is vulnerable to the phenomenon
of the oil curse. The Government of Kazakhstan has been trying to diverse its industry from heavy
dependence on export of hydrocarbons by development of non-energy intensive industries, measures for
energy efficiency and energy saving improvement. However, a number of national industrial
diversification programs have not succeeded. This is most likely due to greater corruption that often hits
countries that undergo the oil curse [5].
Another important discovery from the analysis is the increase in coal consumption and reduction of oil
presence in the fuel mix of the industry. In other words, coal, a fuel with a bigger environmental impact
but cheaper cost, have become a main fuel for domestic industry, while oil and gas, major export
commodities, have been sold on the world market. The fuel switch raises the questions of environmental
justice and social equity in Kazakhstan.
A general policy conclusion on the basis of the study is that national strategy on increasing domestic coal
consumption [4] and development of energy- and carbon-intense commodity based industries [15]
contradicts Kazakhstan’s international commitments on CO
2
. This could create the incompatibility
between national plans on transition to green economy and economic development of the country.
References
[1] The World Bank Data, 2014. Kazakhstan. [online] Available at:<
country/kazakhstan> [Accessed 22 October 2014].
[2] Ministry of National Economy of the Republic of Kazakhstan Committee on Statistics, 2014.
Operational data. [online] Available at: < > [Accessed 22 October 2014].
[3] BP, 2014. BP statistical review of world energy June 2014. 63rd ed. [pdf]. London. Available at:
< [Accessed 22 October 2014].
[4] Concept of development of fuel-energy complex of the Republic of Kazakhstan until 2030. 2014
SI 724. [in Russian] Astana.
[5] Ross L. M. The oil curse: How petroleum wealth shapes the development of nations. Princeton
University Press, 2012.
[6] UNFCCC, 2014. National inventory submissions 2013. [online] Available at: <
national_reports/annex_i_ghg_inventories/national_inventories_submissions/items/7383.php>.
[7] Sergazina G., Khakimzhanova B. Kazakhstan: Status of ETS development and need for support.
Marrakech, Morocco, 23 October 2013. Marrakech: Partnership for market readiness.
[8] Conception of Kazakhstan on transition to green economy. 2013 SI 577. [in Russian] Astana.
[9] Karakaya E., Ozcag M. Driving forces in Central Asia: A decomposition analysis of air pollution
from fossil fuel combustion. Arid Ecosystems Journal 2005, 11(26-27), 49-57.
[10] Kojima M., Bacon R. Changes in CO2 emissions from energy use: A multicountry decomposition
analysis. The World Bank, 2009.
[11] Ang B.W., Zhang F.Q. A survey of index decomposition analysis in energy and environmental
studies. Energy, 2000, 25, 1149-1176.
[12] Ang B.W. Decomposition analysis for policymaking in energy: which is preferred method?
Energy Policy, 2004, 32, 1131-1139.
[13] Ang B.W., Xu X.Y. Tracking industrial energy efficiency trends using index decomposition
analysis. Energy Economics, 2013, 40, 1014-1021.
[14] The United Nations Statistics Division, 2014. National accounts main aggregates database.
Implicit price deflators in national currencies and US dollars. [online] Available at:
< [Accessed 22 October 2014].
International Journal of Energy and Environment (IJEE), Volume 6, Issue 1, 2015, pp.37-46
ISSN 2076-2895 (Print), ISSN 2076-2909 (Online) ©2015 International Energy & Environment Foundation. All rights reserved.
46
[15] Social-economic development forecast of the Republic of Kazakhstan 2014-2018. 2013 SI 33. [in
Russian] Astana: Ministry of Economy and Budget Planning of the Republic of Kazakhstan.
Almaz Akhmetov is a principal at ENCA Management, a consulting firm with specialized focus on
energy, environment and economics in Central Asia. Also, he is a technical advisor at Orizon
Consulting, a Virginia-based firm specializing in international trade and marketing. He holds a Master’s
degree in risk engineering from the University of Tsukuba, Japan. Mr. Akhmetov has over a decade of
experience in international energy projects. He has contributed a number of research articles and papers
to energy policy, environmental issues and energy economics in Central Asia. He is the author of the
book “Potential of wind power development in Kazakhstan. Resource potential and environmental
improving effect of wind energy technologies in Kazakhstan”.
E-mail address: