Transient absorption spectroscopy of noble metal nanoparticles
Bạn đang xem bản rút gọn của tài liệu. Xem và tải ngay bản đầy đủ của tài liệu tại đây (3.14 MB, 146 trang )
TRANSIENT ABSORPTION SPECTROSCOPY OF
NOBLE METAL NANOPARTICLES
YU KUAI
NATIONAL UNIVERSITY OF SINGAPORE
2013
TRANSIENT ABSORPTION SPECTROSCOPY OF
NOBLE METAL NANOPARTICLES
YU KUAI
A THESIS SUBMITTED FOR THE DEGREE OF
PHILOSOPHY IN SCIENCE
NUS GRADUATE SCHOOL FOR INTEGRATIVE
SCIENCES AND ENGINEERING
NATIONAL UNIVERSITY OF SINGAPORE
2013
i|Page
Declaration
I hereby declare that the thesis is my original work and it
has been written by me in its entirety. I have duly
acknowledged all the sources of information which have
been used in the thesis.
This thesis has also not been submitted for any degree in any
university previously.
YU KUAI
ii|Page
iii|Page
Acknowledgments
Although the cover on this thesis bears only my name, it would not have been possible to
complete this thesis without the help and support of all kind people around me, to only some
of whom it is possible to give particular mention here.
I would like to express my sincere gratitude to my supervisor, Prof. Qing-Hua Xu
(Department of Chemistry, NUS) for his support, encouragement and guidance through out
the course. He exposed me to a whole new world of research involving ultrafast optical
spectroscopy that subsequently became my research interests. I was given a lot of freedom to
fill in my project as I wished, for which I am grateful to him.
I would also like to express my warm and sincere thanks to my supervisor, Prof. Ming-
Hui Hong (Department of Electrical and Computer Engineering, NUS) for the opportunities I
have been given in the lab. I have learned a lot from his dedication and hard work. My
association with him has been a wonderful experience.
I am also very grateful to Prof. Michel Orrit (Department of Physics, Leiden University)
for having me in Leiden. I thank Michel for the stimulating scientific discussions and
continued support. I have great times in the lab of working together with a postdoctoral
researcher, Dr. Peter Zijlstra. I am grateful to him for never getting impatient with my
relentless questioning on the technical and fundamental aspects of research. For the rest of the
group, I am grateful for all the wonderful times we had.
I always appreciated the working atmosphere in different labs where hard work was
possible in a relaxed environment. It played an important role in ensuring that the four years
of research did not drive me crazy. For this, thank you to all fellow colleagues. I had
wonderful time in Singapore and the Netherlands with my friends and colleagues.
The NUS Graduate School for Integrative Sciences and Engineering (NGS) is a
wonderful program. The financial support provided by NGS is a very critical factor ensuring a
smooth completion of my candidature.
iv|Page
I would like to acknowledge the support from my family and friends. To my family,
mum, dad, and brother, for their encouragement during the past years, I always appreciate
your continuing support and allowing me to pursue my interests all the times. Finally, I would
like to thank Yingmei for her encouragement and friendship. To all my close friends, I am
indebted to all the support that you have provided all these while.
v|Page
Table of Contents
Declaration i
Acknowledgments iii
Table of Contents v
Summary ix
List of Tables xi
List of Figures xiii
List of Publications xix
1. Introduction of Optical Properties of Noble Metal Nanoparticles
1.1 Noble Metal Nanoparticles 2
1.2 Optical Properties 3
1.3 Excitation Dynamics 14
1.4 Detection Techniques 28
1.5 Thesis Outline 34
References 37
2. Electron Dynamics of Gold Nanorods
2.1 Introduction 43
2.2 Experimental Section 45
2.3 Intraband Excitation 47
vi|Page
2.4 Interband Excitation 51
2.5 Conclusion 58
References 59
3. Transient Absorption Spectroscopy of Single Gold Nanorods
3.1 Imaging of Single Gold Nanorods 64
3.2 Scattering Spectrum of Single Gold Nanorods 67
3.3 Transient Absorption Spectrum of Single Gold Nanorods 69
3.4 Cooling Dynamics in Single Gold Nanorods 71
3.5 Conclusion 73
References 74
4. Damping of Acoustic Vibrations of Single Gold Nanorods
4.1 Introduction 77
4.2 Experimental Setup 79
4.3 Acoustic Vibrations of Single Gold Nanorods in Air and Water 82
4.4 Theoretical Analysis of Vibrational Modes 87
4.5 Water Layer Thickness Dependent Acoustic Vibrations 90
4.6 Discussions of Acoustic Vibrations 96
4.7 Conclusion 97
References 99
5. Acoustic Vibrations of Single Gold Nanorods upon Ag Deposition
5.1 Introduction 105
vii|Page
5.2 Experimental Section 107
5.3 Estimation of the Silver Shell Thickness 109
5.4 Acoustic Vibrations of Au/Ag Core-Shell Nanorods 111
5.5 Monitoring the Atomic Layer of Silver Deposition 115
5.6 Conclusion 117
References 119
6. Conclusions and Perspectives
6.1 Thesis Conclusions 123
6.2 Perspectives 125
viii|Page
ix|Page
Summary
This dissertation is the result of four years of research carried out in ultrafast spectroscopy
and imaging group at National University of Singapore and in MoNOS group at Leiden
University on the study of nonlinear optical properties of metal nanoparticles. This thesis
entitled: “Transient absorption spectroscopy of noble metal nanoparticles” is my own work
and has not been submitted previously, in whole or in part, in respect of any other academic
award.
I started the project in 2009 with the beginning of familiar with the ultrafast pulsed
laser system. After the initial period of learning the experimental setup, I decided to use the
ultrafast two-colour pump-probe technique to study the metal nanoparticles. Our aim was that
we could be able to detect the electron dynamics of different plasmons in gold nanorods, for
example, the transverse and longitudinal plasmon resonances. The detailed results will be
discussed in chapter 2. The first experiment helped us to understand that the plasmon
dynamics are directly related to excitation energy distribution into the different plasmon
modes, which are excitation wavelength and fluence dependent.
Since then, we were getting more understanding of the transient absorption
spectroscopy of gold nanorods in solution. However, we realized that to fully understand the
experimental observations, we need to eliminate the inhomogeneous distributions and thus the
single-particle measurements are highly desirable.
Finally, I was allowed to collaborate with Prof. Michel Orrit, Dr. Peter Zijlstra at
Leiden University in The Netherlands. They have expertise in studying single particles by
using pump-probe spectroscopy. This allowed us to remove the ensemble averaging by
studying a single nanorod. Combining with the white-light scattering spectra from single gold
nanorods, we can correlate the linear spectroscopy with the nonlinear spectroscopy well
accurately. The detailed transient absorption spectra of gold nanorods near its longitudinal
plasmon resonance will be discussed in chapter 3. We found an electron phonon coupling
constant in single gold nanorods which is in good agreement with the ensemble measurements
x|Page
in solution. The experimental transient absorption spectrum of a gold nanorod is well
reproduced by theoretical calculations.
We also measured the acoustic vibrations of a single gold nanorod. As we will explain
it in chapter 4, these acoustic vibrations of gold nanorods contain important information about
the environment, which gives us a way to use the gold nanorods as probes to detect the
microenvironment at high frequency from 1 GHz to 1000 GHz. Finally, we also studied the
changes of the vibrational frequencies by coating silver layer on single gold nanorods. The
high frequency acoustic vibrations allow us to detect one layer of silver atoms deposited on
gold nanorods. The sensitive response of breathing mode provides a novel tool to characterize
the small amount mass deposition on gold nanorods. This will be discussed in chapter 5.
The physics of metal nanoparticles is addressed in chapter 1 of this thesis. We will give
an overview of the optical properties of metal nanospheres, nanorods, bimetallic core-shell
nanorods by using Mie’s theory and Gans’ approximation. We will also describe the
nonlinear optical responses of a metal nanoparticle upon the excitation by short laser pulses.
Combining the Rosei model and Two-temperature model, we will describe a theoretical
understanding of the nonlinear optical spectroscopy and electronic dynamics of metal
nanoparticles. With the theoretical and experimental studies, we hope you will understand the
transient absorption spectroscopy of noble metal nanoparticles after reading this thesis.
xi|Page
List of Tables
Table 1.1: Vibration periods and damping times for Au nanospheres with a radius of 40 nm,
embedded in several matrices. The density of longitudinal and transversal sound velocities of
gold are
ρ
= 19,700 kg/m3,
L
υ
= 3240 m/s and
T
υ
= 1200 m/s. The quality factor is defined
as
00
2/2Q
π
υτ
=
.
Table 3.1: Calculated upper bounds for the lattice temperature increase after the absorption of
pump and probe pulses for 25 nm × 54 nm nanorod in air and water. Note that the probe
wavelength that calculated here is the plasmon peak which corresponding to the highest
temperature increase during the measurements.
Table 4.1: Calculated upper bounds for the lattice temperature increase after the simultaneous
absorption of pump and probe pulses for 25 nm × 54 nm nanorod in air and water. Note that
the probe wavelength is taken on the plasmon peak.
xii|Page
xiii|Page
List of Figures
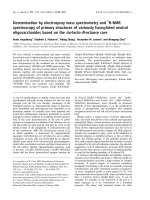
Figure 1.1: Transmission electron microscope images of (a) gold nanospheres, (b) gold
nanorods, (c) Au/Ag core-shell nanorods, and (d) scanning electron microscope image of
silver nanowires.
Figure 2.2: (a) Real and (b) imaginary parts of the dielectric functions of bulk silver and gold
(data measured by Johnson and Christy).
Figure 1.3: Calculated extinction cross sections of gold sphere. (a) Calculated extinction
cross sections of gold spheres of various radii, embedded in water with
m
ε
= 1.33. (b)
Illustration of the dependent of SPR on the surrounding refractive index with R = 5 nm.
Figure 1.4: Calculated extinction cross sections of gold spheroid versus aspect ratios. (a)
Extinction cross sections of gold spheroid with an increasing aspect ratio. The semi-minor
axis length is 5 nm for all the calculated particles. The spheroids are embedded in water with
1.33
m
ε
=
, calculated using equation 1.18. (b) Aspect ratio dependence of the longitudinal
SPR wavelength for spheroids. The parameters in the calculation are as in (a).
Figure 1.5: Sketch of a core-shell spheroid. A core of a gold spheroid with dielectric function
1
ε
is surrounded by a silver shell of thickness d and dielectric function
2
ε
. The particle is
embedded in a medium
m
ε
.
Figure 1.6: Calculated extinction cross sections of Au/Ag core-shell spheroids versus Ag
shell thickness. (a) Extinction cross sections of a gold spheroid with an increasing of the Ag
shell thickness. The semi-minor axis and semi-major axis length of Au core spheroid is 5 and
30 nm respectively. The core-shell spheroids are embedded in water with
1.33
m
ε
=
,
calculated using equation 1.20. (b) Shell thickness dependence of the longitudinal SPR
wavelength for spheroids. The parameters in the calculation are as in (a).
Figure 1.7: Schematic processes of excitation and relaxation dynamics of metal nanoparticles.
The pump pulse firstly excites the electrons and creates the non-thermal electrons (< 0.1 ps).
Via the electron-electron scattering, the electrons heat up and follow the quasiparticles
thermal distribution (~ 0.1-0.5 ps). Then they transfer their kinetic energy to the lattice
through the electron-phonon scattering (~ 1-5 ps). The particle heats up and transfers its
thermal energy to the environment (~ 100 ps). At the same time, acoustic vibrations can be
launched in the nanoparticle by the sudden thermal expansion of the electron cloud and the
lattice. The vibration period is around tens of picoseconds.
Figure 1.8: Schematic of the mechanisms affecting the dielectric functions of noble metals
when the electron temperature increases after laser excitation.
xiv|Page
Figure 1.9: Band structure near L point for (a) Au and (b) Ag. The structures are used as in
Rosei model.
Figure 1.10: Theoretical interband contribution to real
ε
′
Δ
and imaginary
ε
′′
Δ
of Au and Ag
calculated at electron temperature increase of 1 K. (a)
ε
′
′
Δ
of Au, contribution from d band to
p band near L point. (b)
ε
′
Δ of Au, calculated from
ε
′
′
Δ
by using Kramers-Kronig relations
(c)
ε
′′
Δ
of Ag, blue dot line, contribution from p band to s band transition, green dash dot line,
contribution from d band to p band transition, solid line, total contribution from those two
transitions. (d)
ε
′
Δ
of Ag, calculated from
ε
′
′
Δ
by using Kramers-Kronig relations (eq. 1.27).
Figure 1.11: Transient absorption spectra for Au (a) and Ag (b) nanospheres calculated at
different electron temperatures as shown in the figures. The lattice temperature is setting at
300 K. The particle size is 15 nm for both Au and Ag and they are dispersed in water with
n=1.33.
Figure 1.12: Transient absorption spectra for Au (a) and Ag (b) nanorods calculated at
different electron temperatures as shown in the figures. The lattice temperature is setting at
300 K. The particle size of Au nanorod is 10 × 30 nm, and Ag nanorod is 10 × 40 nm and
they are dispersed in water with n=1.33.
Figure 1.13: Temporal evolution of electron and lattice temperature in gold for an initial
electron temperature of 3000 K by two-temperature model.
Figure 1.14: Calculated time dependence of
σ
Δ
in Au nanorods for probing at longitudinal
plasmon resonance, (a) the picosecond time scale decay curves with different initial electron
temperature. (b) The normalized amplitude of the
σ
Δ
at zero delay time in different initial
electron temperature.
Figure 1.15: (a) Absorption cross section of Au nanorods (10 × 30 nm) changes with the
effect of volume expansion. The black curve is the absorption spectrum of Au nanorods
without volume expansion. The red curve is the absorption spectrum of Au nanorods with 1%
length elongation and diameter decrease while maintaining the volume same, which is
corresponding to the longitudinal acoustic vibration of Au nanorods. The blue curve is the
absorption spectrum of Au nanorods with 1% diameter increase while keeping the length
unchanged, which is actually related to the breathing vibration of Au nanorods. The inset is an
enlarged part of the spectra to see the SPR change clearly. The Au nanorods are dispersed in
water with n=1.33. (b) Absorption cross section changes
/
σ
σ
Δ
around the SPR of Au
nanorods.
Figure 1.16: Pump probe spectroscopy used for ensemble measurements. The solution
sample is put inside the cuvette.
Figure 1.17: Typical optical setup used for single particle detection, combining the optical
scattering measurements and pump-probe spectroscopy on single particle. The metal
nanoparticles are immobilized on a substrate. The white-light beam, and the pump- and
probe-pulses are focused by a high-numerical-aperture objective on the sample surface. LIA:
xv|Page
lock-in amplifier, AOM: acousto-optical modulator, λ/2: half-wave plate, FM: flip mirror, PD:
Si-PIN diode, APD: single-photon-counting avalanche photo-diode.
Figure 2.1: (a) TEM image and (b) extinction spectrum of the gold nanorod solution. (c)
Histogram of the aspect ratio distribution and the corresponding Gaussian fit of the studied
Au nanorods.
Figure 2.2: (a) Excitation fluence dependent transient absorption spectra of gold nanorods at
a delay time of 1 ps under excitation at 800 nm; (b) Scaled transient absorption spectra
(normalized the longitudinal bleaching amplitude to 1) under representative low (29.0 μJ/cm
2
)
and high (89.2 μJ/cm
2
) excitation fluences; (c) Excitation fluence dependent amplitude of
longitudinal mode and transverse mode.
Figure 2.3: (a) Excitation fluence dependent bleaching dynamics of the longitudinal band at
705 nm under excitation at 800 nm. (b) The excitation fluence dependent electron-phonon
coupling relaxation time constant at 705 nm.
Figure 2.4: (a) Excitation fluence dependent transient absorption spectra of the gold nanorods
solution under excitation at 400 nm at a delay time of 1 ps; (b) Scaled transient absorption
spectra (normalized the longitudinal bleaching amplitude to 1) under representative low (7.8
μJ/cm
2
) and high (138.9 μJ/cm
2
) excitation fluences; (c) Excitation fluence dependent
bleaching amplitudes at 705 nm (corresponding to longitudinal mode) and 525 nm
(corresponding to the transverse mode).
Figure 2.5: Excitation fluence dependent decay profiles of (a) longitudinal mode (at 705 nm)
and (b) transverse mode (at 525 nm) under excitation at 400 nm. The solid lines are the fitting
results. (c) The bleaching relaxation times of transverse and longitudinal bands as a function
of excitation fluence.
Figure 3.1: Scanning electron micrograph of the gold nanorods dropcast on a silicon substrate.
From such images, we extract an ensemble average size of 25 ± 3 nm in width and 54 ± 3nm
in length.
Figure 3.2: Raster scanned images of 25 nm × 54 nm nanorods in water. (a) White-light
scattering scan of a 20 × 20 um area. A band pass filter 650 ± 50 nm was used before APD
detector to increase the visibility of the nanorods in water. (b) Pump-probe raster scan of the
sample (same area as in (a)). The time delay between the pump and probe pulses was set to
t=0, so as to detect the amplitude of the electronic response. The pump power is 3pJ. The
probe wavelength is 650 nm. The probe power is 0.2 pJ. The circles are the guidance for the
help to find the same nanorod.
Figure 3.3: White-light spectrum of a single gold nanorod in water. The spectrum is fitted
with Lorentz function. The band width of the spectrum is 90 meV.
xvi|Page
Figure 3.4: Pump-probe spectroscopy of a single gold nanorod. (a) Probe wavelength
dependence of the amplitude of the electronic response. The scattering spectrum of the
nanorod is shown in Figure 3.3. The surface plasmon resonance is indicated by the vertical
line and is located at 646 nm. (b) Probe polarization dependence of the electronic response,
the solid line is the fitting with cosine function.
Figure 3.5: (a) Calculated absorption cross section of a 25 nm × 54 nm nanorod deposited on
glass substrate and immersed in water. To match the plasmon peak of gold nanorod that
measured in water as shown in Figure 3.3, the refractive index used here is n=1.5 in water.
The polarization of the light is parallel to the gold nanorod. (b) The calculated absorption
cross section changes
/( , 0)
pr
AA
λ
τ
−Δ = around the SPR of the gold nanorod. The gray
vertical line indicates the plasmon wavelength.
Figure 3.6: (a) Pump pulse energy dependent of the transient bleaching decay curve. The
inset is the electron-phonon decay part to indicate the electron-phonon decay time as a
function of the pump pulse energy. The decay time was obtained by fitting the curves with a
single exponential in 0-10 ps. (b) The calculated plasmon bleaching curve by using two-
temperature model at different initial electron temperature
e
T
.
Figure 4.1: (a) Scanning electron micrograph of the gold nanorods dropcast on a silicon
substrate. These gold nanorods have an ensemble average size of 25 ± 3 nm in width and 54 ±
3 nm in length. (b) Example of a normalized white-light spectrum of a single gold nanorod in
air and of the same particle in water.
Figure 4.2: Calculated absorption cross section of a 25 nm × 54 nm prolate spheroid
immersed in air and water. To account for the presence of the substrate we used an effective
medium refractive index, which was chosen such that the calculated plasmon wavelength
matches the measured values shown in Figure 4.1b, (n=1.3 for the particle in air, and n=1.5
for the particle in water).
Figure 4.3: Acoustic vibrations of a single gold nanorod. (a) Vibrational traces of the same
gold nanorod in air and water, displaying a sum of breathing and extension mode vibrations.
The red lines are fits to the experimental data using eq 4.1. (inset) Zoom of trace for short
times. Fit parameters (errors are fitting errors):
15.43 0.02
air
ext
ν
=± GHz with a damping time
of
370 20
air
ext
τ
=±
ps,
94.34 0.01
air
br
ν
=±
GHz with a damping time of
93 5
air
br
τ
=±
ps,
16.16 0.08
water
ext
ν
=± GHz with a damping time of 111 6
water
ext
τ
=
± ps, and
95.24 0.01
water
br
v =± GHz with a damping time of 73 3
water
br
τ
=
± ps. (b) Power spectral
density of the oscillatory part of the traces in (a).
Figure 4.4: Scatter plot of the quality factor
2/2
kkk
Qv
π
τ
=
for the same gold nanorods in
air and water, for (a) the breathing mode and (b) the extension mode. Error bars are the fit
inaccuracies. The dash-dotted line corresponds to
water air
QQ=
.
xvii|Page
Figure 4.5: Calculated longitudinal surface plasmon resonance shift of a 25 nm × 54 nm core-
shell spheroid in air for different water shell thickness. The dielectric function of bulk gold is
used as reported by Johnson and Christie. The green line is guide to the eye.
Figure 4.6: Quality factors of (a) the breathing mode and (b) the extensional mode as a
function of the plasmon wavelength shift for a single gold nanorod. The blue-shift of the
plasmon resonance was induced by slowly evaporating a thin of water by a nitrogen flow.
ΔSPR = 0 corresponds to the rod in air.
Figure 4.7: Acoustic vibrations of a single gold nanorod in different water environments as
indicated by the longitudinal plasmon resonance shift. The particle is fully immersed in water
for the top trace (
ΔSPR 47= nm) and the water was gradually evaporated until no further
blue-shift was observed (bottom trace,
ΔSPR 0
=
nm). The red lines are fits using eq 4.1 in
the main text.
Figure 4.8: Vibration frequency and damping time of gold nanorods after repeated changes of
the local environment. (a) Vibration frequencies, (b) damping times of the breathing mode, (c)
vibration frequencies and (d) damping times of the extension mode of five different gold
nanorods as indicated by different colors.
Figure 5.1: (a) Scanning electron micrograph of the gold nanorods dropcast on a silicon
substrate. From such images, we extract an ensemble average size of 54 ± 3 nm in length and
25 ± 3 nm in width. (b) Scheme of the experimental setup described in the main text. The
dash-dot box indicates how the pump- and probe-beam are focused on a single nanorod (not
to scale). The white-light beam and the pump- and probe-pulses are focused by a high-
numerical-aperture objective (NA = 0.9) on the sample surface. The transmitted probe pulses
are collected by a lower-numerical-aperture objective (NA = 0.75) and are directed to the
appropriate detector. RS: aqueous reaction solution (4 mL 20 mM ascorbic acid, 1 mL 2 mM
sodium citrate, 0.2 mL 2 mM silver nitrate), AA: ascorbic acid (100 mM aqueous solution).
LS: light sources including white-light, pump- and probe-pulses.
Figure 5.2: (a) Examples of normalized white-light spectra of a single gold nanorod during
the coating with a silver shell. The plasmon resonance blue-shifts with increasing thickness of
the silver shell, as indicated by the arrow. (b) Calculated extinction spectra of a gold spheroid
(23 nm × 62 nm) confocally coated with different silver shells and immersed in water
(refractive index n = 1.33). The particle dimensions and the shell thickness were fitted to
match the calculated plasmon wavelength with the measured white-light spectra. (c) Silver-
coating-induced plasmon wavelength shift (photon energy) and the damping quality factor
(Q-factor) of a few gold nanorods as indicated by different colors.
Figure 5.3: (a) The calculated longitudinal plasmon peak (
max
λ
) versus aspect ratio (AR) for a
Au nanorod using two different models, an ellipsoid and a spherical capped cylinder. The
surrounding environmental refractive index is considered as pure water (n=1.33) or pure glass
(n=1.5). A dash line indicates the approximated AR uncertainty for a gold nanorod
max
λ
= 660
nm. The approximated aspect ratio of the gold nanorod
max
λ
= 660 nm varied from 2.0 to 2.7.
(b) The plasmon resonance shifts of gold nanorods upon silver shell deposition.
xviii|Page
Figure 5.4: (a) Acoustic vibrations of a single gold nanorod coated with silver shell with
thickness varying from 0 nm (bottom) to 4.3 nm (upper), corresponding white-light spectra
are shown in Figure 5.2a. All the curves display both the breathing mode and the extensional
mode. The red lines are fits to the experimental data using eq 1. (b) Power spectral density of
the oscillatory part of the traces in (a). The extensional mode at low frequency hardly changes
with increasing silver thickness up to 4 nm, while the frequency of the breathing mode
decreases as indicated by the arrow.
Figure 5.5: Vibrational frequencies and damping times of gold nanorods coated with various
amount of silver shell. Experimental data of the vibrational frequencies of extensional mode
(a) and breathing mode (b) of gold nanorods upon a gradual increase of the silver shell
thickness up to 5 nm. Quality factors of the extensional mode (c) and the breathing mode (d)
of gold nanorods coated with various amount of silver shell.
Figure 5.6: Calculated vibrational frequencies of the breathing mode (a) and the extensional
mode (b) of gold nanorods with size 25 nm × 54 nm versus the uniformly coating of a silver
shell.
Figure 5.7: The vibrational frequencies of the extensional mode and the breathing mode of a
single gold nanorod in repeated measurements (a) and of another single gold nanorod in
recycling measurements (b).
Figure 5.8: Measured vibrational frequencies of the extensional mode (a) and the breathing
mode (b) of particles with different silver shell thicknesses up to 1 nm (thickness estimated
from shifts in the white-light spectra).
xix|Page
List of Publications
1. Kuai Yu, Peter Zijlstra*, Aquiles Carattino, Minghui Hong, Qing-Hua Xu and
Michel Orrit, Probing Silver Deposition on Single Gold Nanorods by Their Acoustic
Vibrations, 2013, in Preparation
2. Kuai Yu, Peter Zijlstra*, John E. Sader, Qing-Hua Xu* and Michel Orrit, Damping
of Acoustic Vibrations of Immobilized Single Gold Nanorods in Different
Environments, 2013, Nano Lett. dx.doi.org/10.1021/nl400876w.
3. Kuai Yu
#
, Tingting Zhao
#
, Qing-Hua Xu* and Guo-Qin Xu*, etc., Gold Nanorod
Enhanced Two-Photon Emission of Fluorescence Molecule, 2013, submitted to Small
(
#
equally contributed)
4. Peter Zijlstra, Pedro M. R. Paulo, Kuai Yu, Qing-Hua Xu and Michel Orrit*,
Chemical Interface Damping in Single Gold Nanorods and Its Near Elimination by
Tip-Specific Functionalization, Angew. Chem. Int. Ed., 2012, 51, 8352.
5. Kuai Yu, Guanjun You, Lakshminarayana Polavarapu and Qing-Hua Xu*, Bimetallic
Au/Ag Core-Shell Nanorods Studied by Ultrafast Transient Absorption Spectroscopy
under Selective Excitation, J. Phys. Chem. C 2011, 115, 14000.
6. Kuai Yu, Lakshminarayana Polavarapu and Qing-Hua Xu*, Excitation Wavelength
and Fluence Dependent Femtosecond Transient Absorption Studies on Electron
Dynamics of Gold Nanorods, J. Phys. Chem. A 2011, 115, 3820.
7. Xiaosheng Tang, Kuai Yu, Qinghua Xu, Eugene Shi Guan Choo, Gregory K. L. Goh
and Junmin Xue*, Synthesis and Characterization of AgInS
2
-ZnS Heterodimers with
Tunable Photoluminescence, J. Mater. Chem., 2011, 21, 11239.
8. Lakshminarayana Polavarapu, Kiran Kumar Manga, Kuai Yu, Priscilla Kailian Ang,
Hanh Duyen Cao, Janardhan Balapanuru, Kian Ping Loh* and Qing-Hua Xu*,
Alkylamine Capped Metal Nanoparticle “Inks” for Printable SERS Substrates,
Electronics and Broadband Photodetectors, Nanoscale 2011, 3, 2268.
xx|Page
1|Page
Chapter 1 Introduction of Optical Properties of
Noble Metal Nanoparticles
Noble metal nanoparticles, with diameter ranging roughly between 1 and 100 nanometers, are
known to display many unique optical properties and have received great attention in the past
two decades. The most striking phenomenon encountered in noble metal nanostructures is
electromagnetic resonance due to the collective oscillations of the conduction electrons
termed plasmons. Because of the reduced sizes of nanoparticles, which gives rise to quantum
confinement of electrons, plasmons are easily excited by incident light and lead to strong light
scattering and absorption and an enhancement of the local electromagnetic field. Those
appealing characters of plasmons make the noble metal nanoparticles attractive not only in
fundamental science but also in potential technological applications.
Although optical properties of noble metal nanoparticles have been of great interest for
centuries, modern scientific understanding did not begin until Michael Faraday’s work of the
1850s.
1
Until 1908, Gustav Mie provided the exact analytical solution to interpret
quantitatively the scattering and absorption by spherical metal nanoparticles.
2
The response of
a metal sphere to an external electromagnetic field can be calculated by solving Maxwell’s
equations. Although the theory of electrodynamics developed by Maxwell in the 19
th
century
successfully describes the interaction of magnetic and electric fields in free space, it fails to
depict the light interaction with matter. Until the beginning of the 20
th
century the internal
structure of solids was slowly discovered and provided the background for understanding the
interaction of light with matter. By including the materials properties (for example the
complex dielectric function ε) in the extended Maxwell’s equations, the linear optical
properties are therefore theoretically predicted.
The nonlinear optical properties have also been seen tremendous advance in the past
two decades. In this chapter we will review one aspect of the fundamental optical properties
2|Page
of noble metal nanoparticles: the dynamics that occur following absorption of photons or
exciting the plasmon oscillations. Understanding the sequence of the events following photon
absorption and their theoretical analysis are the core of this chapter. The different
photophysical processes are discussed in chronological order, that is, starting with optical
excitation and dephasing of the plasmon, going through internal relaxation of the electrons via
electron-electron scattering, electron-phonon coupling and ending with energy dissipation in
the environment, together with the particle oscillations.
3-5
To understand electron dynamics of metal nanoparticles, we use the ultrafast lasers
with femtosecond resolution as the study tools. We will briefly describe the optical setup in
our studies, including a description of pump-probe spectroscopy on ensemble measurements,
single-particle pump-probe spectroscopy on microscopy, a general discussion of the white-
light scattering, light sources and detectors for single particle studies. At the end of this
chapter, an outline of the research that I have conducted is presented.
1.1 Noble Metal Nanoparticles
Consider two pieces of solid gold, one is much bigger than the other, they are supposed to be
shiny and yellowish-orange to our naked eyes. Also they will have the same intensive
properties as bulk gold in every sense: the same elastic moduli, the same density, the same
heat capacity, the same thermal conductivity and the same melting temperature. You may say
that this is obvious: the smaller solid gold is still made out of gold, with the intrinsic material
properties that belong to it. However, keep reducing the size of the solid gold to the size range
of 1 nm to 100 nm –which is called nanoparticle, at some point, the material properties will
become very different from the bulk material properties. The emerging properties will depend
on the size and shape of the object. Because of this interesting phenomenon, nanoparticle
research is in rapid expansion so as to understand the properties of these materials as
functions of their size and shape.
3|Page
It is one of the first big challenges of physical and chemistry science today to
synthesize the uniform and various kinds of shape of nanoparticles, especially for noble metal
nanoparticles which gave spectacular optical properties in the visible range. Since 1850s, the
first documented solution-phase synthesis of gold metal nanoparticles was reported by
Michael Faraday. Numerous methods have been developed to synthesize noble metal
nanoparticles using wet chemistry. For instances, gold nanospheres, gold nanorods, Au/Ag
core-shell nanorods, Ag nanowires are successfully synthesized as shown in Figure 1.1.
b)
a)
c) d)
Figure 1.1: Transmission electron microscope images of (a) gold nanospheres, (b) gold
nanorods, (c) Au/Ag core-shell nanorods, and (d) scanning electron microscope image of
silver nanowires.
1.2 Optical Properties
This subsection gives an introduction to the linear optical properties of noble metal
nanoparticles (Ag and Au). Discussions are the optical properties of their bulk metals and Mie
theory to understand the extinction spectra of spherical nanoparticles, nanorods and core-shell
shapes.