Mechanistic study of fischer tropsch synthesis for clean fuel production
Bạn đang xem bản rút gọn của tài liệu. Xem và tải ngay bản đầy đủ của tài liệu tại đây (4.03 MB, 198 trang )
MECHANISTIC STUDY OF FISCHER TROPSCH
SYNTHESIS FOR CLEAN FUEL PRODUCTION
ZHUO MINGKUN
(B. Eng. (Hons.), NUS)
A THESIS SUBMITTED
FOR THE DEGREE OF DOCTOR OF PHILOSOPHY
DEPARTMENT OF CHEMICAL & BIOMOLECULAR
ENGINEERING
NATIONAL UNIVERSITY OF SINGAPORE
2013
Declaration
I hereby declare that this thesis is my original work and it has been written by
me in its entirety. I have duly acknowledged all the sources of information
which have been used in this thesis.
This thesis has also not been submitted for any degree in any university
previously.
____________________________
Zhuo Mingkun
07 January 2013
I
ACKNOWLEDGEMENTS
I would like to take this opportunity to extend my sincere appreciation to my
main supervisor, Assoc. Prof. Mark Saeys from NUS, for his patience, support,
insight and guidance throughout my PhD research. He has been providing
great ideas and technical knowledge which are invaluable to my research work.
I also wish to extend my gratitude to my co-supervisor, Dr. Armando Borgna
from ICES, for his supervision throughout my experimental studies in ICES.
Without his supervision and help, I would not be able to complete the
experimental works. I am also thankful to Dr. Chang Jie, Dr. Chen Luwei, Dr.
James Highfield, Mr. Poh Chee Kok and staffs in ICES who have helped me in
one way or another on the experimental studies.
To my seniors, Dr. Xu Jing and Dr. Tan Kong Fei who mentored me in the
usage of VASP and provided me with all the technical guidance, I thank you.
To Dr. Sun Wenjie, Gavin Chua Yong Ping, Fan Xuexiang, Ravi Kumar
Tiwari, Trinh Quang Thang, Cui Luchao, Novi Wijaya, Arghya Banerjee, G T
Kasun Kalhara Gunasooriya and Yi Rui who are my colleagues/lab mates, I
thank you for your help, support, camaraderie and encouragement throughout
my research work.
Finally, special thanks to my dear wife Koh Shu Hui, Regina, for being there
to support me as I pursue my doctorate degree. I am extremely grateful for her
love, patience and especially her understanding, which have enabled my
doctorate journey to be meaningful and successful.
II
TABLE OF CONTENTS
Acknowledgements ····································································· I
Table of contents ······································································· II
Summary ··············································································· VI
Symbols and abbreviations ························································ VIII
List of tables ············································································ X
List of figures ········································································ XIII
Publications ·········································································· XIX
Chapter 1 Introduction ·································································· 1
1.1 Scope and organization of the thesis ········································· 7
1.2 References ····································································· 10
Chapter 2 Literature Review of the Reaction Mechanisms and the Surface
Structure of Co-based Catalysts in FT Synthesis ································· 13
2.1 Introduction···································································· 13
2.2 Proposed mechanisms for the Fischer-Tropsch Synthesis ·············· 14
2.2.1 Carbide mechanism ···················································· 15
2.2.2 Hydrogen-assisted CO dissociation ·································· 18
2.2.3 CO insertion mechanism ·············································· 20
2.2.4 Other proposed mechanisms ·········································· 25
2.2.5 Kinetics of FT synthesis ··············································· 27
2.3 Catalyst surface structure under Fischer-Tropsch conditions ·········· 31
2.3.1 Terrace vs Stepped surface ············································ 31
2.3.2 CO Coverage on the surface of Co terrace ·························· 36
2.3.3 Surface reconstructions ················································ 38
2.4 Summary ······································································ 42
2.5 References ···································································· 44
III
Chapter 3 Computational and Experimental Methods ·························· 49
3.1 Computational methods ······················································ 49
3.1.1 Density Functional Theory (DFT) and Vienna Ab-Initio Simulation
Package (VASP) ································································ 49
3.1.2 Modeling with VASP in this thesis ···································· 51
3.2 Gibbs Free Energy and Phase Diagram ··································· 55
3.2.1 From DFT-PBE electronic energy to Gibbs free energy ··········· 55
3.2.2 Phase diagram ···························································· 58
3.2.3 CO over-binding correction factor ····································· 62
3.3 Kinetic Modeling ····························································· 63
3.4 Experimental methods ······················································· 67
3.4.1 Catalyst synthesis ························································ 67
3.4.2 Temperature Programmed Reduction (TPR) ························· 68
3.4.3 Reactor tests ······························································ 69
3.5 References ····································································· 72
Chapter 4 CO Surface Coverage and Stability of Intermediates on a Co
Catalyst ················································································· 74
4.1 Introduction ···································································· 74
4.2 Results and Discussion ······················································· 75
4.2.1 CO adsorption on a Co(0001) surface································· 75
4.2.2 Hydrogen adsorption on a (
33
)R30º-CO Co(0001) surface
····················································································· 82
4.2.3 Effect of co-adsorbed CO on the stability of adsorbed CH
and CH
2
····················································································· 85
4.3 Conclusions ···································································· 87
4.4 References ····································································· 88
IV
Chapter 5 Density Functional Theory Study of the Hydrogen-Assisted CO
Dissociation and the CO Insertion Mechanism for Fischer-Tropsch Synthesis
over Co Catalysts ······································································ 89
5.1 Introduction ···································································· 89
5.2 Results and Discussion ······················································· 90
5.2.1 Effect of Hydrogenation on the C–O Dissociation Barrier ······· 91
5.2.2 Barriers for CO insertion into CH
x
species ························· 97
5.2.3 Effect of CH
x
coupling and hydrogenation on the C–O
dissociation barrier ···························································· 99
5.2.4 Barriers for CHCO, CH
2
CO and CH
3
CO hydrogenation ········ 102
5.2.5 Kinetic model for propagation via CO insertion ·················· 107
5.3 Conclusions ·································································· 112
5.4 References ···································································· 113
Chapter 6 Effect of CO coverage on the Kinetics of the CO Insertion
Mechanism and on the Carbon stability on Co Catalyst ························ 115
6.1 Introduction ··································································· 115
6.2 Results and Discussion ······················································ 117
6.2.1 Effect of CO coverage on the kinetics of the CO insertion
mechanism ···································································· 117
6.2.2 Effect of CO coverage on the stability of carbon ················· 131
6.3 Conclusions ··································································· 146
6.4 References ···································································· 147
Chapter 7 Initial Experimental Studies of Fischer-Tropsch Synthesis over Co
Catalysts. Effect of Boron Promotion and Co-feeding Mechanistic Studies
·························································································· 150
7.1 Introduction ··································································· 150
7.2 Results and Discussion ······················································ 151
7.2.1 Testing of the reactor system ········································ 151
V
7.2.2 FT synthesis with unpromoted and boron promoted Co catalyst at
493 K ··········································································· 153
7.2.3 Aldehyde co-feeding experiments ·································· 160
7.3 Conclusions ··································································· 166
7.4 References ···································································· 167
Chapter 8 General Conclusions ···················································· 168
Appendix A ··········································································A-1
A1.1 Sample calculations for conversions and products selectivites ·····A-1
A1.2 References ··································································A-7
VI
SUMMARY
Fischer-Tropsch (FT) synthesis converts syngas, a mixture of CO and H
2
, into
long-chain alkanes, alkenes, small amounts of oxygenates, and water. Despite
numerous scientific efforts to better understand the mechanism and the active
site requirements of this complex catalytic reaction, the detailed sequence of
C–O bond scission and C–C bond formation steps, as well as the nature of the
active sites, remains unclear. In this thesis, first principles Density Functional
Theory (DFT) calculations have been applied to understand the mechanism of
FT synthesis over Co catalysts and surface coverage of CO under FT
conditions. Under a realistic CO coverage, the mechanism was re-evaluated to
understand the influence of CO on the FT mechanism on Co catalysts.
Density functional theory calculations indicate that the CO coverage on
Co(0001) increases gradually until a (
33
)R30º-CO configuration (1/3
ML) is formed. This structure is stable over a relatively wide temperature and
pressure range, until a phase transition to a (
2 3 2 3
)R30º-7CO structure
occurs at high CO pressures. The 1/3 ML CO coverage reduces the H
2
binding
enthalpy from –121 to –74 kJ/mol and reduces the hydrogen coverage to
below 0.3 ML.
Next, DFT calculations indicate that CO activation has a barrier of 220 kJ/mol
on Co(0001) terrace surface. Hydrogenation lowers the C–O dissociation
barrier to 90 kJ/mol for HCO and to 68 kJ/mol for H
2
CO. However, CO
VII
hydrogenation has a high energy barrier of 146 kJ/mol and is +117 kJ/mol
endothermic. An alternative propagation cycle starting with CO insertion into
surface RCH groups is proposed in this thesis. The barrier for this step is 74
kJ/mol on a Co terrace surface. The calculated CO turnover frequency (TOF)
for the proposed CO insertion mechanism is 30 times faster than the hydrogen
assisted CO activation but still significantly lower than the experimental
observed CO TOF of 0.02 s
-1
. When a more realistic CO coverage is
considered, stability of intermediates is expected to decrease and CO TOF for
the propagation mechanism is expected to increase.
The stabilities of the reaction intermediates and reaction barriers in the CO
insertion mechanism were re-evaluated under a realistic 1/3 ML CO coverage.
The 1/3 ML CO coverage reduces the stability of the reaction intermediates by
10-30 kJ/mol. For the CO insertion mechanism, the reduced stabilities
decrease the overall surface barrier from 175 kJ/mol to 111 kJ/mol. This
reduced barrier increases the CO TOF to 0.02 s
-1
, close to experimental values
and five orders of magnitude higher than the corresponding low coverage
value. Next, carbon adsorption on a Co(0001) terrace is studied with and
without the influence of CO on the surface. Under realistic CO coverage,
carbon formation on the surface becomes very unfavourable whereas stability
of subsurface carbon is improved. An attractive interaction is present between
subsurface carbon and CO on the surface, which leads to the improvement in
stability. The calculations show that it is important to consider a more realistic
intermediate coverage in the model to account of the possible repulsive and
attractive interactions.
VIII
SYMBOLS AND ABBREVIATIONS
Symbols
),( Rx
Wave function
ˆ
H
Hamiltonian operator
E
i
Total energy of the system
E
adsorption
Adsorption energy
E
total
Total DFT-PBE electronic energy
E
slab
DFT-PBE electronic energy of a clean slab
E
x
Electronic energy of adsorbate in free space
G
Gibbs free energy
H
Enthalpy
h
Plank’s constant
k
Boltzmann constant
k
i
Rate constant
K
i
Adsorption constant
P
Pressure
R
Gas constant
r
Rate of reaction
S
Entropy
T
Temperature
v
i
Vibrational frequencies
IX
Abbreviations
DFT
Density Functional Theory
FT
Fischer-Tropsch
GGA
Generalized Gradient Approximation
GC
Gas Chromatography
HREELS
High-Resolution Electron Energy Loss Spectroscopy
KMC
Kinetic Monte Carlo
LEED
Low Energy Electron Diffraction
NEB
Nudged Elastic Band
PAW
Projector-Augmented-Wave
PBE
Perdew-Burke-Ernzerhof functional
PM-RAIRS
Polarization Modulation Reflection-Adsorption Infrared
Spectroscopy
SSITKA
Steady State Isotopic Transient Kinetic Analysis
STM
Scanning Tunneling Microscopy
TCD
Thermal Conductivity Detector
TOF
Turnover Frequency
TPR
Temperature Programmed Reduction
VASP
Vienna Ab-Initio Simulation Package
WGS
Water-Gas Shift
ZPE
Zero-Point Energy
X
LIST OF TABLES
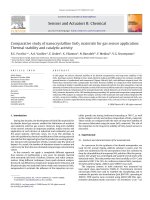
Table 3.1.
Adsorption energies of selected surface species on a
clean p(3×3) Co(0001) surface with different k-point
grid and slab thicknesses.
54
Table 3.2
Zero-point energies of the gas and adsorbed species in
Equation 3.7. All values are calculated using Equation
3.6.
57
Table 3.3
Entropies, enthalpy temperature corrections and
partial pressures of species in Equation 3.7.
57
Table 3.4
Thermochemical properties of C
2
H
2
, C
2
H
4
, C
2
H
6
and
H
2
at Standard Temperature and Pressure from
National Institution of Standards and Technology
( last accessed: 25
Dec 2012)
60
Table 3.5
Correction factors for CO over-binding on different
adsorption sites for calculations using DFT-GGA
(Pick, 2007).
62
Table 4.1
Average CO adsorption enthalpies at 500 K (kJ/mol)
for different configurations and coverages on
Co(0001). The DFT-PBE adsorption enthalpy and the
adsorption enthalpy including the over-binding
correction factors (Section 3.2.3) are shown for each
configuration.
76
Table 4.2
Average hydrogen (H
2
) adsorption enthalpies at 500 K
(kJ/mol) on a p(3x3)-3CO Co(0001) surface.
84
Table 4.3
Adsorption stabilities at the preferred sites for the
different reaction intermediates.
86
Table 5.1
Adsorption energies at the preferred sites for different
reaction intermediates calculated using a p(2×2)
Co(0001) unit cell.
93
Table 5.2a
Barriers and TS Geometries for CO Scission in H
x
CO
(x = 0, 1, 2) on a Co(0001) Surface. Calculations used
a p(2×2) Co(0001) unit cell.
94
Table 5.2b
Barriers and TS Geometries for CO Hydrogenation on
a Co(0001) Surface. Calculations used a p(2×2)
Co(0001) unit cell.
95
XI
Table 5.3
Barriers and TS Geometries for CO Insertion into CH
x
on a Co(0001) Surface. Calculations used a p(3×3)
Co(0001) unit cell.
98
Table 5.4
Barriers and TS Geometries for C–O Dissociation of
CH
x
CH
y
O (x = 1 – 3; y = 0, 1) species on a Co(0001)
Surface. Calculations used a p(3×3) Co(0001) unit
cell.
100
Table 5.5
Barriers and TS Geometries for the Hydrogenation of
CH and CH
x
CH
y
O (x = 1 – 3; y = 0, 1) species on a
Co(0001) Surface. Calculations used a p(3×3)
Co(0001) unit cell.
104
Table 5.6
Adsorption energies at the preferred sites for different
reaction intermediates calculated on a p(3×3)
Co(0001) unit cell.
106
Table 6.1
Transition state geometries for the CH + CO and CH
2
+ CO coupling reactions in the presence of CO on
Co(0001). The labels correspond to the reactions in
Table 6.3
118
Table 6.2
Adsorption energies at the preferred sites for the
different reaction intermediates. Note that the values
in this Table are electronic adsorption energies.
120
Table 6.3
Energy barriers (E
f
) and reaction energies (∆E
rxn
) for
the C-C coupling, C-O scission and hydrogenation
reactions, for a low coverage and in the presence of
co-adsorbed CO. The effective barriers (E
eff
) indicate
the energy of the transition state relative to CH*, CO*,
and four H*, as illustrated in Figure 6.2.
122
Table 6.4
Transition state geometries for the six C–O scission
reactions in the presence of co-adsorbed CO. The
labels correspond to the reactions in Table 6.3.
123
Table 6.5
Transition state geometries for the 15 hydrogenation
reactions in the presence of co-adsorbed CO. The
labels correspond to the reactions in Table 6.3
126
Table 6.6
Adsorption energies and Gibbs free energies of
reaction, ΔG
r
(500 K, 20 bar), under FTS condition for
carbon adsorption on the p(3×3) Co(0001) surface.
135
XII
Table 6.7
Adsorption energies and Gibbs free energies of
reaction, ΔG
r
(500 K, 20 bar), under FTS condition for
hydrogen adsorption on the p(3×3) Co(0001) surface.
138
Table 6.8
DFT-PBE CO adsorption energy on positions TOP
sites of the Co surface with 1 to 3 carbons in present
in the first subsurface octahedral site.
140
Table 6.9
Charges € on Co atoms, subsurface carbon and CO on
the Co(0001) surface.
141
Table 6.10
Center of electron density of Co d-orbital electrons
and carbon of adsorb CO p-orbital electrons.
142
Table 7.1
Detailed comparison of experimental conditions and
results between Tan et al. (2011; PhD thesis) and this
thesis for FT synthesis using 1.0 g of 20 wt% Co/γ-
Al
2
O
3
catalysts, promoted with boron. (H
2
:CO = 2, 20
bar; W/F 7.5 g
cat
h/mol)
155
Table 7.2
List of unknown products formed during
propionaldehyde co-feeding and hydrogenation
experiments. Carbon number of the products is
identified by comparing against known FT products
distribution.
163
Table A1.1
Normalized inlet flow rates and concentrations for H
2
,
CO and Ar.
A-2
Table A1.2
Peak areas for the components detected by the TCD
and concentration (v/v) of each component calculated
with the calibration charts in Figure 3.5.
A-3
Table A1.3
Peak areas for the products detected by the FID, the
weight percent, mole percent and carbon balance.
A-5
XIII
LIST OF FIGURES
Figure 1.1
Image of a step-edge. The darker atoms show the
location of a B5 site.
5
Figure 1.2
(a) STM image of a clean Co(0001) single crystal
before exposure to syngas and (b) after 1 hour
exposure to syngas at reaction conditions,
(Wilson and de Groot, 1995).
6
Figure 1.3
A tree diagram summarizing the original scope of study
for this thesis. Highlighted boxes (in grey) indicate
studies that have been conducted and presented in this
thesis.
9
Figure 2.1
Carbide mechanism for the Fischer – Tropsch
Synthesis.
15
Figure 2.2
Product distribution of isotopically labeled propene
molecules produced in a series of experiments where
mixtures of 90%
13
CO + 10%
12
CO, and CH
2
N
2
was
passed over Co catalyst at 523 K and 1 bar. (○)
Experimentally observed distribution is represented by
the dotted lines; (Δ) Distribution predicted by the
carbide mechanism; (◊) Distribution predicted by the
CO insertion mechanism; (□) Distribution predicted by
the enol mechanism. An increasing amount of CH
2
N
2
was used in experiments a – d. (Brady and Pettit, 1981)
16
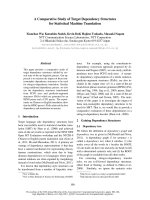
Figure 2.3
Hydrogen assisted CO activation mechanism.
19
Figure 2.4
CO insertion mechanism by Pichler and Schulz (1970)
and Schulz and Zein El Deen (1977).
21
Figure 2.5
Alternative CO insertion mechanism (Masters, 1979).
22
Figure 2.6
Proposed propagation cycle via CO insertion by Zhuo
et al. (2009), Chapters 5 and 6.
23
Figure 2.7
Outlet flows (molecules/s) during the build-up
experiment. Conditions: T = 503 K, p
tot
= p
atm
, total
volumetric flow rate D
tot
= 40 cm
3
/min and H
2
/CO = 3.
The inserts provides a zoom into the early stages of
build-up and allows identification of delay times.
(Schweicher et al., 2012)
25
Figure 2.8
The enol mechanism proposed by Storch et al. (1951).
26
XIV
Figure 2.9
Proposed mechanism by Frennet et al. (2005).
27
Figure 2.10
Rate of CO conversion to hydrocarbons (extrapolated
to zero CO conversion) at 0.25-1.20 MPa CO (•, 1.20
MPa H
2
) and 0.40-1.00 MPa H
2
(○, 0.40 MPa CO) at
508 K on Fe-Zn-Cu-K catalyst. (Ojeda et al., 2010)
30
Figure 2.11
Turnover frequency (TOF) as a function of cobalt
particle size. (■) – H
2
/CO = 2, 1 bar and 393 K; (▲) –
35 bar and 383 K ; (○) – H
2
/CO = 10, 1.85 bar and 373
K. ( den Breejen et al., 2009)
34
Figure 2.12
Spectra of O1s and C1s after heating ethanol-saturated
surface to different temperatures, as indicated.
Reference spectra of O1s and C1s are shown in orange.
The image in the middle shows the results of a
temperature-programmed X-ray photoelectron
spectroscopy (TP-XPS) experiment. The breaking of
the C–O bond of the ethoxy moiety into atomic oxygen
(529.26 eV) and acetylene (283.3 eV) occurs around
350 K. (Weststrate et al., 2010)
35
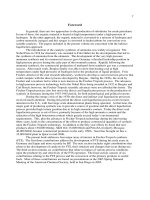
Figure 2.13
Configurations of CO adsorption on Co(0001) surface.
a) (
33
)R30º-CO structure, θ = 1/3 ML; b)
(
2 3 2 3
)R30º-7CO, θ = 7/12 ML. Colour map:
Large blue atoms represent the surface of hcp
Co(0001); Grey atoms represent carbon; Red atoms
represent oxygen.
38
Figure 2.14
FCC–Co(100) surface at a C coverage of 0.5 ML
(Left). Clock reconstructed FCC–Co(100) surface at a
C coverage of 0.5 ML (Right). (Ciobîcă et al., 2008).
39
Figure 2.15
Scanning Tunneling Microscopy (STM) images. a)
Image of a larger area showing the edge of a
(
33
)R30
o
island and a (1×1) periodicity between
islands. b) A 2D Fourier transform of image (a) that
shows both (
33
)R30
o
and (1×1) structures.
(Weststrate et al., 2012)
41
XV
Figure 3.1
a) Model of a p(2×2) unit cell showing all available
adsorption sites on the surface. (×) – Top; (–) – Bridge;
(∆) – Fcc; (○) – Hcp. b) Model of a p(3×3) unit cell. c)
A 3 layers p(3×3) model slab in the z – direction with
inter-slab spacing of 10 Å. The top two layers are
relaxed while the bottom layer is constrained to the
bulk positions. d) Optimization of lattice constant for
bulk hcp Co.
52
Figure 3.2
Phase diagram for acetylene, ethylene and ethane
plotted with respect to temperature and hydrogen
pressure. (■) High temperature of 1667 K, and high
hydrogen partial pressure of 100 bar where ethylene is
dominant.
61
Figure 3.3
A semi-automated parallel micro fixed-bed reactor
system (Newton & Stokes, Singapore) and a simplified
process flow diagram that describes the operation of
the reactor system.
70
Figure 4.1
Average (▲) and differential (■) CO adsorption
enthalpy as a function of the CO coverage (θ
CO
) on
Co(0001) for the structures shown in Table 1. The
differential adsorption enthalpy is defined as the
adsorption enthalpy for each additional CO molecule in
a p(3x3) unit cell for coverages up to 1/3 ML, and as
the adsorption enthalpy for the CO molecules added to
a surface with 1/3 ML CO for coverages above 1/3ML.
TΔS
adsorption
represents the Gibbs free energy loss
resulting from the CO adsorption entropy at 500 K.
77
XVI
Figure 4.2
Stability diagram for CO adsorption on Co(0001). The
CO adsorption enthalpies are summarized in Figure 1,
while the structures are shown in Table 1. Three
regions can be identified: below the ΔG
ads
=0 line, the
equilibrium CO coverage is below 1/3 ML; above the
ΔG
ads
=0 line, the (
33
)R30º-CO phase is stable
and adsorption of additional CO molecules beyond 1/3
ML is unfavorable; above the solid line, a phase
transition to a (
2 3 2 3
)R30º-7CO configuration is
predicted. The dotted line indicates the conditions
where it is favorable to form a metastable p(3x3)-5CO
configuration starting from the (
33
)R30º-CO
configuration. (▼) Experimental conditions (7×10
-9
mbar and 300 K) where a (
33
)R30º-CO was
observed by Bridge et al. (1977). (∆) Experimental
conditions (below 1 mbar and at 300 K) where a
(
33
)R30º-CO was observed by Beitel et al.
(1996). (▲) Experimental conditions (100 mbar and
490 K) where a (
33
)R30º-CO structure was
observed by Beitel et al. (1997). (●) Experimental
conditions (100 mbar and 300 K) where a
(
2 3 2 3
)R30º-7CO structure was observed by
Beitel et al. (1997). (■) Typical FT synthesis conditions
(6 bar and 500 K).
78
Figure 4.3
Average (▲) and differential (■) hydrogen (H
2
)
adsorption enthalpy in the presence of 1/3 ML CO, as a
function of the hydrogen coverage (θ
H
). The
differential adsorption enthalpy is the adsorption
enthalpy for each additional H atom in the p(3x3)-3CO
unit cell. The insert illustrates how the hydrogen
coverage changes as a function of the average
adsorption enthalpy. The indicated 0.3 ML coverage
and the average adsorption enthalpy of −54 kJ/mol
correspond to typical FT conditions, i.e., a H
2
partial
pressure of 9 bar.
85
Figure 5.1
Energy profile for the hydrogen-assisted CO activation
mechanism on a Co(0001) terrace surface.
96
Figure 5.2
Energy profile for RCH
2
C–O pathway via CO insertion
into RCH species.
107