Compensatory growth of the sandbar shark in the western north atlantic including the gulf of mexico
Bạn đang xem bản rút gọn của tài liệu. Xem và tải ngay bản đầy đủ của tài liệu tại đây (483.82 KB, 12 trang )
BioOne sees sustainable scholarly publishing as an inherently collaborative enterprise connecting authors, nonprofit publishers, academic institutions, research
libraries, and research funders in the common goal of maximizing access to critical research.
Compensatory Growth of the Sandbar Shark in the Western North Atlantic
Including the Gulf of Mexico
Author(s): J. G. Romine, J. A. Musick and R. A. Johnson
Source: Marine and Coastal Fisheries: Dynamics, Management, and Ecosystem Science, 5():189-199.
2013.
Published By: American Fisheries Society
URL: />BioOne (www.bioone.org) is a nonprofit, online aggregation of core research in the biological, ecological, and
environmental sciences. BioOne provides a sustainable online platform for over 170 journals and books published
by nonprofit societies, associations, museums, institutions, and presses.
Your use of this PDF, the BioOne Web site, and all posted and associated content indicates your acceptance of
BioOne’s Terms of Use, available at www.bioone.org/page/terms_of_use.
Usage of BioOne content is strictly limited to personal, educational, and non-commercial use. Commercial inquiries
or rights and permissions requests should be directed to the individual publisher as copyright holder.
Marine and Coastal Fisheries: Dynamics, Management, and Ecosystem Science 5:189–199, 2013
C
American Fisheries Society 2013
ISSN: 1942-5120 online
DOI: 10.1080/19425120.2013.793631
SPECIAL SECTION: ELASMOBRANCH LIFE HISTORY
Compensatory Growth of the Sandbar Shark in the Western
North Atlantic Including the Gulf of Mexico
J. G. Romine,*
1
J. A. Musick, and R. A. Johnson
Virginia Institute of Marine Science, 1208 Greate Road, Gloucester Point, Virginia 32065, USA
Abstract
The number of Sandbar Sharks Carcharhinus plumbeus in the western North Atlantic Ocean has experienced a
drastic decline since the early 1980s, reaching a minimum during the early 1990s. Catch rates in the early 1990s were
a mere 25% of those during the 1980s. According to several fishery-independent surveys, the low point in Sandbar
Shark abundance followed a period of high exploitation. Growth models fit to age–length data collected from 1980
to 1983 and from 2001 to 2004 were compared to investigate potential changes in parameter estimates that might
reveal compensatory responses in the Sandbar Shark population. Statistical differences were found between the model
parameters for the two time periods, but the differences in growth rates were minimal. The parameters from the
three-parameter von Bertalanffy growth model for female sharks during the 1980–1983 and 2000–2004 time periods
were as follows: L
∞
= 188.4 and 178.3 cm FL; k = 0.084 and 0.106; and t
0
=−4.097 and −3.41. For males the growth
parameters were as follows: L
∞
= 164.63 and 173.66 cm; k = 0.11 and 0.11; and t
0
=−3.62 and −3.33. The estimated
age at 50% maturity for female Sandbar Sharks changed from 15 years to 12.49 years between the two time periods.
The Sandbar Shark Carcharhinus plumbeus is a common
large coastal shark that inhabits temperate and subtropical wa-
ters worldwide and attains lengths greater than 2 m (Compagno
1984). In the western North Atlantic Ocean (WNA), this species
inhabits nearshore waters out to the edge of the continental shelf
from Cape Cod to Brazil (Bigelow and Schroeder 1948; Springer
1960; Garrick 1982). Tagging studies suggest that this region
is composed of two unit stocks. One stock is found from Cape
Cod south to the northern Yucatan peninsula and throughout
the Gulf of Mexico; the other is found from Trinidad to Brazil
(Springer 1960; Kohler et al. 1998). Genetic studies conducted
on specimens from Virginia waters and the Gulf of Mexico fur-
ther support the existence of a single stock that utilizes the area
of Cape Cod to the northern Yucatan peninsula (Heist et al.
1995).
The Sandbar Shark in the WNA undertakes seasonal migra-
tions from the Gulf of Mexico and Florida to as far north as Cape
Subject editor: William Driggers, National Marine Fisheries Service, Pascagoula, Mississippi
*Corresponding author:
1
Present address: U.S. Geological Survey, Western Fisheries Research Center, Columbia River Research Laboratory, 5501A Cook-Underwood
Road, Cook, Washington 98605, USA.
Received December 21, 2012; accepted March 28, 2013
Cod as water temperatures rise in the spring and returns south
as water temperatures decrease in the fall (Springer 1960; Mu-
sick and Colvocoresses 1986). Adult males often inhabit waters
along the edge of the continental shelf out to depths of 250 m,
while juveniles and females are generally found inshore.
The mode of reproduction in the Sandbar Shark is placen-
tal viviparity, with females giving birth to well-developed live
young. In the WNA, young are approximately 47 cm (FL)
at birth (Springer 1960; Castro 1993a; Sminkey and Musick
1995; Cort
´
es 2000; Baremore and Hale 2012), and litter sizes
average nine sharks (Springer 1960; Clark and von Schmidt
1965; Sminkey and Musick 1996; Cort
´
es 2000; Baremore and
Hale 2012). Due to the advanced development of the pups, a
long gestation period of approximately 9–12 months is required
(Springer 1960; Clark and von Schmidt 1965; Lawler 1976;
Baremore and Hale 2012). Maturity in both males and females
has been estimated to occur between 12 and 30 years of age
189
190 ROMINE ET AL.
at lengths of approximately 148–155 cm FL (Springer 1960;
Casey et al. 1985; Sminkey and Musick 1995; Baremore and
Hale 2012). Maximum reported lengths are 194 and 187 cm FL
for females and males, respectively (Cort
´
es 2000).
Previous studies of the age and growth of Sandbar Sharks
from the WNA have yielded mixed results. Lawler (1976) pro-
duced unrealistic values for asymptotic length (221 cm FL) and
only provided von Bertalanffy growth parameters for female
Sandbar Sharks due to a limited sample size for males. Casey
et al. (1985) provided a more comprehensive study of the age
and growth of Sandbar Sharks in the WNA that had a large sam-
plesize(n = 475), but they too produced unrealistic asymptotic
length estimates (303 cm FL) that resulted in very low growth
coefficients (k = 0.04 and 0.05 for females and males, respec-
tively). Casey et al. (1985) lacked a representative sample from
larger size-classes, which is an inherent problem in conduct-
ing an age–growth study on long-lived species. The oldest male
in their sample set was estimated to be 15 years old, and the
oldest female was estimated to be 21 years old. Through back-
calculation, this study estimated maturity to be attained between
12 and 13 years of age. Casey and Natanson (1992) estimated
new growth parameters based on tagging experiments and pro-
posed age at maturity to be approximately 30 years and the the-
oretical maximum size to be 186 cm FL. These estimates more
than doubled the previously estimated age at maturity by Casey
et al. (1985). Sminkey and Musick (1995) reexamined the age
and growth of Sandbar Sharks from samples obtained a decade
apart, 1980–1981 and 1991–1992. The sample set from 1991 to
1992 was the largest sample size and had the greatest size range
of any study conducted on Sandbar Sharks to date. That study
indicated that juvenile growth rates were slightly higher in the
later period, but the back-calculated age at maturity (15 for males
and 16 years for females) remained unchanged. Merson (1998)
estimated that maturity was attained at 19 years of age for fe-
males from a back-calculation of age at length using the growth
curve from Sminkey and Musick (1995). Back-calculation can
underestimate age at length, leading to an inflated estimate of
age at maturity (Sminkey and Musick 1995). In 2010, the age
at maturity was estimated to be 12.1 and 13.1 years for males
and females, respectively (Baremore and Hale 2012). These es-
timates were the first to use reproductive analysis of directly
aged Sandbar Sharks in the WNA. In short, age-at-maturity es-
timates for Sandbar Sharks in the WNA have ranged from 12 to
30 years since 1985, with the most recent estimates being those
estimated by Baremore and Hale (2012).
Andrews et al. (2011) used bomb-radiocarbon aging of five
individual Sandbar Sharks to verify the annual periodicity of
band pair formation in vertebral centra. This study indicated
that the age estimates of sharks older than 10 years of age may
not be accurate and could lead to underestimates of age due to
band pair compression at the margin of the centra when one is
using the methods of aging as defined by Casey et al. (1985).
The authors state that many additional band pairs were evident
besides those that traversed the intermedialia and that when
counted ages are in close agreement with the ages estimated
through bomb-radiocarbon analyses.
The Sandbar Sharks in the WNA have experienced dras-
tic reductions in numbers due to overfishing, which reflects
the absence of a Fishery Management Plan (FMP) prior to the
1990s. Several indices from fishery-independent and -dependent
sources have shown a steady reduction from the late 1970s to the
early 1990s, when the lowest abundance was recorded (SEDAR
2010). An FMP for large coastal sharks was adopted in 1993
(NMFS 1993), and Sandbar Sharks were managed as part of
the large coastal fishery. Sandbar Sharks have been managed on
a species-specific basis since 2008 (NMFS 2008), and landing
quotas were reduced drastically as a result of the overfished
status revealed by the 2006 stock assessment (SEDAR 2006).
Since the early 2000s there has been a gradually increasing trend
in Sandbar Shark abundance indices (SEDAR 2010). However,
the current abundance estimates remain well below those of the
early 1980s.
Compensation for population fluctuations below carrying ca-
pacities has been recognized for many oceanic r-selected organ-
isms (Clarke 1949; MacArthur and Wilson 1967; Boyce 1979;
Fowler 1981). The fishes in this category exhibit high fecundity,
rapid growth, and maturity at a young age. Deviations below
the carrying capacity for these species often result in changes
in growth parameters due to a suite of circumstances (Rose
et al. 2001). Often a decrease in population density results in
decreased intraspecific competition and thus greater availabil-
ity of food sources for each individual. As a result, mortality
rates and/or reproductive success may change. The increased
availability of food sources may result in faster growth, earlier
maturity, or higher fecundity (Jensen 1991; Hilborn and Walters
1992; Hayward et al. 1997). An increase in fecundity may occur
via either larger offspring or more offspring. Larger offspring
would contribute to population growth over time due to the
probable increase in survival due to their larger size, whereas
more offspring in each litter would have an immediate effect
on population size as well as the long-term population increase.
However, it is unlikely that compensation takes the form of
increased fecundity for two reasons: the advanced nature and
large size of Sandbar Shark offspring, and space limitations
within the uterus (Baremore and Hale 2012). Increased fecun-
dity can only occur at the cost of reduced offspring size or
substantially increased female size (Goodwin et al. 2002; Con-
rath 2005). Therefore, the most likely compensation for shark
species in terms of reproductive output is a decreased age at
maturity. Maturity may be reached at an earlier age as a conse-
quence of a faster growth rate, or an increase in the rate of growth
and in turn an increase in fecundity at the population level may
occur.
Few studies have documented changes in life history parame-
ters for elasmobranchs before and after exploitation. Carlson and
Baremore (2003) found significant increases in juvenile growth
and earlier maturity in the Atlantic Sharpnose Shark Rhizoprion-
odon terraenovae in the Gulf of Mexico after heavy exploitation,
COMPENSATORY GROWTH OF THE SANDBAR SHARK 191
but they were unable to rule out their methodology as the cause
of these differences. Cassoff et al. (2007) reported changes in
life history parameters of the Porbeagle Lamna nasus in the
WNA following exploitation. Sminkey and Musick (1995) dis-
covered slight differences in size at age among juvenile Sandbar
Sharks when samples obtained in 1980–1981 and 1990–1992
were compared. However, the older sharks in their 1990–1992
sample had undergone their fastest growth in the late 1970s and
early 1980s, i.e., before the population decline. Greater differ-
ences in growth rates may be discovered upon examination of
sharks being born during the time of lowest abundance. The
Virginia Institute of Marine Science (VIMS) longline survey re-
ported the lowest abundance of Sandbar Sharks in 1993, 1 year
after Sminkey and Musick (1995) completed their research.
The present study aimed to continue the investigation into the
potential for compensatory changes in Sandbar Shark growth
rates in the WNA by comparing the growth rates derived from
vertebral centra obtained over two time periods and to provide
revised age and growth estimates. In addition, we examined age
at maturity between the two time periods.
METHODS
Data collection.—Vertebral centra were primarily obtained
from Sandbar Sharks landed by the VIMS longline survey,
which operates in Chesapeake Bay, Virginia coastal waters, and
North Carolina coastal waters. Samples were collected from
1980 to 1983 and from 2000 to 2004 (hereafter referred to as
the VIMS1983 and VIMS2004 data sets). The VIMS1983 data
set was augmented by samples collected from shark fishing tour-
naments held in Virginia Beach, Virginia. The VIMS2004 data
set was augmented by samples collected from the Commercial
Shark Fishery Observer Program (CSFOP), which primarily
operated in the Gulf of Mexico and along the east coast of
Florida (Morgan et al. 2009). Samples were also collected by
the principal author during National Marine Fisheries Service
(NMFS) fishery-independent longline surveys (Henwood et al.
2004) from 2000 to 2004.
At sea, each shark was sexed and a straight-line measure-
ment was taken from the tip of the snout to the fork in the
caudal fin (FL; cm). In the VIMS and NMFS surveys, sharks
were euthanized and a minimum of five vertebral centra were
removed from behind the head just anterior to the origin of the
first dorsal fin (McAuley et al. 2006). Centra collected by the
CSFOP were removed from the anterior section of the “log” or
carcass. Removal of centra from below the first dorsal fin was
not practical for fishery-dependent samples because such action
would reduce the value of the shark at market. Piercy et al.
(2006) showed no difference in band counts for vertebrae taken
from below the first dorsal fin (VIMS samples) and posterior to
the chondocranium (CSFOP and NMFS samples) for Sandbar
Sharks in the WNA; therefore, the use of these vertebrae for
comparison was likely valid. Vertebrae were frozen and sent to
the Virginia Institute of Marine Science.
At the laboratory, the samples were thawed and excess muscle
tissue was removed. The samples were then placed in 75%
ethanol until they could be sectioned. All vertebral centra were
sagitally sectioned through the focus of the centrum using an
isomet rotary diamond saw. Once cut, sections were set to dry
for 24 h and then mounted on microscope slides via cover slip
mounting medium. The samples were progressively wet-sanded
using 300, 400, and 600 fine grit sandpaper until light was
readily transmitted through them and the band pairs were readily
distinguishable on a dissection microscope.
Maturity was assessed for both male and female sharks.
Males were classified as mature if their claspers were deemed
fully calcified (i.e., hard) and could be rotated forward (Clark
and von Schmidt 1965; Driggers et al. 2004). The maturity sta-
tus of females was determined by examination of oviducal gland
size and uterus width and appearance (Castro 1993b). Pregnant
and postpartum females were classified as mature.
Data analyses.—Band pairs were considered an opaque zone
combined with a wider translucent zone in the corpus calcareum
that may or may not continue across the intermedialia (Sminkey
and Musick 1995; Andrews et al. 2011). The birthmark was
determined as the first thin opaque band that intersected the
inflection, or change in angle, of the corpus calcareum (Casey
et al. 1985; Cailliet and Goldman 2004; Cailliet et al. 2006). The
formation of annual growth bands up to 12 years of age has been
validated for Sandbar Sharks in the WNA from mark–recapture
and bomb-radiocarbon aging, so we assumed annual formation
(Andrews et al. 2011).
Mounted vertebral sections were examined for age using
a dissecting microscope and a video imaging system. Verte-
brae were read independently by two readers. Samples were
assigned ages without knowledge of the size or sex of the shark.
Age estimates for vertebrae that were not consistent between
readers were reexamined by both readers until a consensus was
reached. The consensus estimate was used in the final analysis.
If a consensus age estimate could not be reached, the sample
was removed from the study (Cailliet and Goldman 2004). Age
was considered to be the total number of band pairs present after
the birth mark.
Indices of precision were employed to determine how vari-
able the readers were when assigning ages. The percent agree-
ment (PA) between readers and the PA ± 1 year were determined
by dividing the number of assessed ages agreed upon by the to-
tal number of vertebrae examined (Cailliet and Goldman 2004;
Goldman 2005). A Bowker and McNemar χ
2
test of symmetry
was used to test for systematic reader bias in the assessment of
age (Hoenig et al. 1995; Evans and Hoenig 1998).
We fitted two forms of the von Bertalanffy growth model to
length-at-age data for males, females, and both sexes combined
(von Bertalanffy 1938; Beverton and Holt 1957; Cailliet et al.
2006). The first form of the model (VB2; Fabens 1965) used
192 ROMINE ET AL.
the length-at-birth intercept rather than a theoretical age at zero
length and is represented as
L
t
= L
∞
− (L
∞
− L
0
)e
−kt
,
where L
t
is length at age t, L
∞
is the asymptotic length, L
0
is
the length at birth, and k is the growth coefficient. The value
of L
0
was estimated from observed at-term embryos and free-
swimming young-of-the-year sharks to be 51 cm FL. The second
form, a three-parameter von Bertalanffy model (VB3; von
Bertalanffy 1938) incorporating the x-intercept (t
0
) is repre-
sented as
L
t
= L
∞
1 − e
−k(t −t
0
)
.
All model parameters were estimated using nonlinear least
squares and the Gauss–Newton algorithm in R (R Develop-
ment Core Team 2011). Final model selection was based on the
Akaike information criterion corrected for small sample size
(AIC
c
; Akaike 1973) and mean square error (MSE; Carlson and
Baremore 2005). All models were fit to data sets individually
(VIMS1983 and VIMS2004) to assess parameter estimates for
each time period.
Temporal comparisons between models and model parame-
ters were made using likelihood ratio tests (LRTs; Kimura 1980;
Haddon 2001). For this purpose, the data sets were constrained
to the lowest maximum age for each data set comparison
(Haddon 2001). This was done to remove the potential bias
caused by different values of L
∞
. For example, if the compared
data sets had different maximum ages, the data set with the
greater maximum age was truncated to the maximum age of the
other data set. The best fit model was then refitted to the trun-
cated data set. These models were then compared using LRTs.
In this manner we were able to compare growth over identical
age ranges rather than complete growth curves (Haddon 2001).
One assumption of LRTs is homogeneity of variance be-
tween data sets; for this reason, Bartlett’s test was used to assess
the homogeneity of variance between comparison groups in R
(R Development Core Team 2011). Model error was assumed
to be independent, normally distributed, and homoscedastic. A
Shapiro–Wilk test was used to test the assumption of normal-
ity. Residual errors were evaluated by examining plots of the
residuals for systematic errors.
Age-based maturity ogives were developed for male and fe-
male sharks from all time periods for which data were available.
Trippel and Harvey (1991) suggested the use of maximum like-
lihood or probit analysis to estimate the age at which 50% of
the population is mature (A50) in populations in which there
are successive increases in the proportion of mature fish with
increasing age. We used maximum likelihood (ML) methods to
estimate A50 from binomial maturity data (0 = immature, 1 =
mature). This method takes into account the sample size within
each age-class. The negative log-likelihood function that was
minimized was
− ln
(
ML
)
=
j
n ·
j
ln
1 + e
(
−b
∗
(
j−A50
))
−1
+ (N
j
− n
j
) · ln
1 −
1 + e
(
−b
∗
(
j−A50
)
)
−1
,
where n
j
= is the number of mature fish in age-class j, N
j
= the
total number of fish in age-class j, and b = the instantaneous
rate of fish maturation. Both A50 and b were estimated by min-
imizing the negative log-likelihood using AD Model Builder.
Bias-corrected 95% confidence intervals were constructed us-
ing bootstrap methods of estimation (Haddon 2001). Confidence
intervals were only estimated for the A50 value, and the steep-
ness parameter (b) was held to the value estimated from the
initial fit of the model.
RESULTS
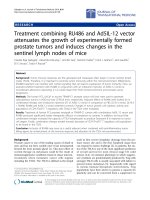
During the period 1980–1983 (VIMS1983 data set), 247
Sandbar Sharks were sampled, 177 females and 70 males
(Figure 1). The oldest estimated age for a female shark was
28 years (at a length of 162 cm FL). Lengths for females ranged
from 59 to 179 cm FL, with an average of 103.7 cm (SD =
41.1; Figure 1A). Lengths for males ranged from 46 to 161 cm
FL, with an average of 73.5 cm (SD = 29.8; Figure 1B). The
oldest estimated age for a male Sandbar Shark was 20 years
(161 cm FL). The average ages for females and males were 7.3
and 2.7 years, respectively.
Over the period 2000–2004 (VIMS2004 data set), 449
Sandbar Sharks were sampled. Of these, 247 were females
ranging in length from 44 to 180 cm FL and 202 were males
ranging from 46 to 167 cm FL (Figure 1). The average FL for
females was 102.5 cm (SD = 35.6), and that for males was
96.5 cm (SD = 36.3). The oldest estimated age for females was
27 years at a length of 180 cm. The oldest estimated age for
males was 22 years and was assigned to a 156 cm shark and
a 162 cm shark. The average ages for females and males were
6.33 and 5.53 years, respectively.
The ages estimated by readers were consistent for all three
data sets. The percent agreement (PA) for the VIMS1983 sam-
ples was 51%. Reader estimates were within 1 year of each
other for 86% of the samples and within 2 years for 93% of
the samples. For the VIMS2004 data set, PA was 71%. Reader
estimates were within 1 year of each other for 95% of the sam-
ples and within 2 years for 98% of the samples. Between-reader
contingency tables for the VIMS1983 and VIMS2004 data sets
revealed that the differences between readers were due to ran-
dom error rather than systematic error (χ
2
= 53.13, df = 42,
P = 0.12 and χ
2
= 51.00, df = 36, P = 0.05, respectively).
The bias between and among readers for all data sets was not
systematic; however, older fish (>25 years) led to more error
between readers for both data sets (Figure 2).
Based on MSE and AIC values, the VB3 model provided
the best fit for males and females for the VIMS1983 data set
COMPENSATORY GROWTH OF THE SANDBAR SHARK 193
FIGURE 1. Length frequencies of (A) female and (B) male Sandbar Sharks
from the VIMS1983 and VIMS2004 data sets.
(Table 1). The VB3 model produced higher estimates of L
∞
and lower estimates of k than the VB2 model, indicating that
the VB2 model underestimated the asymptotic length while
overestimating growth rates (Figures 3A, 4A, 5). Similarly, the
VB3 model provided the best fit for the VIMS2004 male and
female data sets (Table 1). Model outputs from the VB2 model
were similar, but L
∞
values were slightly underestimated when
compared to empirical length data (Figures 3B, 4B, and 5).
To compare temporal differences, the data sets were
constrained to the lowest maximum age for each data set
comparison (Haddon 2001). Thus, the VIMS2004 data set was
truncated to a maximum age of 20 for males and a maximum
age of 27 for females. The VB3 model was refit to the truncated
data (Table 2). In this way we were able to compare growth over
identical age ranges. The assumption of homogeneous variances
was not violated at the 0.01 level (females: K
2
= 4.20, df = 1,
FIGURE 2. Age bias plots for readers 1 and 2 for the VIMS1983 (upper panel)
and VIMS2004 (lower panel) data sets. In each panel the solid line has slope of
1 and an intercept of 0, representing no bias between readers.
P = 0.041; males: K
2
= 3.73, df = 1, P = 0.054). The models
were then compared using likelihood ratio tests. These likeli-
hood ratio tests revealed significant differences between the VB3
models for females between the VIMS1983 and VIMS2004 data
sets (χ
2
= 25.06, df = 3, P < 0.001); comparison of the VB3
models for males revealed significant differences between those
models as well (χ
2
= 22.75, df = 3, P < 0.001) (Table 3).
The significant difference in the growth models for fe-
males between the two time periods was primarily driven by
194 ROMINE ET AL.
TABLE 1. Model fits for all data sets and both sexes. The values in parentheses are the lower and upper 95% confidence limits; AIC
c
= AIC corrected for small
sample size, MSE = mean square error, and NA = not applicable.
Data set Model L
∞
kt
0
AIC
c
AIC
c
MSE n
VIMS1983
Females VB3 188.26
(180.57, 197.66)
0.084
(0.07, 0.10)
−4.078
(−4.54, −3.67)
1,207.40 0 51.3 177
VB2 183.10
(176.63, 190.62)
0.094
(0.08, 0.10)
NA 1,218.89 11.49 55.38 177
Males VB3 164.17
(153.54, 178.53)
0.109
(0.09, 0.13)
−3.612
(−4.2, −3.13)
437.51 0 26.92 70
VB2 160.18
(150.49, 172.53)
0.122
(0.10, 0.15)
NA 444.56 7.05 30.71 70
Sexes combined VB3 186.29
(179.63, 194.17)
0.086
(0.08, 0.1)
−4.02
(−4.38, −3.7)
1,655.49 0 46.14 247
VB2 181.28
(175.57, 187.8)
0.095
(0.09, 0.1)
NA 1,674.86 19.37 50.32 247
VIMS2004
Females VB3 178.14
(173.97, 182.83)
0.107
(0.10, 0.12)
−3.397
(−3.71, −3.11)
1,596.33 0 36.31 247
VB2 174.88
(171.42, 178.60)
0.117
(0.11, 0.12)
NA 1,606.33 10 38.13 247
Males VB3 173.52
(168.68, 179.18)
0.113
(0.10, 0.12)
−3.323
(−3.67, −3.01)
1,322.71 0 39.25 202
VB2 169.83
(165.85, 174.20)
0.125
(0.12, 0.13)
NA 1,333.14 10.43 41.76 202
Sexes combined VB3 176.47
(173.22, 180.02)
0.108
(0.1, 0.12)
−3.387
(−3.62, −3.17)
2,912.33 0 37.73 449
VB2 172.88
(170.22, 175.69)
0.120
(0.11, 0.13)
NA 2,936.26 23.93 39.98 449
differences in the estimated growth coefficient, k (χ
2
= 12.97,
df = 1, P < 0.001). The difference between the estimates
of L
∞
and t
0
were also significant, though to a lesser extent
(χ
2
= 7.55, df = 1, P = 0.006 and (χ
2
= 8.60, df = 1, P =
0.003, respectively). The difference in the growth models for
males was driven by small differences in all model parameters;
no individual parameters were significantly different between
the time periods. The assumption of normally distributed error
was not violated, and skew and kurtosis were minimal for all
model fits. There were no significant differences in variance
between the VIMS1983 and VIMS2004 data sets for females
(χ
2
= 4.01, df = 1, P = 0.045) or males between the two time
periods (χ
2
= 3.35, df = 1, P = 0.067). However, empirically
it can be seen that the estimate of the growth coefficient for
females was greater for the VIMS2004 data set, while that of
L
∞
was lower. For males, the L
∞
value was greater than for the
VIMS1983 data, as was the k value.
Maturity ogives were only generated for female sharks due to
the paucity of mature males in the VIMS1983 data set. Maturity
was determined for 179 female sharks with associated vertebral
centra from the VIMS1983 data. Of these, the smallest mature
shark was 142 cm FL and was estimated to be 16 years old. The
TABLE 2. Model fits for constrained data sets for both male and female sharks used for temporal comparisons. See Table 1 for additional information.
Data set Model Maximum age L
∞
kt
0
VIMS1983
Females VB3 27 190.89 (182.45, 201.43) 0.081 (0.07, 0.09) −4.166 (−4.65, −3.74)
Males VB3 20 164.17 (153.54, 178.53) 0.109 (0.09, 0.13) −3.612 (−4.20, −3.13)
VIMS2004
Females VB3 27 178.14 (173.97, 182.83) 0.107 (0.10, 0.12) −3.397 (−3.71, −3.1)
Males VB3 20 174.29 (169.12, 180.37) 0.111 (0.10, 0.12) −3.348 (−3.71, −3.03)
COMPENSATORY GROWTH OF THE SANDBAR SHARK 195
FIGURE 3. VB3 model fits and length-at-age data for female Sandbar Sharks
from the (A) VIMS1983 and (B) VIMS2004 data sets.
largest immature shark was 151 cm and was also estimated to
be 16 years old. Maturity was determined for 192 female sharks
from the VIMS2004 data set. Of these, the smallest mature shark
was 145 cm and was estimated to be 11 years old. The largest
immature shark was 147 cm and was estimated to be 13 years of
age. The estimate of A50 for female sharks was 15.06 years of
age from the VIMS1983 data set and 12.49 years of age from the
VIMS2004 data set (Figure 6). The length at 50% maturity for
females was 152 and 145 cm FL for VIMS1983 and VIMS2004
TABLE 3. Results for likelihood ratio tests in temporal comparisons between
data sets (VIMS1983 versus VIMS2004) for male and female Sandbar Sharks.
Sex χ
2
df P-value
Female 25.06 3 <0.001
Male 22.75 3 <0.001
FIGURE 4. VB3 model fits and length-at-age data for male Sandbar Sharks
from the (A) VIMS1983 and (B) VIMS2004 data sets.
samples, respectively; this difference was found to be significant
(F = 7.27, P = 0.0001).
DISCUSSION
We have shown a significant change in the von Berta-
lanffy growth parameters for the Sandbar Shark in the west-
ern North Atlantic Ocean between the time periods 1980–
1983 (VIMS1983 data set) and 2000–2004 (VIMS2004 data
set). The growth parameter estimates suggested a greater
asymptotic length and lower k value for female sharks when
based on the VIMS1983 data set than when based on the
VIMS2004 data set (Table 1). Few studies have shown sig-
nificant changes in growth among K-selected species (Sminkey
and Musick 1995; Carlson and Baremore 2003; Sosebee 2005;
Cassof et al. 2007). This is the fourth study involving elas-
mobranchs to demonstrate changes in growth rates following
exploitation.
196 ROMINE ET AL.
FIGURE 5. Comparison of the results of the VB3 growth model when fit-
ted to the VIMS1983 and VIMS2004 data sets for (A) female and (B) male
Sandbar Sharks. The circles represent the lower and upper estimates of bomb-
radiocarbon–validated age–length data for Sandbar Sharks from the WNA
(Andrews et al. 2011). A single circle signifies that a single age was given
for that sample. Two circles connected with a bar represent the range for a
single sample. An arrow signifies that no upper estimate was given.
Most of the animals in the VIMS1983 and VIMS2004 data
sets were landed with identical gear within the same locations.
Some sharks from the more recent time period were landed
using smaller hooks (9/0 J versus 12/0 circle) with monofilament
leaders on the same braided nylon mainline. Samples were also
collected by gill nets, recreational gear, and trawl nets for the
FIGURE 6. Ogives fitted to Sandbar Shark female maturity data for the
VIMS1983 and VIMS2004 data sets using maximum likelihood estimation.
VIMS2004 data set. These samples comprised less than 1% of
the data set, however. This was also the case for the VIMS1983
data set. At-term pups were included in the VIMS1983 data
set to account for a lack of neonates within that sample set.
Katsanevakis (2006) and Thorson and Simpfendorfer (2009)
suggested using multimodel inference to cope with issues of
gear selectivity in order to derive more accurate estimates of
growth parameters. However, given AIC
c
values close to or
greater than 10, model averaging resulted in parameter estimates
that were almost identical to the best-fit model estimates for all
data sets. In addition, we found that the length distributions of
both time periods were homogenous and that each size-class
comprised approximately similar proportions of the entire data
set (Figure 1).
The oldest vertebral centra–based age of Sandbar Sharks
from this study was 27 years, which is similar to the maximum
estimated age of 25 years from Sminkey and Musick (1995) in
the WNA. However, based on our age estimations it is not unrea-
sonable to assume that Sandbar Sharks have longevities much
greater than 30 years. A recent study using bomb-radiocarbon
dating of Sandbar Shark vertebrae indicated that this species is
longer-lived than previously thought and suggested that in some
older animals age may be underestimated when it is determined
by growth band counting in vertebrae (Andrews et al. 2011).
Based on a sample size of four, Andrews et al. (2011) found
disagreement between bomb-radiocarbon estimates of age
and growth band estimates for three sharks estimated to be
older than 20 years through bomb-radiocarbon analyses. These
sharks were estimated to be younger than 20 years by growth
band counting following the methods of Casey et al. (1985).
COMPENSATORY GROWTH OF THE SANDBAR SHARK 197
This is understandable given the edge compression of vertebrae
in older sharks and the difficulty of discerning bands in this
compressed region. It should be noted that the study also
validated age determination using growth bands in a shark that
was estimated to be 10.3 years of age by both methods.
Other studies using the same bomb-radiocarbon dating meth-
ods have validated vertebral centra ages for other long-lived
sharks up to 42 years of age (Campana et al. 2002; Passerotti
et al. 2010). However, Francis et al. (2007) reported that the ages
of Porbeagles from New Zealand that were more than 45 years
were underestimated using vertebral centra. The discrepancies
between these studies should be examined further to determine
whether they stem from the methods used, as was the case with
Andrews et al. (2011).
It should be noted that the samples used in Andrews et al.
(2011) were prepared using histological methods, as opposed to
the methods used in this study. In addition, the age estimation
methods that Andrews et al. (2011) used were those described
by Casey et al. (1985), which defined growth bands as light and
dark regions traversing the entire intermedialia and extending
into the corpus calcareum. Andrews et al. (2011) stated that if
they had used the band pairs visible in the corpus calcareum the
ages estimated from the vertebral centra would have been in line
with those estimated through the bomb-radiocarbon analyses
and suggested that the aging method used by Casey et al. (1985)
is only reliable up to age 12.
Be that as it may, Andrews et al. (2011) suggested that the
longevity of Sandbar Sharks in the WNA was probably greater
than 30 years prior to the expansion of the shark fishery in
the early 1980s. Casey and Natanson’s (1992) revision of ear-
lier age and growth estimates (Casey et al. 1985) using tag–
recapture data found that tagged Sandbar Sharks in the U.S.
Atlantic Ocean were at liberty for over 20 years and suggested
a longevity of over 50 years. In addition, they suggested that
maturity is not attained until 30 years of age, an extreme con-
trast to the estimates (12–13 years) presented by Baremore and
Hale (2012) and our estimate for females (12.49 years). In the
current study, poor band elucidation at the margins may have
led to underestimation of counts or ages for some of the largest
sharks sampled.
Our growth estimates are generally similar to those reported
by Sminkey and Musick (1995), but our estimates present a
stark departure from those estimated by Casey et al. (1985).
The von Bertalanffy model estimates from this study for males
were k = 0.050/year, L
∞
= 257 cm FL, and t
0
=−4.5; those
for females were k = 0.040/year, L
∞
= 299 cm FL, and t
0
=−4.9. The values of L
∞
estimated by Casey et al. (1985)
are unrealistic given the empirical data. In addition, the growth
coefficients are roughly half of our current estimates. Romine
(2008) used mark–recapture data and length-based models to
estimate growth parameters for Sandbar Sharks in the WNA.
That study estimated L
∞
to be 209 cm FL and k to be 0.077 for
both sexes combined, which entails a smaller growth coefficient
and a larger asymptotic length than our model fits for both
sexes combined over both time periods (Table 1). However,
caution should be taken with estimates based on tag–recapture
data because the variability in the growth of tagged fish is not
comparable to the variability associated with length-at-age data
and should not be used to verify length-at-age data (Francis
1988).
Wehave found changes in the parameters of the growth model
for Sandbar Sharks in the WNA between the periods 1980–1983
and 2000–2004 that indicate slightly faster growth. We also
have found a decrease in the value of A50 for female Sandbar
Sharks between the two time periods. However, these revised
estimates still depict a fish that is slow growing and susceptible
to overfishing. Age-at-length studies should be continued to
monitor the status of this population and to provide managers
with updated and accurate life history parameters for use in
future stock assessments.
ACKNOWLEDGMENTS
The authors would like to thank the many brave volunteers
aboard the RV Bay Eagle and its captain, Durand Ward, for their
hours of assistance during VIMS longline research cruises. The
authors would also like to thank the observers for sampling in
tough conditions to make this study happen and especially ob-
server coordinator S. Gulak. Comments provided by Lori Hale,
Ivy Baremore, and two anonymous reviewers greatly improved
this manuscript.
REFERENCES
Akaike, H. 1973. Information theory as an extension of the maximum likeli-
hood principle. Pages 267–281 in B. N. Petrov and F. Csaki, editors. Second
international symposium on information theory, Akademiai Kiado, Budapest.
Andrews, A. H., L. J. Natanson, G. H. Burgess, and G. M. Cailliet. 2011.
Bomb radiocarbon and tag-recapture dating of Sandbar Shark (Carcharhinus
plumbeus). U.S. National Marine Fisheries Service Fishery Bulletin 109:454–
465.
Baremore, I. E., and L. F. Hale. 2012. Reproduction of the Sandbar Shark in
the western North Atlantic Ocean and Gulf of Mexico. Marine and Coastal
Fisheries: Dynamics, Management, and Ecosystem Science [online serial]
4:560–572.
Beverton, R. J. H., and S. J. Holt. 1957. On the dynamics of exploited fish
populations. Ministry of Agriculture, Fisheries and Food Fishery Investiga-
tion Series, Series 2, volume 19. UK Ministry of Agriculture and Fisheries,
London.
Bigelow, H. B., and W. C. Schroeder. 1948. Sharks. Pages in C. M. B. J. Tee-
Van, S. F. Hildebrand, A. E. Parr, and W. C. Schroeder, editor. Fishes of
the western North Atlantic, part 1, volume 1. Sears Foundation for Marine
Research, Yale University, New Haven, Connecticut.
Boyce, M. S. 1979. Seasonality and patterns of natural selection for life histories.
American Naturalist 114:569–583.
Cailliet, G. M., and K. J. Goldman. 2004. Age determination and validation in
chondrichthyan fishes. Pages 399–447 in J.Carrier,J.A.Musick,andM.
Heithaus, editor. The biology of sharks and their relatives, CRC Press, Boca
Raton, Florida.
Cailliet, G. M., W. D. Smith, H. F. Mollet, and K. J. Goldman. 2006. Age and
growth studies of chondrichthyan fishes: the need for consistency in termi-
nology, verification, validation, and growth function fitting. Environmental
Biology of Fishes 77:211–228.
198 ROMINE ET AL.
Campana, S. E., L. J. Natanson, and S. Myklevoll. 2002. Bomb dating and
age determination of large pelagic sharks. Canadian Journal of Fisheries and
Aquatic Sciences 59:450–455.
Carlson, J. K., and I. E. Baremore. 2003. Changes in biological parameters of
Atlantic Sharpnose Shark Rhizoprionodon terraenovae in the Gulf of Mexico:
evidence for density-dependent growth and maturity? Marine and Freshwater
Research 54:227–234.
Carlson, J. K., and I. E. Baremore. 2005. Growth dynamics of the Spinner
Shark (Carcharhinus brevipinna) off the United States southeast and Gulf
of Mexico coasts: a comparison of methods. U.S. National Marine Fisheries
Service Fishery Bulletin 103:280–291.
Casey, J. G., and L. J. Natanson. 1992. Revised estimates of age and growth of
the Sandbar Shark (Carcharhinus plumbeus) from the western North Atlantic.
Canadian Journal of Fisheries and Aquatic Sciences 49:1474–1477.
Casey, J. G., H. L. Pratt Jr., and C. E. Stillwell. 1985. Age and growth of the
Sandbar Shark (Carcharhinus plumbeus) from the western North Atlantic.
Canadian Journal of Fisheries and Aquatic Sciences 42:963–975.
Cassof, R. M., S. E. Campana, and S. Myklevoll. 2007. Changes in the base-
line growth and maturation parameters of the northwest Atlantic Porbeagle,
Lamna nasus, following heavy exploitation. Canadian Journal of Fisheries
and Aquatic Sciences 64:19–29.
Castro, J. I. 1993a. The shark nursery of Bulls Bay, South Carolina, with a
review of the shark nurseries of the southeastern coast of the United States.
Environmental Biology of Fishes 38:37–48.
Castro, J. I. 1993b. The biology of the Finetooth Shark, Carcharhinus isodon.
Environmental Biology of Fishes 36:219–232.
Clark, E., and K. von Schmidt. 1965. Sharks of the central Gulf coast of Florida.
Bulletin of Marine Science 15:13–83.
Clarke, C. H. D. 1949. Fluctuations in populations. Journal of Mammalogy
30:21–25.
Compagno, L. J. V. 1984. Sharks of the world: an annotated and illustrated
catalogue of shark species known to date. FAO (Food and Agriculture Orga-
nization of the United Nations) Fisheries Synopsis 125.
Conrath, C. L. 2005. Reproductive biology. Pages 103–127 in J. A. Musick and
R. Bonfil, editors. Management techniques for elasmobranch fisheries. Food
and Agriculture Organization of the United Nations, Rome.
Cort
´
es, E. 2000. Life history patterns and correlations in sharks. Reviews in
Fisheries Science 8:299–344.
Driggers, W. B. III, J. K. Carlson, B. Cullum, J. M. Dean, D. Oakley, and
G. Ulrich. 2004. Age and growth of the Blacknose Shark, Carcharhinus
acronotus, in the western North Atlantic Ocean with comments on regional
variation in growth rates. Environmental Biology of Fishes 71:171–178.
Evans, G. T., and J. M. Hoenig. 1998. Testing and viewing symmetry in contin-
gency tables, with application to readers of fish ages. Biometrics 54:620–629.
Fabens, A. J. 1965. Properties and fitting of the von Bertalanffy growth curve.
Growth 29:265–289.
Fowler, C. W. 1981. Density dependence as related to life history strategy.
Ecology 62:602–610.
Francis, M. P., S. E. Campana, and C. M. Jones. 2007. Age under-estimation
in New Zealand Porbeagle Sharks (Lamna nasus): is there an upper limit to
ages that can be determined from shark vertebrae? Marine and Freshwater
Research 58:10–2.
Francis, R. I. C. C. 1988. Are growth parameters from tagging and age–
length data comparable? Canadian Journal of Fisheries and Aquatic Sciences
45:936–942.
Garrick, J. A. F. 1982. Sharks of the genus cacharhinus. NOAA Technical
Report NMFS 445.
Goldman, K. J. 2005. Age and growth of elasmobranch fishes. Pages 76–103 in J.
A. Musick and R. Bonfil, editors. Management techniques for elasmobranch
fisheries. Food and Agriculture Organization of the United Nations, Rome.
Goodwin, N. B., N. K. Dulvy, and J. D. Reynolds. 2002. Life-history correlates
of the evolution of live bearing in fishes. Philosophical Transactions of the
Royal Society of London Series B (Biological Sciences) 357:259–267.
Haddon, M. 2001. Modelling and quantitative methods in fisheries. Chapman
and Hall, CRC Press, Boca Raton, Florida.
Hayward, R. S., D. B. Noltie, and N. Wang. 1997. Use of compensatory growth
to double hybrid sunfish growth rates. Transactions of the American Fisheries
Society 126:316–322.
Heist, E. J., J. E. Graves, and J. A. Musick. 1995. Population genetics of the
Sandbar Shark (Carcharhinus plumbeus) in the Gulf of Mexico and Mid-
Atlantic Bight. Copeia 1995:555–562.
Henwood, T., W. Ingram, and M. Grace. 2004. Shark/snapper/grouper long-
line surveys. National Marine Fisheries Service, Southeast Fisheries Science
Center, SEDAR7-DW-8, Miami.
Hilborn, R., and C. J. Walters. 1992. Quantitative fisheries stock assessment:
choice, dynamics and uncertainty. Chapman and Hall, London.
Hoenig, J., M. Morgan, and C. Brown. 1995. Analyzing differences between
two age determination methods by tests of symmetry. Canadian Journal of
Fisheries and Aquatic Sciences 52:364–368.
Jensen, A. L. 1991. Simulation of fish population responses to exploitation.
Ecological Modelling 55:203–218.
Katsanevakis, S. 2006. Modelling fish growth: model selection, multi-model
inference and model selection uncertainty. Fisheries Research 81:229–
235.
Kimura, D. K. 1980. Likelihood methods for the von Bertalanffy growth
curve. U.S. National Marine Fisheries Service Fishery Bulletin 77:765–
776.
Kohler, N. E., J. G. Casey, and P. A. Turner. 1998. NMFS cooperative shark
tagging program, 1962–93: an atlas of shark tag and recapture data. Marine
Fisheries Review 60:1–87.
Lawler, E. F. 1976. The biology of the Sandbar Shark,
Carcharhinus
plumbeus, (Nardo, 1827) in the lower Chesapeake Bay and adjacent wa-
ters. Master’s thesis. The College of William and Mary, Williamsburg,
Virginia.
MacArthur, R., and E. Wilson. 1967. The theory of biogeography, 13th edition.
Princeton University Press, Princeton, New Jersey.
McAuley, R. B., C. A. Simpfendorfer, G. A. Hyndes, R. R. Allison, J. A.
Chidlow, S. J. Newman, and R. C. J. Lenanton. 2006. Validated age and
growth of the Sandbar Shark, Carcharhinus plumbeus (Nardo 1827) in the
waters off Western Australia. Environmental Biology of Fishes 77:385–
400.
Merson, R. 1998. Nursery grounds and maturation of the Sandbar Shark in the
western North Atlantic. Doctoral dissertation. University of Rhode Island,
Kingston.
Morgan, A., P. Cooper, T. Curtis, and G. Burgess. 2009. Overview of the U.S.
East Coast bottom longline shark fishery, 1994–2003. Marine Fisheries Re-
view 71:23–38.
Musick, J. A., and J. A. Colvocoresses. 1986. Seasonal recruitment of sub-
tropical sharks in the Chesapeake Bight, USA. Pages 301–311 in A. Yanez-
Aracibia, and D. Pauley, editor. IOC/FAO workshop on recruitment in tropical
coastal demersal communities. Intergovernmental Oceanographic Commis-
sion, Workshop Report 44, Campeche, Mexico.
NMFS (National Marine Fisheries Service). 1993. Fishery management plan
for sharks of the Atlantic Ocean. National Oceanic and Atmospheric
Administration/NMFS, Silver Spring, Maryland.
NMFS (National Marine Fisheries Service). 2008. Final Amendment 2 to the
Consolidated Atlantic Highly Migratory Species Fishery Management Plan.
National Oceanic and Atmospheric Administration, Office of Sustainable
Fisheries, Highly Migratory Species Management Division, Silver Spring,
Maryland.
Passerotti, M. S., J. K. Carlson, A. N. Piercy, and S. E. Campana. 2010. Age
validation of great Hammerhead Shark (Sphyrna mokarran), determined by
bomb radiocarbon analysis. U.S. National Marine Fisheries Service Fishery
Bulletin 108:346–351.
Piercy, A., T. Ford, L. Levy, and F. Snelson. 2006. Analysis of variability in
vertebral morphology and growth ring counts in two Carcharhinid sharks.
Environmental Biology of Fishes 77:401–406.
R Development Core Team. 2011. R: A language and environment for statisti-
cal computing. R Foundation for Statistical Computing, Vienna. Available:
./ (April 2013).
COMPENSATORY GROWTH OF THE SANDBAR SHARK 199
Romine, J. G. 2008. Age, growth, and demography of the Sandbar Shark, Car-
charhinus plumbeus, over temporal and spatial scales. Doctoral dissertation.
College of William and Mary, Williamsburg, Virginia.
Rose, K. A., J. H. Cowan, K. O. Winemiller, R. A. Myers, and R. Hilborn.
2001. Compensatory density dependence in fish populations: importance,
controversy, understanding and prognosis. Fish and Fisheries 2:293–327.
SEDAR(Southeast Data Assessment and Review). 2006. SEDAR11 stock as-
sessment report: large coastal shark complex, Blacktip and Sandbar shark.
National Oceanic and Atmospheric Administration, NMFS, Office of Sus-
tainable Fisheries, Highly Migratory Species Management Division, Silver
Spring, Maryland.
SEDAR(Southeast Data Assessment and Review). 2010. SEDAR21 stock as-
sessment report: HMS Sandbar Shark. SEDAR, North Charleston, South
Carolina.
Sminkey, T. R., and J. A. Musick. 1995. Age and growth of the Sandbar
Shark, Carcharhinus plumbeus, before and after population depletion. Copeia
1995:871–883.
Sminkey, T. R., and J. A. Musick. 1996. Demographic analysis of the Sandbar
Shark, Carcharhinus plumbeus, in the western North Atlantic. U.S. National
Marine Fisheries Service Fishery Bulletin 94:341–347.
Sosebee, K. 2005. Are density-dependent effects on elasmobranch matu-
rity possible? Journal of Northwest Atlantic Fishery Science 35:115–
124.
Springer, S. 1960. Natural history of the Sandbar Shark, Eulamia milberti. U.S.
National Marine Fisheries Service Fishery Bulletin 61:1–38.
Thorson, J. T., and C. A. Simpfendorfer. 2009. Gear selectivity and sample size
effects on growth curve selection in shark age and growth studies. Fisheries
Research 98:75–84.
Trippel, E. A., and H. H. Harvey. 1991. Comparison of methods used to es-
timated age and length of fishes at sexual maturity using populations of
White Sucker (Catostomous commersoni). Canadian Journal of Fisheries and
Aquatic Sciences 48:1446–1459.
von Bertalanffy, L. 1938. A quantitative theory of organic growth (inquiries on
growth laws. II). Human Biology 10:181–213.