Abundance and distribution of sharks in northeast florida waters and identification of potential nursery habitat
Bạn đang xem bản rút gọn của tài liệu. Xem và tải ngay bản đầy đủ của tài liệu tại đây (552.01 KB, 12 trang )
BioOne sees sustainable scholarly publishing as an inherently collaborative enterprise connecting authors, nonprofit publishers, academic institutions, research
libraries, and research funders in the common goal of maximizing access to critical research.
Abundance and Distribution of Sharks in Northeast Florida Waters and
Identification of Potential Nursery Habitat
Author(s): Michael McCallister, Ryan Ford, and James Gelsleichter
Source: Marine and Coastal Fisheries: Dynamics, Management, and Ecosystem Science, 5():200-210.
2013.
Published By: American Fisheries Society
URL: />BioOne (www.bioone.org) is a nonprofit, online aggregation of core research in the biological, ecological, and
environmental sciences. BioOne provides a sustainable online platform for over 170 journals and books published
by nonprofit societies, associations, museums, institutions, and presses.
Your use of this PDF, the BioOne Web site, and all posted and associated content indicates your acceptance of
BioOne’s Terms of Use, available at www.bioone.org/page/terms_of_use.
Usage of BioOne content is strictly limited to personal, educational, and non-commercial use. Commercial inquiries
or rights and permissions requests should be directed to the individual publisher as copyright holder.
Marine and Coastal Fisheries: Dynamics, Management, and Ecosystem Science 5:200–210, 2013
C
American Fisheries Society 2013
ISSN: 1942-5120 online
DOI: 10.1080/19425120.2013.786002
SPECIAL SECTION: ELASMOBRANCH LIFE HISTORY
Abundance and Distribution of Sharks in Northeast Florida
Waters and Identification of Potential Nursery Habitat
Michael McCallister,* Ryan Ford,
1
and James Gelsleichter
Department of Biology, University of North Florida, 1 UNF Drive, Jacksonville, Florida 32224, USA
Abstract
Sharks are considered top predators in many marine ecosystems and can play an important role in structuring
community ecology. As a result, it is necessary to understand the factors that influence their abundance and distri-
bution. This is particularly important as fishery managers develop management plans for sharks that identify areas
that serve as essential fish habitat, especially nursery habitat. However, our understanding of shark habitat use in
northeast Florida waters is limited. The goal of this study was to characterize the abundance and distribution of sharks
in northeast Florida estuaries and to examine the effect of abiotic factors on shark habitat use. A bottom longline
survey conducted from 2009 to 2011 indicated that 11 shark species use the estuarine waters of northeast Florida
during the summer months. Atlantic Sharpnose Sharks Rhizoprionodon terraenovae, Blacktip Sharks Carcharhinus
limbatus, and Bonnetheads Sphyrna tiburo were the most abundant species and made up 81.4% of the total catch. Site,
month, and bottom water temperature were the most important factors determining the presence and abundance
of sharks and suggest both regional and seasonal variations in the use of northeast Florida waters. Depth, salinity,
and dissolved oxygen were also important factors. Our data show that these waters serve as a nursery for Atlantic
Sharpnose and Blacktip Sharks, with young-of-the-year and juveniles being present in the summer months. Limited
tag–return data reveal that juvenile sharks remain in these waters throughout the summer and that some return in
subsequent summers. This is the first study to characterize the abundance and distribution of sharks and identify
potential nursery areas in northeast Florida estuaries.
Congress’ reauthorization of the Magnuson–Stevens Fishery
Conservation and Protection Act in 1996 affirmed the widely ac-
cepted notion that essential fish habitat (EFH) plays a critical
role in the life history of many marine organisms. According
to the act, EFH is defined as “those waters and substrate nec-
essary to fish for spawning, feeding, breeding, or growth to
maturity” and should include habitats used at any portion of the
species’ life cycle (Magnuson–Stevens Fishery and Conserva-
tion Act 1996). Of particular importance in their role as EFH
are nearshore estuarine and marine ecosystems (e.g., seagrass
meadows, marshes, and mangroves) that serve as nursery habi-
tats, providing a selective advantage for juveniles. For sharks,
this may include increased prey abundance and decreased risk
Subject editor: Eric Hoffmayer, Southeast Fisheries Science Center, Pascagoula, Mississippi
*Corresponding author:
1
Present address: Florida Fish and Wildlife Conservation Commission, Marine Science Research Institute, Jacksonville University, 2800
University Boulevard North, Jacksonville, Florida 32211, USA.
Received October 10, 2012; accepted March 7, 2013
of predation (Branstetter 1990; Castro 1993), both of which
would have obvious benefits for survival and overall population
growth.
The shark nursery concept was first put forth by Springer
(1967), who described shark nurseries as discrete parts of a
species’ range where parturition occurs and/or juvenile sharks
spend the early part of their lives. Shark nurseries were fur-
ther defined by Bass (1978) by distinguishing between primary
and secondary nurseries. According to Bass’ definition, primary
nursery habitats are those areas where young sharks are born and
spend up to the first year of their life, while secondary nursery
habitats are where slightly older but not yet mature individuals
occur. Although these definitions have been well accepted, and
200
ABUNDANCE AND DISTRIBUTION OF SHARKS 201
the concept of shark nursery habitat is well established, clear
criteria that can be used to identify nursery areas have been
lacking. However, more recently, the shark nursery concept was
reexamined by Heupel et al. (2007), who proposed a definition
with three criteria that could be used to quantitatively identify
shark nursery habitat: (1) juvenile sharks are more commonly
encountered in these areas than in others, (2) juvenile sharks
will remain or return to these areas over an extended period of
time, and (3) the areas will be utilized repeatedly across years.
These criteria have provided researchers with a clearer set of
end points for characterizing habitat use in juvenile sharks.
Concern about the susceptibility of shark populations to over-
fishing (FAO 2000) has prompted U.S. fishery managers to
develop specific fishery management plans (FMPs) for sharks
(NMFS 1999, 2003, 2006). A critical component of these man-
agement plans is the identification of EFH (NMFS 1999). Rec-
ognizing the importance of nursery habitat to the success of
shark populations, fishery managers have developed FMPs that
require the identification and delineation of suitable nursery
habitat. This has resulted in numerous ongoing and detailed
studies examining the presence of shark nurseries in most of
the major estuaries along the Atlantic and Gulf coasts of the
United States (see McCandless et al. 2007). However, close ex-
amination of the scientific literature reveals a noticeable gap in
knowledge regarding shark habitat along the East Coast. Specifi-
cally, there have been no studies examining the presence of shark
nursery habitat in northeast Florida.
In 2009, the University of North Florida established an an-
nual shark abundance survey to examine shark populations in the
coastal and estuarine waters from the Florida–Georgia border
to St. Augustine, Florida. The goal of this project was to gather
critical data on the use of northeast Florida’s nearshore and estu-
arine waters as shark nursery habitat. Using data collected from
2009 to 2011, this paper characterizes the abundance and distri-
bution of sharks in two northeast Florida estuaries, Cumberland
Sound and Nassau Sound, and identifies EFH for juvenile sharks
within these estuaries.
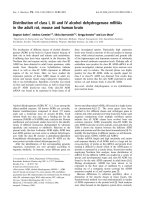
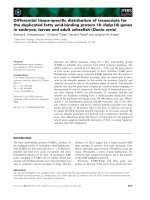
STUDY SITE
Cumberland and Nassau sounds are located in northeast
Florida (Figure 1) on the northern and southern boundaries of
Nassau County, respectively, and are part of the Nassau–St.
Mary’s water basin. Cumberland Sound is located at the mouth
of the St. Mary’s River between Cumberland Island, Georgia,
and Amelia Island, Florida. Nassau Sound is situated between
Amelia Island and Big Talbot Island at the confluence of
Sister’s Creek and the Nassau and Amelia rivers. Both of these
estuaries can be considered healthy, with the last water quality
assessment of the Nassau–St. Mary’s water basin classifying
the bodies of water that feed into Cumberland Sound as
class III surface waters (suitable for maintaining a healthy,
well-balanced population of fish and wildlife) and those that
FIGURE 1. Aerial photograph of the (A) Cumberland Sound and (B) Nassau
Sound study sites in northeast Florida. Grey circles show the locations of all
longline sets from 2009 to 2011.
enter Nassau Sound as class II surface waters (suitable for
shellfish harvest and propagation) (FLDEP 2007).
METHODS
Sampling.—Longline sampling was conducted in the
nearshore and estuarine waters of Cumberland and Nassau
sounds (Figure 1) from late April through November using
bottom longline fishing. Weekly sampling occurred from May
to August each year. During April, September, October, and
November, each region was sampled only twice a month due
to time and weather constraints. The longline consisted of a
single 300-m #8 braided nylon mainline, anchored at both
ends and marked with two buoys, containing 50 gangions, each
composed of a 1-m, 90-kg test monofilament leader, size 120
stainless steel longline snap, 4/0 swivel, and a 12/0 barbless
circle hook baited with Atlantic Mackerel Scomber scombrus.
Initially, the sets were allowed to soak for 1 h; however, after
the second week the soak time was reduced to 30 min to better
minimize animal mortality. Five to six sets were fished each
day, and the location of each set was selected haphazardly.
Environmental data were collected at each sampling location
after the longline was set. Bottom water temperature (
◦
C),
202 MCCALLISTER ET AL.
salinity (‰), and dissolved oxygen (mg/L) were measured
using an YSI-85 (YSI, Inc., Yellow Springs, Ohio). Water depth
(m) was recorded at the beginning and end of each set. The
mean depth for each set was calculated and used in all analyses.
All sharks caught during the survey were identified to species,
and relevant biological data, including sex, length (cm), weight
(kg), life stage, and umbilical scar status were recorded. Length
measurements were taken for precaudal length (PCL), FL, TL,
and stretched total length (STL). Life stage was classified as
either young of the year (age 0; umbilical scar present), juvenile
(not yet mature), or adult. Males were considered mature if
their claspers were calcified and their lengths were in accord
with previously published lengths at maturity. Female maturity
was determined according to previously published lengths at
maturity. The status of age-0 sharks was based on the degree
of umbilical scar healing using the criteria described by Aubrey
and Snelson (2007): 1 = umbilical remains present, 2 = open
or fresh scar, 3 = partially open, some healing, 4 = well-healed,
scar visible, and 5 = no scar present. All sharks caught alive
were tagged in the dorsal fin with a numbered roto-tag provided
by NOAA–Fisheries and released.
Data analysis.—Since the majority of hooks were recovered
without bait, soak time was not included in the calculations of
catch rates. Catch rates were expressed as catch per unit effort
(CPUE), i.e., the number of sharks per 50 hooks. Overall CPUE
was calculated on a monthly basis for all sharks caught in Cum-
berland and Nassau sounds. Generalized trends in abundance
were examined by calculating mean monthly CPUE from 2009
to 2011. Analysis of variance (ANOVA) was used to test for
differences in overall CPUE between years.
Two types of analysis were used to examine the effect
of environmental data on shark catches. Due to the large
number of sets that caught no sharks, catch data were split
into presence/absence and abundance data. Presence/absence
data were generated by determining whether or not each set
caught at least one shark. Sets that caught zero sharks were
then removed and abundance data were generated for each
set that caught at least one shark. Analyses were performed
using these data for the three most abundant shark species.
Logistic regression models (proc logistic; SAS version 10.0)
were developed using presence/absence data to determine
which environmental factors had an effect on whether or not
a set caught at least one shark. The factors included in the
models were site, month, bottom water temperature, depth,
salinity, dissolved oxygen (DO), and all biologically relevant
interactions between factors. For all sets that caught at least one
shark, general linear models (GLMs; proc glm; SAS version
10.0) were used to determine which factors had the greatest
effect on shark abundance. The same factors used in the logistic
regression models were also used in the GLMs. Final models for
both the logistic regressions and GLMs were determined using
a backwards stepping procedure. Nonsignificant interactions
were eliminated first, followed by nonsignificant main effects.
Factors were deemed significant if P < 0.05.
RESULTS
Overall Abundance
A total of 310 longline sets were made in Cumberland
Sound (n = 147) and Nassau Sound (n = 163) from 2009
to 2011. A total of 622 sharks representing 11 species were
caught (Table 1). Sixty-seven percent of all sets caught at least
one shark, and the number of sharks caught (mean ± SE)
per set (for sets that caught at least one shark) was 3.01 ±
0.19. The species composition included all four species of
the small coastal shark complex (Atlantic Sharpnose Sharks,
Bonnetheads, Blacknose Sharks, and Finetooth Sharks) and
five species from the large coastal shark complex (Blacktip,
Sandbar, Scalloped Hammerhead, Spinner, and Lemon sharks)
TABLE 1. Species composition, abundance, percent of total catch, sex, and life stage for all sharks caught in Cumberland and Nassau sounds from 2009 to
2011. Species are in order of overall abundance (most to least abundant); NS = sex unknown, NR = not recorded.
Sex Life stage
Shark species No. caught % of catch Male Female NS Age 0 Juvenile Adult NR
Atlantic Sharpnose Rhizoprionodon terraenovae 348 55.9 274 68 6 128 19 196 5
Blacktip Carcharhinus limbatus 95 15.3 40 52 3 53 36 5 1
Bonnethead Sphyrna tiburo 63 10.1 11 49 3 4 8 49 2
Sandbar C. plumbeus 36 5.8 22 13 1 8 26 1 1
Scalloped Hammerhead S. lewini 22 3.5 17 4 1 4 17 0 1
Finetooth C. isodon 19 3.1 15 3 1 1 13 3 2
Blacknose C. acronotus 15 2.4 10 5 0 0 1 14 0
Spinner C. brevipinna 11 1.8 6 5 0 10 1 0 0
Nurse Ginglymostoma cirratum 91.44320900
Lemon Negaprion brevirostris 30.50210300
Smooth Dogfish Mustelus canis 10.20100010
Total 622 100.0
ABUNDANCE AND DISTRIBUTION OF SHARKS 203
TABLE 2. Environmental conditions experienced by sharks caught in Cumberland and Nassau sounds from 2009 to 2011. Means and ranges (in parentheses)
are given. Data are provided for all sharks as a group, the three most abundant species (in order of abundance), and sets that caught no sharks.
Shark species Depth (m) Bottom temp. (
◦
C) Salinity (‰) DO (mg/L)
All sharks 6.0
(1.8–12.8)
27.2
(19.1–36.2)
33.5
(24.2–37.7)
5.2
(2.96–9.58)
Atlantic Sharpnose 6.1
(1.8–12.8)
27.4
(20.1–36.2)
33.3
(24.2–37.7)
5.2
(3.18–9.58)
Blacktip 5.3
(2.3–11.8)
28.1
(22.6–36.2)
33.1
(24.2–36.8)
5.1
(3.1–8.77)
Bonnethead 5.8
(1.8–12.0)
27.8
(20.9–31.0)
33.3
(24.2–37.0)
4.6
(2.96–6.40)
Sets with no sharks 6.2
(2.0–14.3)
25.6
(17.3–30.6)
33.0
(9.8–37.1)
5.4
(1.28–8.16)
as well as Nurse Sharks and Smooth Dogfish. All 11 species
were caught in Cumberland Sound and 9 species were caught in
Nassau Sound. With the exception of the Blacknose Shark, all
species were caught in greater numbers in Cumberland Sound
than in Nassau Sound. Of the 622 sharks that were caught,
Atlantic Sharpnose Sharks (n = 348), Blacktip Sharks (n =
95), and Bonnetheads (n = 63) were the most abundant species
and accounted for 81.4% of the total catch.
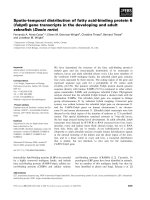
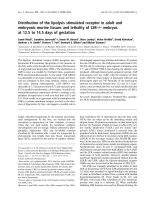
The mean CPUE for all sharks from 2009 to 2011 was 1.60
sharks/50-hooks (SD = 1.96). Annual mean CPUE was highest
for 2010 (2.15; SD, 1.96); however, there was no significant
difference in CPUE between years (F = 0.38, P > 0.05). Mean
monthly CPUE increased with increasing mean monthly tem-
perature, from 0.18 sharks/50-hooks in April to a maximum
of 3.27 sharks in July. After July, monthly CPUE decreased
steadily through the late summer and fall (Figure 2).
Environmental Analysis
Sharks were caught in Cumberland and Nassau sounds in
a wide range of environmental conditions (Table 2). Logistic
FIGURE 2. Mean monthly CPUE for all sharks caught in Cumberland and
Nassau sounds from 2009 to 2011 and the corresponding mean monthly water
temperatures (
◦
C). Error bars denote SEs.
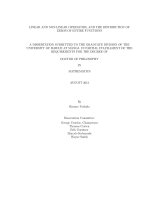
regressions produced significant models for Atlantic Sharpnose
Sharks, Blacktip Sharks, and Bonnetheads (Table 3). Site,
month, bottom temperature, DO, and month × bottom tempera-
ture were significant factors for Atlantic Sharpnose Sharks. The
probability of catching at least one shark was higher in Cum-
berland Sound than in Nassau Sound (Figure 3). Also, the mean
bottom temperature was warmer for sets that caught at least one
Atlantic Sharpnose Shark than for sets that did not (Figure 4).
The factors that significantly influenced the presence/absence
of Blacktip Sharks were month, site, bottom temperature, and
depth. Sets that caught at least one Blacktip Shark were warmer
than those that did not (Figure 4). Dissolved oxygen was slightly
lower for sets that caught Blacktip Sharks (5.0 ± 0.12 mg/L)
than for sets that did not (5.3 ± 0.06 mg/L). The only
TABLE 3. Logistic regression results and significance (P < 0.05) of fac-
tors used in the models to examine the effect of environmental factors on the
presence/absence of three shark species in Cumberland and Nassau sounds.
Whole-model statistics are given in parentheses to the right of the species’
names.
Variable(s) Wald χ
2
P
Atlantic Sharpnose Sharks (log likelihood = 35.4;
Wald χ
2
= 28.3, P < 0.0001; df = 5)
Site 15.5 < 0.0001
Bottom temp. 9.6 0.0019
Month × bottom temp. 4.8 0.0277
Dissolved oxygen 4.7 0.0307
Month 4.1 0.0421
Blacktip Sharks (log likelihood = 43.0; Wald χ
2
= 27.9,
P < 0.0001; df = 4)
Bottom temp. 17.3 < 0.0001
Depth 5.6 0.0181
Site 5.3 0.0219
Month 4.9 0.0259
Bonnetheads (log likelihood = 20.5; Wald χ
2
= 17.9,
P < 0.0001; df = 1)
Dissolved oxygen 17.9 < 0.0001
204 MCCALLISTER ET AL.
FIGURE 3. Mean probability of catching at least one Atlantic Sharpnose
Shark or Blacktip Shark in Cumberland and Nassau sounds. Error bars denote
SEs.
significant factor affecting the presence/absence of Bonnet-
heads was dissolved oxygen, with sets that caught them having
alowerDO(4.59 ± 0.15 mg/L) than sets that did not (5.35 ±
0.06 mg/L).
Analysis of the abundance data using GLMs produced
significant models for Atlantic Sharpnose and Blacktip sharks
as well as Bonnetheads (Table 4). The factors that significantly
influenced the abundance of Atlantic Sharpnose Sharks were
site and bottom temperature. Atlantic Sharpnose Sharks were
more abundant in Cumberland Sound (2.7 ± 0.3 sharks/set;
n = 228) than in Nassau Sound (2.0 ± 0.2 sharks/set; n =
128), and sets that caught more than the mean number of sharks
were in warmer water than sets that caught less than the mean
number (Table 5). For Bonnetheads, the only significant factor
FIGURE 4. Mean bottom temperature for sets that caught at least one Atlantic
Sharpnose Shark or Blacktip Shark (present) and sets that did not catch any
sharks (absent) in Cumberland and Nassau sounds combined. Error bars denote
SEs.
TABLE 4. Results of general linear models used to examine the effect of
environmental factors on the abundance of sharks in Cumberland and Nassau
sounds. See Table 3 for additional information.
Variable(s) F–value P
Atlantic Sharpnose Sharks (F = 6.64, P = 0.0018;
R
2
= 0.09; df = 2)
Bottom temp. 8.98 0.0032
Site 5.78 0.0175
Blacktip Sharks (F = 3.96, P = 0.0012;
R
2
= 0.40; df = 8)
Depth 13.2 0.0007
Bottom temp. 7.7 0.008
DO 7.0 0.0111
Salinity 4.1 0.0484
Depth × bottom temp. 13.9 0.0005
Depth × bottom temp. × DO 12.7 0.0009
Depth × DO 12.0 0.0011
Bottom temp. × DO 7.4 0.009
Bonnetheads (F = 8.4, P = 0.0064;
R
2
= 0.19; df = 1)
Salinity 8.4 0.0064
in the GLM was salinity, with 60% of all Bonnethead captures
occurring in salinities of 30‰ or more. The GLM for Blacktip
Sharks was the most complex. Depth, bottom temperature,
salinity, and DO were all significant factors, as were multiple
interactions between these variables. Blacktip Shark abundance
was higher in warm, deep water with lower levels of DO
(Table 5). Seventy-nine percent of all Blacktip Sharks were
caught in waters with a salinity of 30‰ or greater.
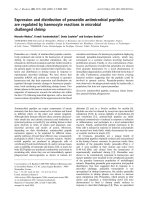
Species-Specific Results
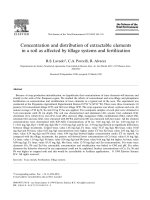
Atlantic Sharpnose Sharks.—Atlantic Sharpnose Sharks (n =
348) were the most abundant species caught at the study sites and
accounted for 55.9% of the total catch. Individuals were caught
in all months of the survey except for April, with the highest
number of sharks being caught between May and September
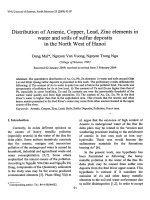
(Figure 5a). The lengths of captured Atlantic Sharpnose Sharks
ranged from 31 to 102 cm TL (Figure 6a). Mature sharks made
up 57% of the total catch, were most abundant in May and June,
and had a mean length of 89.0 cm TL. Age-0 individuals made up
37% of the total catch and were present from May to September,
with greatest abundances occurring in July and August. They
had a mean length of 40.9 cm. All age-0 individuals that were
caught had umbilical scars that were mostly healed or well
healed; none were found with umbilical remains or fresh/open
umbilical scars. Juveniles, which were caught between June and
October, made up only 6% of the total catch and had a mean
length of 58.0 cm. The overall sex ratio of females to males
was 1:4.03, significantly different from 1:1 (χ
2
= 122.88, P <
0.0001), with males (n = 274) making up 78.8% of the catch.
Of the 68 females caught, all but 1 were age-0 and juvenile
ABUNDANCE AND DISTRIBUTION OF SHARKS 205
TABLE 5. Mean ± SE bottom temperature, depth, and dissolved oxygen (DO) values for sets that caught ≥3and<3 Atlantic Sharpnose and Blacktip sharks
per set. Values are not provided for depth and DO for Atlantic Sharpnose Sharks because these factors were not significant.
Bottom temp. (
◦
C) Depth (m) DO (mg/L)
Shark species ≥3 <3 ≥3 <3 ≥3 <3
Atlantic Sharpnose 27.8 ± 0.2 27.1 ± 0.3
Blacktip 29.4 ± 0.4 27.9 ± 0.3 6.5 ± 0.8 5.1 ± 0.3 4.3 ± 0.1 5.2 ± 0.2
FIGURE 5. Monthly abundance of (a) Atlantic Sharpnose Sharks, (b) Blacktip Sharks, and (c) Bonnetheads in Cumberland and Nassau sounds from 2009 to
2011, by each life stage.
206 MCCALLISTER ET AL.
FIGURE 6. Length frequency plots for (a) Atlantic Sharpnose Sharks, (b) Blacktip Sharks, and (c) Bonnetheads caught in Cumberland and Nassau sounds from
2009 to 2011, by sex. Lengths are grouped into 5-cm length bins; NM = not measured.
ABUNDANCE AND DISTRIBUTION OF SHARKS 207
individuals. A single gravid female (95 cm TL) was caught in
Nassau Sound on May 19, 2010, and gave birth to three full-term
pups while on the line.
Blacktip Sharks.—Blacktip Sharks (n = 95) were the second
most abundant species caught in the survey and accounted for
15.3% of the total catch. This was the most abundant species
caught in the large coastal shark complex. Individuals were
only present from May to September, the greatest abundance
being seen between June and August (Figure 5b). They ranged
in size from 56 to 173 cm TL and included age-0, juvenile,
and adult individuals (Figure 6b). Primarily age-0 (57%) and
juvenile (38%) individuals were caught during the survey. Age-
0 Blacktip Sharks (mean length = 64.1 cm) were present from
May to August, with the greatest abundance occurring in July
and August. Umbilical scars in various stages of healing (fresh
to well-healed) were observed on all age-0 Blacktip Sharks.
Juveniles (mean length = 87.2 cm) were present from May
to September. Only five mature Blacktip Sharks (three males,
two females) were caught during the survey (mean length =
152.8 cm).
Bonnetheads.—A total of 63 Bonnetheads were caught
from 2009 to 2011. This was the third most abundant species
caught during the survey and comprised 10.1% of the total
catch. Bonnetheads were present from May to October, with
the majority of animals being caught in the summer (Figure
5c). Bonnetheads were captured at lengths ranging from 41 to
118 cm TL (Figure 6c); the male-to-female ratio was 1:4.45,
significantly different than 1:1 (χ
2
= 22.82, P < 0.0001). Adult
Bonnetheads (mean length = 100 cm) were most abundant
from June to August, comprised 80% of the catch, and were
mostly female. Very few juvenile (n = 8) and age-0 (n = 4)
sharks were captured. Juveniles had a mean length of 68.1 cm,
and age-0 individuals had a mean length of 47.9 cm.
Other species.—The remaining eight species made up a total
of 18.6% of the total catch; only Sandbar Sharks (5.8%) com-
prised more than 5%. For most of these species, the majority of
the animals captured were age-0 and juvenile individuals; how-
ever, only mature Blacknose Sharks were caught. Catches of
Sandbar Sharks consisted primarily of juveniles, and they were
the predominant species caught in the cooler months of the sur-
vey (April, October, and November). All of the Spinner Sharks
caught during the survey were age-0 animals with healing um-
bilical scars, and they were only caught in July and August.
Tag–Recapture Data
A total of 419 sharks were tagged in Cumberland and Nassau
sounds from 2009 to 2011, and 18 were recaptured (Table 6), for
a recapture rate of 4.3%. Of the 18 sharks recaptured, 17 were
initially tagged in Cumberland Sound and 1 in Nassau Sound.
The longest time at liberty was 411 d for a mature male Atlantic
Sharpnose Shark tagged in Cumberland Sound in May 2010 and
recaptured in Cumberland Sound in June 2011 at a distance of
2.6 km from where it was tagged. The longest distance trav-
eled was 190.5 km for a mature male Atlantic Sharpnose Shark
tagged in Cumberland Sound in August 2009 and recaptured off
Cape Canaveral, Florida, in March 2010. An Atlantic Sharpnose
Shark was tagged in Cumberland Sound on July 1, 2009, and
recaptured 14 d later in Nassau Sound having traveled ∼21 km.
TABLE 6. Shark recaptures from 2009 to 2011 for individuals from Cumberland and Nassau sounds. Days refers to the number of days between initial
capture and recapture; distance is the straight-line distance between the tagging and recapture locations. Abbreviations are as follows: M = male, F = female,
CS = Cumberland Sound, and NS = Nassau Sound.
Shark species Sex Life stage Date tagged Location tagged Location recaptured Days Distance (km)
Atlantic Sharpnose M Mature Jul 1, 2009 CS NS 14 20.6
M Mature Aug 5, 2009 CS CS 326 2.6
M Mature Aug 5, 2009 CS Daytona Beach 224 190.5
M Mature Aug 5, 2009 CS CS 32 2.1
M Mature Aug 17, 2009 CS CS 4 3.9
M Mature May 4, 2010 CS CS 411 3.5
M Mature May 10, 2010 CS CS 13 2.5
M Mature May 25, 2011 CS CS 352 3.7
Blacktip M Juvenile Jul 15, 2009 CS CS 63 3.1
F Age 0 Jul 15, 2009 CS CS 71 7.3
F Juvenile Sep 9, 2009 CS CS 39 7
M Juvenile June 2, 2010 NS Little Talbot Island 100 18.1
F Juvenile May 20, 2011 CS CS 63 0.9
Bonnethead F Mature May 6, 2010 CS Fernandina Beach 23 7.3
F Age 0 Jul 13, 2011 CS CS 4 3.8
Sandbar M Age 0 Jul 22, 2011 CS CS 30 2.7
M Age 0 Aug 11, 2011 CS CS 9 1.9
Spinner M Age 0 Aug 5, 2011 CS CS 13 1.7
208 MCCALLISTER ET AL.
Fifteen of the 18 recaptured sharks were caught less than 10 km
from where they were initially tagged. All 10 age-0 and juvenile
sharks that were recaptured were recaught the same year they
were tagged.
DISCUSSION
This study represents the first attempt to characterize the
abundance and distribution of shark populations in the nearshore
and estuarine waters of northeast Florida. Eleven species were
caught from 2009 to 2011, including species in both the small
and large coastal shark management units. This suggests that
the estuarine waters of Cumberland and Nassau sounds support
a wide variety of shark species. Although there are no studies
from northeast Florida with which we can compare our results,
our results are similar to those of previous studies from South
Carolina (Ulrich et al. 2007) and, in particular, Georgia (Belcher
and Jennings 2010). The shark species composition identified
in this study was similar to that in estuarine waters of Georgia
(Belcher and Jennings 2010), with Atlantic Sharpnose and
Blacktip sharks and Bonnetheads comprising the majority of
the catch.
The presence and abundance of sharks in Cumberland and
Nassau sounds were affected most by site, bottom tempera-
ture, and month. The higher probability of catching a shark and
overall greater abundance of sharks in Cumberland Sound sug-
gest that there are differences in the abundance and distribution
of sharks between these two regions. This is not unexpected,
as previous studies have also shown regional differences in
shark abundance in nearshore ecosystems in southwest Florida
(Simpfendorfer et al. 2005), Florida Bay (Torres et al. 2006), and
the Indian River Lagoon system (Curtis 2008). Since sampling
effort between the two sites was comparable, this difference is
not likely the result of sampling effort bias. Also, environmental
conditions were very similar between the two regions and likely
did not have a great influence in regional differences in shark
abundance. It is possible that Cumberland Sound (∼41.3 km
2
)
offers more potential habitat for sharks, particularly juvenile
sharks, given its larger area in comparison with Nassau Sound
(∼30.1 km
2
). It should also be noted that the entrance to Cum-
berland Sound is a deep dredged channel, while the entrance
to Nassau Sound is a shallow, natural inlet with continuously
changing sandbars (McCallister, personal observations). Thus,
it is also possible that the constantly changing nature of the en-
trance to Nassau Sound limits the movement of sharks into the
sound.
The significance of month and bottom temperature in the
models for presence and abundance indicate that use of north-
east Florida estuaries by sharks is seasonal. Although sharks
were caught in all months of the survey, sets that caught sharks
were in warmer waters (mean = 27.2
◦
C) than sets that did not
(mean = 25.6
◦
C). Since no sharks were caught in waters below
19
◦
C, it is likely that the movement of sharks into northeast
Florida estuaries requires a minimum, or threshold, water tem-
perature, which is consistent with the findings for other coastal
estuaries. Temperature was the driving factor for the movement
of Sandbar Sharks into nurseries in both Delaware (Merson and
Pratt 2001) and Chesapeake bays (Grubbs et al. 2007). Similarly,
Castro (1993) and Ulrich et al. (2007) documented the pres-
ence of sharks in South Carolina estuaries after water tempera-
tures reached ∼19–20
◦
C. Increasing shark abundance at higher
temperatures is also expected. In the coastal waters of Texas,
Froeschke et al. (2010) showed that shark catch rates increased
as temperatures increased between 20
◦
C and 30
◦
C, a trend also
seen in the present study. Also, coastal waters tend to be warmest
during summer months when parturition for species like Atlantic
Sharpnose and Blacktip sharks occurs (Castro 2011:509–513),
resulting in increased shark catches, particularly of age-0 indi-
viduals (Parsons and Hoffmayer 2007). Catches of such sharks
in this study were highest during summer months.
The results from this survey suggest that the estuarine waters
of Cumberland and Nassau sounds serve as nursery habitat for
Atlantic Sharpnose and Blacktip sharks. High catches of age-0
Atlantic Sharpnose Sharks with healing and healed umbilical
scars in summer months, particularly July and August, suggest
that this area serves as a primary nursery, with immigration
into the nursery occurring in early summer. This is consistent
with findings from the coastal waters of South Carolina, where
neonate and age-0 individuals are captured beginning in late
May (Ulrich et al. 2007). Similar patterns of nursery habitat use
have also been observed for age-0 Atlantic Sharpnose Sharks
in the northeast Gulf of Mexico (Carlson and Brusher 1999;
Drymon et al. 2010). The lack of mature female Atlantic Sharp-
nose Sharks in this survey is consistent with the results of studies
in the nearshore waters of the north-central Gulf of Mexico (Par-
sons and Hoffmayer 2005; Drymon et al. 2010). In those studies
mature females were caught almost exclusively in offshore wa-
ters, and Parsons and Hoffmayer (2005) suggested that gravid
females only move inshore to give birth during a very brief
time interval. This could explain the capture of only one gravid
female in this study.
The high abundance of age-0 Blacktip Sharks with visible
umbilical scars and juveniles suggests that these waters act as
both primary and secondary nursery areas during the summer
months. The appearance of older juveniles in late spring and
age-0 individuals in early summer (after females give birth) is
consistent with the occurrence of Blacktip Sharks in nurseries
in both the northwest Atlantic (Castro 1996) and northeast and
north-central Gulf of Mexico (Bethea et al. 2004; Parsons and
Hoffmayer 2007). Also, limited tag–return data suggest that age-
0 and juvenile Blacktip Sharks use these estuaries throughout
the summer months, before moving offshore in the fall. This is
similar to the movement patterns of juvenile Blacktip Sharks in
Terra Ceia Bay, Florida identified by Heupel and Hueter (2001,
2002).
The overall low abundance of Bonnetheads during this sur-
vey can likely be attributed to gear bias. This is not surpris-
ing, as other studies of shark nurseries that have used longline
ABUNDANCE AND DISTRIBUTION OF SHARKS 209
gear also reported low Bonnethead catches (e.g., Belcher and
Jennings 2010), while studies that have used nets reported much
higher catches (e.g., Ulrich et al. 2007). Indeed, on the few oc-
casions when a gill net was used in the present survey, the catch
consisted almost completely of Bonnetheads (McCallister et al.,
unpublished data). Despite these low catches, the presence of
gravid females and a few age-0 individuals with healed umbil-
ical scars suggest that these waters serve as nursery habitat for
Bonnetheads in some respect.
It is important to note that the gear bias associated with us-
ing longlines instead of gill nets is not limited to the ability
to catch Bonnetheads and likely influenced the overall catch
composition of this survey. Ulrich et al. (2007) found signif-
icant differences in relative abundance and size at capture for
Finetooth and Atlantic Sharpnose sharks as well as Bonnet-
heads when using both longlines and gill nets to survey sharks
in the estuarine waters of South Carolina. Gill nets caught both
greater numbers of Finetooth and Atlantic Sharpnose sharks as
well as smaller individuals. This is not surprising, as Carlson
and Cortes (2003) showed that gill nets have high selectivity
for these species. Unfortunately, the ability to consistently and
effectively use a gill net in our survey was limited because of
environmental constraints, specifically, strong tidal currents and
sudden changes in depth over very short distances. Despite this,
it is apparent that the use of a gill net would expand on this
survey, and methods for sampling using both longlines and gill
nets are currently being considered.
It has been suggested that the mere presence of gravid fe-
males and/or the high abundance of age-0 and juvenile sharks
in an area does not mean that the area is a nursery or that it
functions as critical habitat (Heithaus 2007). Instead, Heupel
et al. (2007) proposed using well-defined criteria to quantita-
tively assess whether an area serves as nursery habitat. Though
this issue was not directly examined in this study, our data sug-
gest that Cumberland and Nassau sounds satisfy two of these
criteria: (1) juvenile sharks remain there for extended periods of
time and (2) the area is used repeatedly across years. Tag–return
data from four Blacktip Sharks tagged in Cumberland Sound
and recaptured less than 7 km from their initial location after
1–2 months at liberty suggest that sharks remain in that area for
extended periods of time. Also, the fact that age-0 and juvenile
individuals of the four most abundant species were caught in
each year of the survey suggests that Cumberland and Nassau
sounds are used repeatedly across multiple years. Continued
sampling within these regions, along with expanding the sur-
vey to surrounding areas, will enable further testing of these
criteria.
Given the current need to identify EFH and incorporate this
information into fishery management plans (NMFS 1996), stud-
ies that identify and describe shark nursery habitat are increas-
ing. Although nursery grounds have already been identified and
studied extensively for some of the species caught in this survey
(see McCandless et al. 2007), many of the species are highly
migratory, so identifying potential nursery habitat throughout
their range will provide a more detailed account of the loca-
tion of EFH. Given the lack of information on shark habitat use
in these waters, it is important that these areas be described.
Further research will provide more species-specific data on
nursery habitat use in this region, including predator–prey re-
lationships, movement patterns within nurseries, and species
interactions.
ACKNOWLEDGMENTS
This work was funded by a grant to J.G. from the Na-
tional Oceanic and Atmospheric Association, National Marine
Fisheries Service (NOAA–NMFS), Cooperative Atlantic States
Shark Pupping and Nursery Survey Program. Additional finan-
cial support was provided by two Graduate Scholar Grants to
M.M. by the University of North Florida (UNF) Graduate Pro-
gram and a Faculty Summer Scholarship Grant to J.G. from
the UNF Department of Academic Affairs. The UNF Biology
Department provided the vessels and vehicles used during this
study. Tags and tagging equipment were provided by NOAA–
NMFS, Division of Highly Migratory Species. M. Heithaus, E.
Johnson, and A. Piercy provided valuable help with the sta-
tistical analyses in this paper. Special thanks are extended to
other UNF students who contributed significantly to this sur-
vey, especially B. Anderson, A. Breakey, A. Leary, R. Smith,
and C. Walker, without whom it would have been impossi-
ble to complete this study. This research was conducted under
the authorization of the Florida Fish and Wildlife Conservation
Commission (Special Activity License SAL-09-1136A-SR) and
the UNF Institutional Animal Care and Use Committee.
REFERENCES
Aubrey, C. W., and F. F. Snelson Jr. 2007. Early life history of the Spinner Shark
in a Florida nursery. Pages 175–189 in C. T. McCandless, N. E. Kohler, and H.
L. Pratt Jr., editors. Shark nursery grounds of the Gulf of Mexico and the East
Coast waters of the United States. American Fisheries Society, Symposium
50, Bethesda, Maryland.
Bass, A. J. 1978. Problems in the studies of sharks in the southwest Indian Ocean.
Pages 545–594 in E. S. Hodgson and R. F. Matthews, editors. Sensory biology
of sharks, skates, and rays. Department of Navy, Office of Naval Research,
Arlington, Virginia.
Belcher, C. N., and C. A. Jennings. 2010. Utility of mesohabitat features for
determining habitat associations of subadult sharks in Georgia’s estuaries.
Environmental Biology of Fisheries 88:349–359.
Bethea, D. M., J. A. Buckel, and J. K. Carlson. 2004. Foraging ecology of the
early life stages of four sympatric shark species. Marine Ecology Progress
Series 268:245–264.
Branstetter, S. 1990. Early life history implications of selected carcharhinoid and
lamnoid sharks of the northwest Atlantic. NOAA Technical Report NMFS
90:17–28.
Carlson, J. K., and J. H. Brusher. 1999. An index of abundance for coastal
species of juvenile sharks from the northeast Gulf of Mexico. Marine Fisheries
Review 61:37–45.
Carlson, J. K., and E. Cortes. 2003. Gillnet selectivity of small coastal sharks
off the southeastern United States. Fisheries Research 50:405–414.
Castro, J. I. 1993. The shark nursery of Bulls Bay, South Carolina, with a
review of the shark nurseries of the southeastern coast of the United States.
Environmental Biology of Fishes 38:37–48.
210 MCCALLISTER ET AL.
Castro, J. I. 1996. Biology of the Blacktip Shark, Carcharhinus limbatus,
off the southeastern United States. Bulletin of Marine Science 59:508–
522.
Castro, J. I. 2011. The sharks of North America. Oxford University Press, New
Yo rk .
Curtis, T. H. 2008. Distribution, movements, and habitat use of Bull Sharks
(Carcharhinus leucas, Muller and Henle 1839) in the Indian River Lagoon
system, Florida. Master’s thesis, University of Florida, Gainesville.
Drymon, J. M., S. P. Powers, J. Dindo, B. Dzwonkowski, and T. A. Henwood.
2010. Distributions of sharks across a continental shelf in the northern Gulf of
Mexico. Marine and Coastal Fisheries: Dynamics, Management, and Ecosys-
tem Science [online serial] 2:440–450.
FAO (Food and Agriculture Organization of the United Nations). 2000. Conser-
vation and management of sharks. FAO, Technical Guidelines for Responsible
Fisheries 4, supplement 1, Rome.
FLDEP (Florida Department of Environmental Protection). 2007. Water quality
assessment report Nassau–St. Mary’s. Division of Water Resource Manage-
ment, Tallahassee, Florida.
Froeschke, J., G. W. Stunz, and M. L. Wildhaber. 2010. Environmental influ-
ences on the occurrence of coastal sharks in estuarine waters. Marine Ecology
Progress Series 407:279–292.
Grubbs, R. D., J. A. Musick, C. L. Conrath, and J. R. Romine. 2007. Long-
term movements, migration, and temporal delineation of a summer nurs-
ery for juvenile Sandbar Sharks in the Chesepeake Bay region. Pages
87–107 in C. T. McCandless, N. E. Kohler, and H. L. Pratt Jr., editors.
Shark nursery grounds of the Gulf of Mexico and the East Coast waters of
the United States. American Fisheries Society, Symposium 50, Bethesda,
Maryland.
Heithaus, M. R. 2007. Nursery areas as essential shark habitats: a theoretical
perspective. Pages 3–13 in C. T. McCandless, N. E. Kohler, and H. L. Pratt,
Jr. editors. Shark nursery grounds of the Gulf of Mexico and the East Coast
waters of the United States. American Fisheries Society, Symposium 50,
Bethesda, Maryland.
Heupel, M. R., J. K. Carlson, and C. A. Simpfendorfer. 2007. Shark nursery ar-
eas: concepts, definition, characterization, and assumptions. Marine Ecology
Press Series 337:287–297.
Heupel, M. R., and R. E. Hueter. 2001. Use of an automated acoustic telemetry
system to passively track juvenile Blacktip Shark movements. Pages 217–236
in J. R. Sibert and J. L. Nielsen, editors. Electronic tagging and tracking in
marine fisheries. Kluwer Academic Publishers, Dordrecht, The Netherlands.
Heupel, M. R., and R. E. Hueter. 2002. The importance of prey density in
relation to the movement patterns of juvenile sharks within a coastal nursery
area. Marine and Freshwater Research 53:543–550.
Magnuson–Stevens Fishery Conservation and Management Act. 1996. U.S.
Code, volume 16, sections 1801–1883.
McCandless, C. T., N. E. Kohler, and H. L. Pratt Jr., editors. 2007. Shark nursery
grounds of the Gulf of Mexico and the East Coast waters of the United States.
American Fisheries Society, Symposium 50, Bethesda, Maryland.
Merson, R. R., and H. L. Pratt Jr. 2001. Distribution, movements, and growth
of young Sandbar Sharks, Carcharhinus plumbeus, in the nursery grounds of
Delaware Bay. Environmental Biology of Fishes 61:13–24.
NMFS (National Marine Fisheries Service). 1996. Report on the 1996 shark
evaluation workshop. National Oceanic and Atmospheric Administration,
NMFS, Southeast Fisheries Science Center, Miami.
NMFS (National Marine Fisheries Service). 1999. Final fishery manage-
ment plan for Atlantic tunas, Swordfish, and sharks. National Oceanic and
Atmospheric Administration, National Marine Fisheries Service, Silver
Spring, Maryland.
NMFS (National Marine Fisheries Service). 2003. Final amendment 1 to the
fishery management plan for Atlantic tunas, Swordfish, and sharks. National
Oceanic and Atmospheric Administration, National Marine Fisheries Service,
Silver Spring, Maryland.
NMFS (National Marine Fisheries Service). 2006. Final consolidated Atlantic
highly migratory species fishery management plan. National Oceanic and
Atmospheric Administration, National Marine Fisheries Service, Silver
Spring, Maryland.
Parsons, G. R., and E. R. Hoffmayer. 2005. Seasonal changes in the distribu-
tion and relative abundance of the Atlantic Sharpnose Shark Rhizoprionodon
terraenovae in the north central Gulf of Mexico. Copeia 2005:914–920.
Parsons, G. R., and E. R. Hoffmayer. 2007. Identification and characterization
of shark nursery grounds along the Mississippi and Alabama Gulf coasts.
Pages 301–316 in C. T. McCandless, N. E. Kohler, and H. L. Pratt Jr., editors.
Shark nursery grounds of the Gulf of Mexico and the East Coast waters of
the United States. American Fisheries Society, Symposium 50, Bethesda,
Maryland.
Simpfendorfer, C. A., G. G. Freitas, T. R. Wiley, and M. R. Heupel. 2005.
Distribution and habitat partitioning of immature Bull Sharks (Carcharhinus
leucas) in a southwest Florida estuary. Estuaries 28:78–85.
Springer, S. 1967. Social organization of shark populations. Pages 149–174 in
P. W. Gilbert, R. F. Mathewson, and D. P. Rall, editors. Sharks, skates, and
rays. Johns Hopkins Press, Baltimore, Maryland.
Torres, L. G., M. R. Heithaus, and B. Delius. 2006. Influence of teleost abun-
dance on the distribution and abundance of sharks in Florida Bay, USA.
Hydrobiologia 569:449–455.
Ulrich, G. F., C. M. Jones, W. B. Driggers III, J. M. Drymon, D. Oakley, and C.
Riley. 2007. Habitat utilization, relative abundance, and seasonality of sharks
in the estuarine and nearshore waters of South Carolina. Pages 125–139 in
C. T. McCandless, N. E. Kohler, and H. L. Pratt Jr., editors. Shark nursery
grounds of the Gulf of Mexico and the East Coast waters of the United States.
American Fisheries Society, Symposium 50, Bethesda, Maryland.