Sailfish habitat utilization and vertical movements in the southern gulf of mexico and florida straits
Bạn đang xem bản rút gọn của tài liệu. Xem và tải ngay bản đầy đủ của tài liệu tại đây (454.31 KB, 14 trang )
BioOne sees sustainable scholarly publishing as an inherently collaborative enterprise connecting authors, nonprofit publishers, academic institutions, research
libraries, and research funders in the common goal of maximizing access to critical research.
Sailfish Habitat Utilization and Vertical Movements in the Southern Gulf of
Mexico and Florida Straits
Author(s): David W. Kerstetter, Shannon M. Bayse, and Jenny L. FentonJohn E. Graves
Source: Marine and Coastal Fisheries: Dynamics, Management, and Ecosystem Science, 3(1):353-365.
2012.
Published By: American Fisheries Society
URL: />BioOne (www.bioone.org) is a nonprofit, online aggregation of core research in the biological, ecological, and
environmental sciences. BioOne provides a sustainable online platform for over 170 journals and books published
by nonprofit societies, associations, museums, institutions, and presses.
Your use of this PDF, the BioOne Web site, and all posted and associated content indicates your acceptance of
BioOne’s Terms of Use, available at www.bioone.org/page/terms_of_use.
Usage of BioOne content is strictly limited to personal, educational, and non-commercial use. Commercial inquiries
or rights and permissions requests should be directed to the individual publisher as copyright holder.
Marine and Coastal Fisheries: Dynamics, Management, and Ecosystem Science 3:353–365, 2011
C
American Fisheries Society 2011
ISSN: 1942-5120 online
DOI: 10.1080/19425120.2011.623990
ARTICLE
Sailfish Habitat Utilization and Vertical Movements
in the Southern Gulf of Mexico and Florida Straits
David W. Kerstetter,* Shannon M. Bayse, and Jenny L. Fenton
Nova Southeastern University Oceanographic Center, 8000 North Ocean Drive, Dania Beach,
Florida 33004, USA
John E. Graves
Virginia Institute of Marine Science, College of William and Mary, Route 1208 Greate Road,
Gloucester Point, Virginia 23062, USA
Abstract
Pop-up satellite archival tags (PSATs) were deployed on 19 sailfish Istiophorus platypterus captured in the southern
Gulf of Mexico and Florida Straits between 2005 and 2007 on commercial pelagic longline gear (n = 18) and
recreational rod-and-reel gear (n = 1). The data from three tags indicated mortality events and were excluded from
subsequent analyses. All PSATs were programmed to collect pressure (depth), temperature, and light-level data for
10 d at approximately 90-s intervals. These transmitted point data subsequently allowed the reconstruction of vertical
movement patterns. The remaining 16 PSAT data sets indicate that sailfish are primarily associated with the upper
surface waters within the top 20 m (75.7% of total time during the day versus 46.7% at night) but undertake numerous
short-duration vertical movements below the local mixed layer to depths of 50–150 m, presumably to feed. Analyses
of 2,279 individual vertical movements among all 16 tagged sailfish indicated two distinct types (short-duration “V”
and longer-duration “U” movements) similar to those reported for white marlin Kajikia albida. Sailfish also exhibited
movement type differences between diel periods (having higher proportions of V movements in daytime), suggesting
directed foraging at depth. Although short-duration movement to depths by these tagged fish contribute a small
percentage of the total time at depth, these depths overlap with the monitored shallow-set pelagic longline gear depths
actively targeting swordfish by the vessel in the local fishery. These results suggest that time-at-depth histograms
alone may be insufficient to capture feeding motivations at depth and, therefore, true interaction potentials between
individual sailfish and pelagic longline gear.
The sailfish Istiophorus platypterus is a large, cosmopoli-
tan teleost found worldwide in tropical and subtropical waters,
generally with higher concentrations near continental shelf ar-
eas (Nakamura 1985). Conventional tagging data have shown
broad movements of sailfish within the western Atlantic Ocean
(Ortiz et al. 2003), although no trans-Atlantic or trans-Equatorial
movements have been documented (Orbesen et al. 2009). The
latest assessment of the western Atlantic sailfish stock suggests
that the stock is overfished and that this overfishing is primar-
Subject editor: Michelle Heupel, James Cook University, Queensland, Australia
*Corresponding author:
Received August 14, 2010; accepted April 24, 2011
ily the result of international pelagic longline fleets targeting
swordfish and tunas (SCRS 2009).
In Florida, sailfish support a large, mostly catch-and-release
recreational fishery based primarily in the coastal shelf re-
gion between Key West and Jupiter (Jolley 1977). The Florida
Straits have been closed to the U.S. pelagic longline fishery
since 2001, primarily to protect local concentrations of juvenile
swordfish Xiphias gladius. However, vessels continuing to use
pelagic longline gear to the west and north of this closed area
353
354 KERSTETTER ET AL.
occasionally encounter high rates of sailfish bycatch while tar-
geting large swordfish and yellowfin tuna Thunnus albacares.
Several studies using electronic tag technologies have shown
that sailfish are capable of daily horizontal movements (e.g.,
Hoolihan and Luo 2007; Orbesen et al. 2008) on the scale of
tens of kilometers. These ranges of distances would provide
connectivity for sailfish between the portions of the Florida
Straits that are open and closed to the pelagic longline fishery, a
continuing source of domestic fisheries conflict in south Florida
waters.
Evaluating vertical habitat use by large pelagic fishes has his-
torically presented challenges owing to a combination of their
individual size, movement speed, and depth ranges. Previous
work generally focused on the manual tracking of animals with
acoustic tag technology for short periods of time with dedicated
chase vessels (e.g., Jolley and Irby 1979). However, the devel-
opment of pop-up satellite archival tag (PSAT) technology has
enabled researchers to record environmental data on animals
for much longer periods and at much more detailed resolution
while eliminating the need for direct monitoring of the animal
or fisheries-dependent returns of the tag. Electronic monitor-
ing technology, such as small temperature and depth recorders
(TDRs), has enabled a concurrent increase in our understanding
of fishing gear behavior, including movements and effective fish-
ing depths. The combined use of these technologies to describe
both vertical short-duration movements and overall habitat uti-
lization can provide insights into the vulnerability of bycatch
species to various fishing gears, and allow for more-informed
management measures. The present study used the point data
from 16 PSATs with 90-s sampling period resolution for 10-d
deployment durations attached to sailfish to describe the short-
duration behavior and vertical habitat utilization of this species
in the southern Gulf of Mexico and Florida Straits.
METHODS
Sailfish tagging occurred in two locations within the south-
ern Gulf of Mexico: location 1, approximately 90 km south-
southwest of Key West, Florida, in an area traditionally fished by
the U.S. coastal pelagic longline fleet; and location 2, offshore of
the island of Isla Mujeres, Mexico, the site of a large recreational
fishery for sailfish (Figure 1). Tagging operations off Key West
occurred aboard the U.S. commercial pelagic longline fishing
vessel FV Kristin Lee during May 2006 and June 2007. The
target species for all three trips was nominally swordfish, and
(as is standard in the fishery) all sets were made overnight, gear
deployment occurring at dusk and retrieval at dawn. The gear
configuration was similar to that used throughout this local fish-
ery and consisted of 18.3-m (10-fathom) leaders and 18.3-m
(10-fathom) buoy float line lengths during each set in five-hook
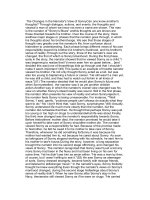
FIGURE 1. Southern Gulf of Mexico and Florida Straits study area in which deployments of pop-up satellite archival tags on sailfish were made. Filled dots
indicate tagging locations, while open dots indicate the locations of first satellite transmission. Depth contours are shown for 200, 1,000, 2,000, and 3,000 m.
SAILFISH HABITAT UTILIZATION AND VERTICAL MOVEMENTS 355
baskets (hooks between floats). Per current U.S. fisheries reg-
ulations, all sailfish were caught on either non-offset size 16/0
or 10
◦
offset size 18/0 circle hooks using squid Illex spp. or At-
lantic mackerel Scomber scombrus bait. The tag deployment for
the Isla Mujeres sailfish occurred aboard the sportfishing vessel
Sea-D during May 2006 while trolling a ballyhoo baited with a
non-offset size 7/0 circle hook.
We used the Microwave Telemetry (Columbia, Maryland)
Model PTT-100 HR satellite tag in all tag deployments during
this study. Tags were rigged with approximately 16 cm of 136-kg
(300-lb) test strength Momoi brand (Momoi Fishing, Ako City,
Japan) fluorocarbon monofilament attached to a large hydro-
scopic nylon intramuscular tag head with aluminum crimps per
Graves et al. (2002). On all tags but the Isla Mujeres deploy-
ment, a 68-kg (150-lb) test strength Sampo brand (Sampo, Barn-
eveld, New York) ball bearing swivel was incorporated midway
along the tether to reduce twisting torque at the attachment
location caused by drag forces on the tag. Tags sampled tem-
perature, pressure (depth), and irradiance (light level) at 93-s
intervals. This tag model also included emergency release soft-
ware that automatically detached the tag if the pressure sensor
indicated depths approaching the crush limit of the tag casing
(ca. 2,000 m). All tags were preprogrammed to release from the
fish after 10 d at large.
Data were transmitted through the Argos satellite system
while the tags floated at the surface following detachment from
the animal. Tags used in this study transmitted archived data in
“packets,” each encompassing several minutes of consecutive
data points. However, each packet was transmitted in a discon-
tinuous overall pattern such that gaps exist between packets
within the transmitted record. This tag model also contained
proprietary “SiV” programming, which directs the tag to only
transmit data when an Argos satellite is expected to be above the
horizon. This programming extends the onboard battery power
and allows for additional Argos transmissions, thereby increas-
ing the total transmitted data.
To delineate the maximum effective fishing depths for the
configuration of pelagic longline gear used by the commer-
cial vessel, small TDRs (Model LTD-1100; Lotek Wireless, St.
John’s, Newfoundland) were attached to the lower end of the
middle branch lines (hook three in the five-hook baskets) during
gear deployments (see additional details on placement in Ker-
stetter and Graves 2006a). This model of TDR records pressure
(as pounds per square inch [PSI]) and temperature at 14-s inter-
vals. The pressure data from the TDRs were standardized from
PSI to depth (m) with latitude and seawater density corrections
using Harris (2000). Data from these TDRs were also used to
confirm local mixed-layer depths (MLDs).
Sailfish tagging.—Prior to deployment, all PSATs were al-
lowed to cycle through the full internal activation process. The
captain of the pelagic longline vessel identified incoming sail-
fish on the line, and individuals were initially evaluated as live
or dead based on movement (or lack thereof) alongside the ves-
sel. The sailfish tagged from the recreational vessel was identi-
fied to species prior to becoming hooked on one of the surface
baits.
Live fish were manually brought alongside the vessel rail
and held briefly by the leader until calm. The PSAT tagging
procedures used were identical to the ones described in Ker-
stetter and Graves (2006b), although a shorter applicator tip
(8 cm) was employed to compensate for the much more later-
ally compressed sailfish body form. The nylon anchor attached
to the PSAT tether was carefully inserted about 5–10 cm be-
low the midpoint of the first dorsal fin to a depth of about 4–6
cm. This location on the fish provides an opportunity for the
nylon tag head to pass through the dorsal pterygiophores with-
out approaching the coelemic cavity (see Prince et al. 2002).
A conventional National Oceanic and Atmospheric Administra-
tion Fisheries Service Cooperative Tagging Center streamer tag
was also attached posterior of the PSAT on all fish tagged from
the pelagic longline vessel.
Sailfish were released as soon as possible after tagging by
cutting the leader near the hook unless the hook was readily
accessible for manual removal. For the single recreationally
caught fish, total time from capture to release was less than
10 min. No animals were resuscitated by either vessel platform
after tagging. Prior to release, the hooking location (following
the terminology of Yamaguchi 1989) and overall physical con-
dition of the animal were noted, and fish lengths and weights
were estimated. All other pertinent data—including the time of
day, vessel location, and sea surface water temperature—were
recorded immediately after tagging.
Data analysis.—The net movement of tagged sailfish was
estimated as the minimum straight-line distance (MSLD) trav-
eled between the initial tagging location and the location of the
first reliable satellite contact with the detached tag (inferred as
the location of tag pop-up) using Argos location codes 1, 2,
or 3 (position uncertainty, ≤1.5 km; CLS 2011) for the first or
second day of transmission. “Great Circle” distances between
these points were calculated with program inverse (version 2.0;
NGS 1975; modified by M. Ortiz, National Marine Fisheries
Service Southeast Fisheries Science Center, Miami, Florida).
For analysis of diel differences, data were separated into
day and nighttime periods. Sunrise and sunset times for
approximated positions were obtained from the U.S. Naval
Observatory (). Because individual
daily positions could not be matched with cloud cover data,
no attempts were made to standardize light levels for local
atmospheric conditions. Crepuscular periods were identified
and excluded for diel analyses by removing the 30-min period
before and after estimated times of local sunrise and sunset
(corroborated with light-level data). Using only day and
night period data, histograms were generated at 10-m (depth)
and 1
◦
C (temperature) intervals for each individual sailfish
and compared using paired t-tests. Finally, depth differences
between sequential ca. 90-s period point data were used to
examine the range and speed of vertical movements. Due to the
“packet” transmission of the archived tag data, the final data
356 KERSTETTER ET AL.
sets occasionally had discontinuous intervals, usually less than
1 h in length. All discontinuous intervals within each tag record
were identified and excluded from the individual dive analyses.
Sea surface temperature (SST) was calculated as the average
temperature for all depths 0–5 m to reduce fine-scale variability
between measured data. Relationships between vertical habitat
utilization and thermal structure of the water column used two
calculated values for each photoperiod: SST and the mixed-layer
depth temperature (MLDT = SST – 0.5
◦
C as per Levitus 1982).
Paired t-tests between diel periods were used to assess habitat
utilization above and below respective SST and MLDT values
for each 24-h period of the deployment.
The structure of the transmitted data from the PSATs
allows for a re-creation of the thermal environment surround-
ing individual sailfish by using the fish as autonomous sam-
plers of the water column (Boehlert et al. 2001; Block et al.
2003; Horodysky et al. 2007). Forty-eight hour periods were
selected from three sailfish that had their tags physically recov-
ered (hence, 100% data recovery) and demonstrated representa-
tive short-duration vertical movements to depth. Within a given
48-h period, archived temperature and depth data were used to
create 96 temperature–depth profiles for each 30-min block of
time. Temperature readings between data points were interpo-
lated from these profiles at 5 m and 0.1
◦
C resolution (MATLAB
R2006a, version 7.2.0.232). To provide a visual description of
local subsurface temperature and short-duration movements, in-
terpolated temperatures and depth tracks were then superim-
posed using the archived depth and temperature data recorded
during the vertical movements of these individual fish per the
methods of Horodysky et al. (2007).
The structure of the PSAT data also allowed the reconstruc-
tion of individual vertical movements to depth. As all move-
ments began and ended in shallow depths, these movements are
referred to hereafter as “dives.” The characteristics of these indi-
vidual dive events were assessed through a variety of analyses.
Data from onboard vessel electronics, deployed TDRs (for the
pelagic longline vessel sets), and reconstructed vertical profiles
from the tag data sets all indicated an MLD of approximately
10 m in the waters of the southern Gulf of Mexico. A vertical
movement was therefore considered a single dive if it (1) began
at a depth less than 10 m, (2) incurred a maximum depth greater
than 10 m, and (3) returned to a depth less than 10 m. Any
vertical movement not meeting these three criteria or that was
missing any data from within the movement itself was consid-
ered an “incomplete” dive event and excluded from subsequent
analyses. Individual dives were then analyzed for maximum
depth, minimum temperature, SST at beginning of dive, overall
duration of dive, and the “interdive interval” (the period between
the end of one dive event and the start of the next). Most dive
events demonstrated a period of rapid movement to depth, fol-
lowed by a relatively stable period at this depth before returning
to near-surface waters. Any period of time at depth within an
individual dive was termed “bottom time” and calculated as the
period within the dive when the vertical movement rate was less
than 5 m/min. All vertical movements and movement parame-
ters were assessed through a manual review of each tag data set.
Any extreme dive events were confirmed by corroboration with
concurrent temperature data.
Once a movement was classified as a dive event, subsequent
tests were conducted comparing mean maximum depth and du-
ration between diel periods among tagged individuals. Rela-
tionships between mean dive depth and duration for pooled data
were also explored through regression analyses as well as be-
tween diel periods. Significance was assessed at the α = 0.05
level.
Dive characterization.—All 16 sailfish appeared to exhibit
the two different types of dives described by Horodysky et al.
(2007) for white marlin Kajikia albida. So-called “V-shaped”
dives involved rapid descents with relatively small amount of
time at depth or bottom time (≤10 min), and a rapid ascent to
a shallower depth. Conversely, the “U-shaped” dives had simi-
lar rapid descents but a relatively longer time at depth (16–245
min) before the rapid ascent to shallower depths. Since the pri-
mary difference between the dive types is amount of time spent
at the lower depths of the dive, dive type can be determined
as a function of bottom time. To confirm dive classification
by bottom time, multivariate statistical techniques were applied
to six different dive characteristics manually recorded for each
completely transmitted dive of each surviving sailfish to deter-
mine if there were indeed two different dive types present, and
what minimum and maximum bottom times best characterized
a dive type. The six dive characteristic variables (dive duration,
maximum depth, change in temperature, depth divided by dive
duration, interdive interval, and bottom time) were entered into
the quantitative techniques described by Lesage et al. (1999)
and Horodysky et al. (2007).
Dive characteristics were standardized (PROC STANDARD,
SAS version 9.2; SAS Institute, Cary, North Carolina), and a
principal components analysis (PCA) was used to both elimi-
nate collinearity and produce a smaller set of orthogonal factors
to input into cluster analysis (Horodysky et al. 2007). Four or-
thogonal factors were derived from the PCA (dive duration,
maximum depth, change in temperature, and interdive inter-
val) and were entered into a hierarchical complete-linkage clus-
ter procedure to ascertain the appropriate number of clusters
and dive types, and to determine seed points for nonhierarchi-
cal K-means clustering (Horodysky et al. 2007). Hierarchical
complete-linkage clustering is an agglomerative method which
classifies clusters by the maximum distance between one cluster
and the next (Hair et al. 1998). The number of dive types suffi-
cient to capture the variability between dives was determined by
examining the agglomerative coefficient, the squared Euclidean
distance between two clusters being combined, from 2 up to
10 clusters (Horodysky et al. 2007). The cluster centroids that
resulted from the complete-linkage clustering are next entered
into a nonhierarchical K-means clustering that further fine-tuned
the formed clusters. Observations were assigned to the cluster
with the centroids with the closest Euclidean distance, and new
SAILFISH HABITAT UTILIZATION AND VERTICAL MOVEMENTS 357
TABLE 1. Summary of satellite archival tagging deployments for sailfish in the southern Gulf of Mexico. The ACESS score refers to a physical condition index
based on a 10-point scale (10 being the highest score; see Kerstetter et al. 2002 for further details); MSLD = minimum straight-line distance traveled. The three
mortalities described within text are not included.
Sailfish Date deployed
Hooking
location Hook size
Hook
removed
ACESS
score
Estimated
length (cm)
Reporting
(%)
MSLD
(km)
6-01 3 May 2006 Corner 16/0 Yes 9 137 59 448.0
6-02 4 May 2006 Lower jaw 18/0 Yes 9 183 82 375.5
6-03 4 May 2006 Fouled 16/0 No 8 168 63 150.1
6-04 4 May 2006 Isthmus 18/0 Yes 10 183 55 188.6
6-05 4 May 2006 Corner 16/0 No 10 168 68 332.4
6-06 5 May 2006 Eye socket 16/0 No 9 152 75 554.9
6-07 5 May 2006 Fouled 16/0 Yes 8 152 65
a
97.3
6-08 5 May 2006 Lower jaw 18/0 Yes 8 168 40 193.5
6-09 6 May 2006 Corner 18/0 Yes 8 152 68 447.0
6-10 (IM)
b
31 May 2006 Corner 7/0 Yes 10 137
c
49 217.1
7-01 6 Jun 2007 Corner 16/0 No 9 122 75 522.9
7-03 6 Jun 2007 Corner 16/0 No 6 122 87 125.0
7-04 6 Jun 2007 Corner 16/0 No 10 122 74 406.2
7-05 6 Jun 2007 Corner 16/0 No 10 137 86 564.0
7-06 9 Jun 2007 Corner 16/0 No 5 107 88 717.3
7-07 9 Jun 2007 Corner 16/0 No 6 122 88 67.4
a
Original reporting percentage; tags were later returned, allowing a 100% data recovery rate.
b
Animal tagged off the recreational vessel in Isla Mujeres, Mexico.
c
Not estimated.
centroids were calculated after each iteration until the changes
in centroids become small or zero (Horodysky et al. 2007). Dive
classification was confirmed by discriminant function analyses,
using the two nearest neighbors to identify which cluster (dive
type) to be assigned (Lesage et al. 1999). Percentages of misclas-
sified dives, or error rates, were calculated by cross-validation.
A matrix of minimum bottom time values (1, 5, 10, and
15 min) for U-shaped dives was compared with a maximum
bottom time values for V-shaped dives to investigate which
combination of minimum and maximum bottom time best rep-
resented dive type. The resultant dive types were then entered
into the quantitative methods described previously to determine
which minimum and maximum values were agreed upon by
both dive type via bottom time and objectively by multivariate
statistical techniques. The set of minimum and maximum val-
ues that covered the broadest scope of dives and had the lowest
percentages of misclassified dives was used to determine dive
type.
RESULTS
Tagging Events
Eighteen PSATs were deployed on sailfish caught on pelagic
longline gear targeting swordfish in the southern Gulf of Mexico
between November 2005 and July 2007. Overall bycatch of
istiophorid billfishes comprised less than 3% by number of the
total catch on the three observed trips. One PSAT was deployed
on a sailfish caught from a sportfishing vessel off Mexico in
May 2006.
Three sailfish caught on pelagic longline gear died shortly af-
ter release, and the data from these fish were excluded from sub-
sequent analyses (see Kerstetter and Graves 2008). A summary
of tagging information and the physical condition of the surviv-
ing tagged animals is presented in Table 1. For all 16 PSATs, an
average of 70.3% (range = 40–88%) of the archived data were
successfully recovered through the Argos system. Four archival
data sets (2006: n = 1; 2007: n = 3) were recovered after the
tags washed up onto Atlantic beaches and were returned to the
authors. All (100%) of the archived data were recovered from
these four returned tags and included in subsequent analyses.
Horizontal Movement
Individual sailfish moved away from the tagging location
various distances and and in various directions (mean distance =
337.9 km; range = 97.3–564.0 km). There was no relationship
between MSLD traveled and estimated individual size. Three of
the fish tagged within the U.S. Exclusive Economic Zone (EEZ)
crossed into foreign EEZ waters, including the Bahamas (n =
2) and Cuba (n = 1), while the fish tagged in Mexican waters
remained within the Mexico EEZ (Figure 1).
Depth and Temperature
There were no significant diel differences in either the
time-at-temperature or time-at-depth distributions between the
2 years of this study, and data were subsequently pooled to in-
clude fish from both years. Sailfish demonstrated a very strong
358 KERSTETTER ET AL.
FIGURE 2. (A) Combined time-at-depth and (B) time-at-temperature histograms for 16 sailfish tagged with pop-up satellite archival tags for 10-d deployment
durations in the southern Gulf of Mexico and Florida Straits, 2006 and 2007. Error bars indicate SEs around mean values.
association with warm surface waters (Figure 2A, B), spend-
ing approximately 34% (SD, 13.2) of their total time in the
upper 10 m of the water column and 41% (SD, 10.7) within
the 10–20-m stratum. Sailfish spent 12.4% (SD, 12.9) of their
time at depths ranging from 20 to 50 m, and only 10.6% (SD,
26.7) at depths greater than 50 m. Broad standard errors reflect
large within-individual (daily) variation in time at depth rather
than differences among individuals. The absolute depth differ-
ence between sequential 90-s point measurements (“delta D”)
observed in three of the fish with 100% data recovery found
a highly significant difference between day and night periods
(t = –4.58, P 0.001 using Satterthwaite test for unequal
SAILFISH HABITAT UTILIZATION AND VERTICAL MOVEMENTS 359
FIGURE 3. (A)–(C) Detailed 48-h pattern of vertical movements overlaid on re-created local temperature-at-depth profiles generated from archived tag data for
three sailfish tagged with pop-up satellite archival tags for 10-d deployment durations in the southern Gulf of Mexico and Florida Straits, 2006 and 2007. Clear
diel differences in dive periodicity are evident in (A) but not (B), and a moderate effect of diel period is displayed in (C). The black bars along the top of each panel
represent the local periods of night generated from archived light-level data from the tags. Night periods varied slightly in length between fish owing to different
deployment dates.
variances), with sailfish moving vertically much more frequently
between depths at night.
Pooled temperature data demonstrated that sailfish spent
89.6% (SD, 45.4) of their time in water temperatures rang-
ing from 25–29
◦
C (Figure 2B), although archived SSTs
occasionally reached over 30
◦
C. Many individuals exhibited
considerable daily variation in the temperature–depth data over
the course of the 10-d tag deployment period (Figure 3, A–C),
including deep short-duration movements below the MLDT.
The absolute temperature difference within each dive event
(“delta T”) showed that 71.7% (SD, 29.7) occurred between
0
◦
C and 2.0
◦
C, 99.2% (SD, 6.4) occurring between 0
◦
C and
8.0
◦
C (Figure 4).
All of the fish in this study spent more time at depths below
the MLD during daylight hours (significantly for 14 fish of the
16 total; P < 0.05; Table 2). Individual fish exhibited different
patterns regarding total time spent below the MLD; however,
of the four individuals showing a significant difference between
day and night periods for time below the MLD, three were
at those depths more at night and one during day. Pooling all
individual sailfish, a regression analysis of time spent below the
MLD and individual body size (as estimated LJFL) showed no
significant effect (adjusted r
2
= 0.116, F = 2.9, P = 0.1069).
A total of 2,279 complete individual dive events were ex-
amined. To minimize autocorrelation effects between individual
dives, a mean maximum dive depth and mean dive duration were
360 KERSTETTER ET AL.
FIGURE 4. Percentages of dives versus differences between the local sea surface temperature (SST) and the minimum temperature encountered on a dive event
by 1
◦
C intervals for 16 sailfish tagged with pop-up satellite archival tags for 10-d deployment durations in the southern Gulf of Mexico and Florida Straits, 2006
and 2007.
calculated for day and night for each fish. Night dive events had
a mean maximum depth of 38.6 m and mean dive duration of
19.4 min, while day dive events had a mean maximum depth of
45.0 m and a mean duration of 14.4 min. Relationships between
mean dive depth and mean dive duration within each diel period
were significant (night: adjusted r
2
= 0.615, P < 0.001; day:
adjusted r
2
= 0.746, P < 0.001), although the regressions
were not significantly different from each other (Fisher’s z
comparison: z =−0.615, P > 0.25; Cohen and Cohen 1983).
Comparisons of dive depth and duration by diel period for all
TABLE 2. Comparisons between day and night periods for the percentage of time spent below the mixed-layer depth (MLD) and the percentage of time spent
below the sea surface temperature depth (SSTD). Asterisks denote significant differences.
Percent < SSTD Percent < MLD
Sailfish number Mean day Mean night Significance Mean day Mean night Significance
6-01 0.051 0.583 * 0.913 0.179 *
6-02 0.267 0.020 0.625 0.369 *
6-03 0.121 0.117 0.814 0.642 *
6-04 0.257 0.239 0.784 0.556 *
6-05 0.219 0.133 0.318 0.745 *
6-06 0.285 0.219 0.929 0.650 *
6-07 0.328 0.342 0.508 0.164 *
6-08 0.184 0.187 0.800 0.673 *
6-09 0.235 0.412 0.690 0.167 *
6-10 (IM)
a
0.056 0.112 0.919 0.793 *
7-01 0.345 0.277 0.606 0.483
7-03 0.211 0.296 0.675 0.200 *
7-04 0.035 0.061 * 0.766 0.473 *
7-05 0.082 0.278 * 0.900 0.493 *
7-06 0.400 0.097 * 0.319 0.293
7-07 0.238 0.361 0.533 0.328 *
Mean 0.207 0.233 0.694 0.450 *
a
Animal tagged off the recreational vessel in Isla Mujeres, Mexico.
SAILFISH HABITAT UTILIZATION AND VERTICAL MOVEMENTS 361
0 5 10 15 20 25 30 35 40
0
20
40
60
80
100
120
140
160
180
200
Depth (m)
Percentage of Total Time
Shallow-Set Pelagic Longline Sailfish
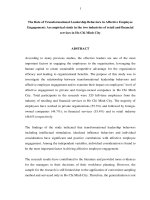
FIGURE 5. Combined time-at-depth histogram for hook depths and sailfish
depth utilization during the same period as pop-up satellite tag deployments
in the southern Gulf of Mexico, 2006. Pelagic longline gear hook depths are
for the deepest (middle) hook within a five-hook basket of shallow-set pelagic
longline gear representative of commercial gear deployments in the area. Depth
distributions represent combined day and night periods. Error bars are omitted
for clarity.
pooled individual dives also resulted in significant relationships
(night: adjusted r
2
= 0.615, P < 0.001; day: adjusted r
2
= 0.746,
P < 0.001), although the regressions for the day and night diel
periods were not significantly different from each other (Fisher’s
z comparison: z = –0.615, P > 0.25).
Depths of Shallow-Set Pelagic Longline Gear
Thirty-one individual TDR deployments were conducted
during four sets in 2006, all in hook position 3 of the five-hook
baskets, the middle and presumably deepest hook position. The
mean depth of the TDRs was 42.3 m (±SD 19.6), and the maxi-
mum depth recorded was 143.8 m. The time at depth distribution
for the pooled TDR data set for the deepest hook position and
the combined day and night time depth distribution of sailfish
tagged in 2006 is presented in Figure 5 and shows a large per-
centage of overlapping depths (including the implied greater
percentages for the pelagic longline gear at the two shallower
hook positions). However, these apparently overlapping depth
distributions do not reflect the actual movements of individual
sailfish to greater depths, even if such movements are for rel-
atively minor proportions of total time at depth. Examinations
of the sequential data “tracks” for these sailfish (e.g., Figure
3A–C) showed frequent short-duration movements below the
depths of the shallow-set pelagic longline gear.
Dive Characterization
Appropriate bottom time limits to determine dive type were
considered by comparing differing minimum bottom time values
for U-shaped dives and maximum bottom times for V-shaped
dives for each minimum and maximum value (i.e., a V-shape
maximum of 1 min would be compared for the entire series of
U-shape minimums [1, 5, 10, and 15 min]). A maximum bottom
time of 10 min for V-shaped dives and a minimum bottom time
of 15 min for U-shaped dives yielded the highest percentage of
total dives (91.5%) with the lowest percentage of misclassified
dives (5.7%); 224 dives types remain undetermined with bottom
times between 11 and 14 min. Cluster analysis showed that
after the joining of two clusters the agglomerative coefficient
dropped precipitously (agglomerative coefficient of 2.5 at two
clusters, dropping to 0.6 at three clusters), implying that two
dive classifications is sufficient.
Differences were observed between the dive characteristics
of U-shaped versus V-shaped dives. U-shaped dives had deeper
mean dive depths (53.5 ± 34.0 m), longer dive durations (28.0 ±
27.1 min), and a larger change in temperature (5.0 ± 12.5
◦
C)
than V-shaped dives (38.2 ± 26.2 m versus 10.2 ± 9.5 min,
2.2 ± 5.6
◦
C). However, U-shaped dives and V-shaped dives had
similar interdive intervals (24.4 ± 50.2 min and 24.8 ± 66.8 min,
respectively).
DISCUSSION
The description of sailfish behavior is of interest not only
to the various fishing constituencies but also to those seek-
ing gear-based bycatch avoidance solutions and habitat-based
standardization methods for stock assessment purposes. Using
point-level data allowed for a clearer characterization of short-
duration sailfish movements, as opposed to overall habitat uti-
lization through summary histograms. The ability to recreate
individual dives over a relatively longer period of time than pre-
vious acoustic studies also presented a better picture of sailfish
behavior, including the potential for interactions of individuals
with pelagic longline gear. Furthermore, the successful deploy-
ment of these PSATs with no premature releases on sailfish sup-
ports the observation that fishes smaller than large marlin and
tunas can accommodate these tags for short-duration deploy-
ments (Kerstetter and Graves 2006b; Horodysky et al. 2007).
The development of smaller PSAT models will clearly expand
the size range, and thus species list, of similar tagging studies
in the future.
Horizontal Displacement
The horizontal movements of sailfish in multiple directions
away from the initial tagging locations for long distances were
similar to the behavior reported by Graves et al. (2002) for blue
marlin Makaira nigricans, Kerstetter and Graves (2006b) for
white marlin, and Sippel et al. (2007) for striped marlin K. au-
dax, as well as that seen for sailfish by Prince et al. (2006) and
Hoolihan and Luo (2007). Only two of the 16 tagged sailfish had
MSLDs of less than 100 km over the 10-d deployment period.
The horizontal displacements observed in this study may be re-
lated to spawning, as they are consistent with the postspawning
movements northward along the shelf edge described in Jolley
and Irby (1979). The spawning period for sailfish in the southern
Gulf of Mexico and Florida Straits is from late April through
June (Voss 1953), and female sailfish caught in areas south-
west of the Florida Keys during this time often have hydrated
362 KERSTETTER ET AL.
oocytes (A. Mercier, FV Kristen Lee, personal communication;
G. O’Neill, FV Carol Ann, personal communications). Jolley
(1977) used detailed analyses of recreational catch records to
argue that sailfish indeed undertake a seasonal movement south-
ward into the Florida Keys during the winter and spring, then
moving northward through the summer. The movement of the
majority of the tagged animals in this study northward along the
Gulf of Mexico and Atlantic edges of the shelf supports the pat-
terns observed by Jolley (1977) as well as available conventional
tagging data (Orbesen et al. 2009).
Habitat Utilization
Maximum depths of sailfish in the 10-d deployments used
during this study (36.3–463.9 m; mean = 141.0 m) fell within
the general range reported for other tagged istiophorids (Block
et al. 1992; Brill et al. 1993; Pepperell and Davis 1999; Kerstetter
et al. 2003). However, these results should be viewed with some
caution because sampling intervals in this study were limited
to roughly every 90 s; the animal with the 36.3-m maximum
depth was the fish with the poorest Argos reporting rate. As
described for white marlin in Horodysky et al. (2007) and as
seen in the present study with sailfish, deep dives may occur
rapidly. It is therefore possible that all maximum dive depths
may not have been successfully captured with the sampling
interval used in this study. However, by definition, the most
rapid and deepest dives of a species represent extreme events,
and successful recording of such episodes reveals little about
routine animal behavior (Hays et al. 2004).
Sailfish habitat utilization in the western North Atlantic has
not been well studied. Two acoustically tagged sailfish off
Florida showed a clear preference for surface waters (Jolley
and Irby 1979), and prior work with sailfish habitat preferences
in the Arabian Gulf (Hoolihan and Luo 2007) showed only rare
utilization of depths greater than 50 m. The present study found
a broad range of depths encountered by these tagged individuals,
even if the majority of the time as a whole was spent within the
upper 20 m. However, the range of possible depths for the sail-
fish tagged in the southern Gulf of Mexico far exceeded those
for the animals in the Arabian Gulf (Hoolihan 2005). Other pos-
sible reasons for narrow depth preferences (e.g., oxycline depth
per Prince and Goodyear 2006) similarly do not apply to the
western North Atlantic in the same degree, permitting a broad
range of depth utilization for pelagic fishes.
The results presented here demonstrate frequent, mostly
short-duration movements to depth for sailfish that change in
frequency and depth between day and night diel periods. The re-
peated, clear patterns of movements suggest that the majority of
them are likely for feeding, although predator avoidance cannot
be rejected. However, prior studies of sailfish diet composition
suggest that individual sailfish forage at depth during both day
and night periods. In an examination of 241 stomachs of sailfish
caught during daylight hours off Florida, Voss (1953) reported
finding that epipelagic fishes (i.e., families Scombridae, Hemi-
ramphidae, and Belonidae) constituted the vast majority of prey
items. However, sea robins (family Triglidae) and deepwater oc-
topods Grimpoteuthis sp. were also present in the Voss (1953)
study, and since these animals do not vertically migrate with the
deep scattering layer, their presence also supports the view that
sailfish are feeding at depth rather than opportunistically feeding
on vertically migrating prey; the occurrence of Grimpoteuthis
sp. in particular resulted in Voss (1953) concluding that “sailfish
are not typical surface dwellers by habit.” Jolley (1977) ana-
lyzed contents from stomachs of sailfish caught during daylight
hours and found epipelagic fishes such as little tunny Euthynnus
alletteratus and exocoetid flyingfishes. In contrast, J
´
unior et al.
(2003) found mesopelagic fishes and cephalopods in sailfish
stomachs collected from pelagic longline fisheries where the
animals were caught during nighttime gear deployment periods.
The observed pattern was of generally deeper, shorter-duration
movements at night and shallower, longer ones during the day.
Despite the difficulties in stomach content analyses (e.g., post-
capture digestion), these prior diet studies nonetheless corrobo-
rate the vertical movement patterns observed in this study.
Habitat utilization of large pelagic fishes has been previously
characterized by depth, temperature, or both (e.g., Weng and
Block 2004; Sippel et al. 2007; Kerstetter et al. 2008). Several
studies have suggested that istiophorids in particular prefer a
narrow temperature range, such as Graves et al. (2002) with
Atlantic blue marlin, Gunn et al. (2003) with Coral Sea black
marlin M. indica, and Hoolihan and Luo (2007) for sailfish in
the Arabian Gulf. The sailfish in this study showed no tem-
perature distribution differences between years 2006 and 2007,
suggesting that these tagged fish may have been consistently
utilizing a specific temperature range between ∼25–29
◦
C. The
two sailfish tracked by Jolley and Irby (1979) off the Florida
coast did not dive below the local thermocline, but the tracks
were very short in duration. The comparatively shallow waters
of the Arabian Gulf also limited the range of temperatures avail-
able to be encountered by the sailfish described there, although
no such limitation exists in the southern Gulf of Mexico and
Florida Straits.
The so-called “thermal inertia” hypothesis suggests that
large-bodied fishes retain heat and more effectively forage in
colder waters for short periods of time than smaller fishes, al-
though it has not been extensively tested across pelagic taxa
(see Neill et al. 1976 with skipjack tuna Katsuwonus pelamis
and Schaefer and Fuller 2005 with skipjack and bigeye tuna
Thunnus obesus). Nonetheless, all billfishes and swordfish pos-
sess a brain-eye “heater organ” (Block 1986) that maintains
these structures at higher temperatures than the ambient water,
presumably to enable higher foraging efficiency in cooler waters
and lower light intensities (Block and Finnerty 1994; Fritsches
et al. 2005). While Block (1986) reported that the heater or-
gan of sailfish was not as robust as that of the larger billfish
species such as blue marlin, it could still provide a competi-
tive predatory advantage to sailfish foraging in slightly colder
subsurface waters. Brill and Lutcavage (2001) hypothesized that
there was an absolute value for temperature that governed the
SAILFISH HABITAT UTILIZATION AND VERTICAL MOVEMENTS 363
vertical behavior of pelagic teleosts, which they estimated to be
an 8
◦
C difference between SST and temperature at depth for
individual movements. The individual dive event analyses for
sailfish in this study showed that 99.2% occurred within an 8
◦
C
difference, data that are very consistent with the Brill and
Lutcavage (2001) hypothesis.
The dive events in these 16 tagged sailfish showed similar-
ities with the V- and U-shaped patterns described in Horodysky
et al. (2007) for white marlin, and although there was a con-
tinuum of bottom times, further analyses of the “bottom time”
factor confirmed that there are two main types of individual dive
events. These results suggest that this species may also engage
in similar types of “search” (U) and “directed” (V) behaviors.
U-shaped dives had deeper mean dive depths and longer dive
durations than V-shaped dives, suggesting an undirected search
pattern. Many individual daytime dives had a stepwise pattern
of increasingly shallow depths, further suggesting a possible
“skylighting” behavior of silhouetting prey against the bright
surface. However, the vertical and horizontal behavior of
sailfish is likely mediated by many different factors, including
prey density, local oceanographic conditions, and perhaps
even spawning events and seasonal effects as previously
discussed. The varying behavior between the southeastern Gulf
of Mexico sailfish in the present study and those described
in Hoolihan (2005) from the Arabian Gulf may simply reflect
these differences and preclude a “one-size-fits-all” conclusion
on the behaviors of sailfish as a species.
Application to Stock Assessments
The role for habitat standardization models of pelagic long-
line catch-per-unit-effort (CPUE) data for stock assessment pur-
poses, such as that proposed by Hinton and Nakano (1996), re-
mains an area of considerable disagreement. This type of model
directly relates population abundance with the joint probability
of the depths of individual fish with fishing gear depths. As sug-
gested by Kraus and Rooker (2007), a good deal of the concern
regarding the application of these models to the billfishes re-
lates to the incomplete knowledge of both pelagic longline gear
behavior and the behaviors of the individual istiophorid species
(see also Venizelos et al. 2001; Goodyear et al. 2003; Yokawa
et al. 2001). For example, Boggs (1992) found that pelagic long-
line catch rates in the central Pacific were affected by overall
gear depth and the position of the depth relative to the local ther-
mocline. More recent efforts by Bigelow et al. (2006) and Rice
et al. (2007) to describe the depths of the pelagic longline gear
have begun to clarify some of the differences between the pre-
dicted depths of Yoshihara (1954) and the actual depths actively
fished by the gear. However, the differences between geographic
locations and the effects of surface and subsurface currents may
preclude a simple assumption of actual fishing depths from gear
characteristics alone (see discussion in Bigelow et al. 2006).
Further modeling efforts are needed prior to the assumption of
particular depths for any given gear configuration.
Similarly, the increasing number of studies of habitat utiliza-
tion by swordfish, tunas, and billfishes has begun to elaborate
the complex relationships involved in pelagic longline gear in-
teractions (e.g., deployment time, bait). The higher utilization
percentages for shallower depths by sailfish over several stud-
ies has suggested that it might be possible to reduce bycatch
of sailfish by configuring shallow-set pelagic longline gear to
fish “below” the depths utilized by the species. Recent work
in the Pacific Ocean with experimental deep-set longline gear
(minimum depths > 100 m) showed significant reductions in
catch rates of blue marlin, striped marlin, and shortbill spearfish
Tetrapturus angustirostris, although the catch of sailfish was not
significantly different (Beverly et al. 2009). Such experimental
sets have yet to be done in the Atlantic Ocean and so cannot be
evaluated here for potential sailfish bycatch reduction.
The TDRs in this study only monitored the lowest hook po-
sition within the pelagic longline “basket;” however, all other
hook positions would presumably be at shallower depths and
therefore would similarly have a high potential for sailfish in-
teractions. While the majority of time at depth for sailfish is
above the depths actively fished by shallow-set pelagic longline
gear, the demonstrated frequent movements to depth of sail-
fish through this depth distribution likely negate most potential
for bycatch reduction for the shallow-set, swordfish-targeting
pelagic longline fishery through changes in gear depth alone.
These results suggest that time-at-depth histograms alone may
be insufficient to capture feeding motivations at depth and, there-
fore, true interaction potentials between individual sailfish and
pelagic longline gear. As suggested by Kraus and Rooker (2007)
and others, the role of deeper depths during short-duration dives
by istiophorid billfishes, presumably for foraging events, may
result in an ironic situation in which the depths of least amount
of aggregate time are the depths of highest feeding motiva-
tion, and hence the depths of highest interaction potential with
the baited hooks of pelagic longline gear. Until time at depth
and feeding motivations can be more clearly modeled, particu-
larly with respect to photoperiod, it remains premature to apply
habitat-based stock assessment models to sailfish.
ACKNOWLEDGMENTS
The authors greatly appreciate the generous programming
and analytical assistance provided by A. Horodysky (Hampton
University), as well as help with MATLAB programming from
A. Bever (Virginia Institute of Marine Science). We also thank
the captains and crews of the FV Kristin Lee,FVCarol Ann,
and the sportfishing vessel Sea-D for their assistance with our
tagging efforts. This study was funded by Gulf States Marine
Fisheries Commission grant BILLFISH-2005-009.
REFERENCES
Beverly, S., D. Curran, M. Musyl, and B. Molony. 2009. Effects of eliminating
shallow hooks from tuna longline sets on target and non-target species in the
Hawaii-based pelagic tuna fishery. Fisheries Research 96:281–288.
364 KERSTETTER ET AL.
Bigelow, K., M. K. Musyl, F. Poisson, and P. Kleiber. 2006. Pelagic longline
gear depth and shoaling. Fisheries Research 77:173–183.
Block, B. A. 1986. Structure of the brain and eye heater tissue in marlins,
sailfish, and spearfishes. Journal of Morphology 190:169–190.
Block, B. A., D. T. Booth, and F. G. Carey. 1992. Depth and temperature of
the blue marlin, Makaira nigricans, observed by acoustic telemetry. Marine
Biology 114:175–183.
Block, B. A., D. P. Costa, G. W. Boehlert, and R. E. Kochevar. 2003. Revealing
pelagic habitat use: the tagging of Pacific pelagics program. Oceanologica
Acta 25:255–2666.
Block, B. A., and J. R. Finnerty. 1994. Endothermy in fishes: a phylogenetic
analysis of constraints, dispositions and selection pressures. Environmental
Biology of Fishes 40:283–302.
Boehlert, G. W., D. P. Costa, D. E. Crocker, P. Green, T. O’Brien, S. Levitus,
and B. J. Le Boeuf. 2001. Autonomous pinniped environmental samplers:
using instrumented animals as oceanographic data collectors. Journal of At-
mospheric and Oceanic Technology 18:1882–1893.
Boggs, C. 1992. Depth, capture time, and hooked longevity of longline-caught
pelagic fish: timing bites of fish with chips. U.S. National Marine Fisheries
Service Fishery Bulletin 90:642–658.
Brill, R. W., D. B. Holts, R. K. C. Chang, S. Sullivan, H. Dewar, and F. G.
Carey. 1993. Vertical and horizontal movements of striped marlin (Tetrap-
turus audax) near the Hawaiian Islands, determined by ultrasonic teleme-
try, with simultaneous measurement of oceanic currents. Marine Biolology
117:567–574.
Brill, R. W., and M. E. Lutcavage. 2001. Understanding environmental influ-
ences on movements and depth distributions of tunas and billfishes can signif-
icantly improve population assessments. Pages 179–198 in G. R. Sedberry,
editor. Island in the stream: oceanography and fisheries of the Charleston
Bump. American Fisheries Society, Symposium 25, Bethesda, Maryland.
CLS (Collecte Localisation Satellites). 2011. Argos user’s manual. Available:
www.argos-system.org/documents/userarea/argos
manual en.pdf. (February
2011).
Cohen, J., and P. Cohen. 1983. Applied multiple regression/correlation analy-
ses for the behavioral sciences, 2nd edition. Lawrence Erlbaum Associates,
Hillsdale, New Jersey.
Fritsches, K. A., R. W. Brill, and E. J. Warrant. 2005. Warm eyes provide
superior vision in swordfish. Current Biology 15:55–58.
Goodyear, C. P., D. Die, D. W. Kerstetter, D. B. Olson, E. Prince, and G. P.
Scott. 2003. Habitat standardization of CPUE indices: research needs. ICCAT
(International Commission for the Conservation of Atlantic Tunas) Collected
Volume of Scientific Papers 55:613–623.
Graves, J. E., B. Luckhurst, and E. D. Prince. 2002. An evaluation of pop-
up satellite tags for estimating postrelease survival of blue marlin (Makaira
nigricans) from a recreational fishery. U.S. National Marine Fisheries Service
Fishery Bulletin 100:134–142.
Gunn, J. S., T. A. Patterson, and J. G. Pepperell. 2003. Short-term movement
and behavior of black marlin Makaira indica in the Coral Sea as determined
through a pop-up satellite archival tagging experiment. Marine and Freshwa-
ter Research 54:509–513.
Hair, J. F., R. E. Anderson, R. I. Tatham, and W. C. Black. 1998. Multivariate
data analysis: with readings, 5th edition. Prentice-Hall, Upper Saddle River,
New Jersey.
Harris, R. D. 2000. Water level accuracy and correcting for error due to gravita-
tional acceleration and liquid density. In-situ, Technical Note 001, Ft. Collins,
Colorado.
Hays, G. C., J. D. R. Houghton, C. Isaacs, R. S. King, C. Lloyd, and P.
Lovell. 2004. First records of oceanic dive profiles from leatherback tur-
tles, Dermochelys coriacea, indicate behavioral plasticity associated with
long-distance migration. Animal Behavior 67:733–743.
Hinton, M. G., and H. Nakano. 1996. Standardizing catch and effort statistics
using physiological, ecological, or behavioral constraints and environmental
data, with an application to blue marlin (Makaira nigricans) catch and effort
data from the Japanese longline fisheries in the Pacific. Bulletin of the Inter-
American Tropical Tuna Commission 21:171–200.
Hoolihan, J. P. 2005. Horizontal and vertical movements of sailfish (Istiophorus
platypterus) in the Arabian Gulf, determinedby ultrasonic and pop-up satellite
tagging. Marine Biology 146:1015–1029.
Hoolihan, J. P., and J. Luo. 2007. Determining summer residence status and
vertical habitat use of sailfish (Istiophorus platypterus) in the Arabian Gulf.
ICES Journal of Marine Science 64:1–9.
Horodysky, A. Z., R. Latour, D. W. Kerstetter, and J. E. Graves. 2007. Habi-
tat preferences and vertical movements of white marlin (Tetrapturus al-
bidus) tagged with short-duration pop-up archival satellite tags (PSATs)
in the western North Atlantic Ocean. Fisheries Oceanography 16:240–
256.
Jolley, J. W. Jr. 1977. The biology and fishery of Atlantic sailfish Istiopho-
rus platypterus, from southeast Florida. Florida Department of Natural Re-
sources, Publication 28, St. Petersburg.
Jolley, J. W. Jr., and E. W. Irby Jr. 1979. Survival of tagged and released At-
lantic sailfish (Istiophorus platypterus: Istiophoridae) determined with acous-
tic telemetry. Bulletin of Marine Science 29:155–169.
J
´
unior, T. V., C. M. Vooren, and R. P. Lessa. 2003. Feeding habits of four
species of Istiophoridae (Pisces: Perciformes) from Northeastern Brazil. En-
vironmental Biology of Fishes 70:293–304.
Kerstetter, D. W., and J. E. Graves. 2006a. Effects of circle versus J-style
hooks on target and non-target species in a pelagic longline fishery. Fisheries
Research 80:239–250.
Kerstetter, D. W., and J. E. Graves. 2006b. Survival of white marlin (Tetrap-
turus albidus) released from commercial pelagic longline gear in the west-
ern North Atlantic. U.S. National Marine Fisheries Service Fishery Bulletin
104:434–444.
Kerstetter, D. W., and J. E. Graves. 2008. Postrelease survival of sailfish caught
by commercial pelagic longline gear in the southern Gulf of Mexico. North
American Journal of Fisheries Management 28:1578–1586.
Kerstetter, D. W., B. E. Luckhurst, E. D. Prince, and J. E. Graves. 2003. Use of
pop-up satellite archival tags to demonstrate survival of blue marlin (Makaira
nigricans) released from pelagic longline gear. U.S. National Marine Fish-
eries Service Fishery Bulletin 101:939–948.
Kerstetter, D. W., P. H. Rice, D. Snodgrass, and E. D. Prince. 2008. Behavior
of an escolar Lepidocybium flavobrunneum in the Windward Passage as de-
termined by pop-up satellite archival tagging. Gulf and Caribbean Research
20:97–102.
Kraus, R. T., and J. R. Rooker. 2007. Patterns of vertical habitat use by Atlantic
blue marlin (Makaira nigricans) in the Gulf of Mexico. Gulf and Caribbean
Research 19:89–97.
Lesage, V., M. O. Hammill, and K. M. Kovacs. 1999. Functional classification
of harbor seal dives using depth profiles, swimming velocity, and an index of
foraging success. Canadian Journal of Zoology 77:74–87.
Levitus, S. 1982. Climatological atlas of the world ocean. National Oceanic and
Atmospheric Administration, Professional Paper 13, Silver Spring, Maryland.
Nakamura, I. 1985. Billfishes of the world: an annotated and illustrated catalogue
of marlins, sailfishes, spearfishes and swordfishes known to date. FAO species
catalogue, volume 5. FAO (Food and Agriculture Organization of the United
Nations) Fisheries Synopsis 125.
Neill, W. H., R. K. C. Chang, and A. E. Dizon. 1976. Magnitude and ecolog-
ical implications of thermal inertia in skipjack tuna, Katsuwonus pelamis.
Environmental Biology of Fishes 1:61–80.
NGS (National Geodetic Survey). 1975. Program INVERSE. Available:
www.ngs.noaa.gov/TOOLS/Inv
Fwd/Inv Fwd.html. (September 2011).
Orbesen, E. S., J. P. Hoolihan, J. E. Serafy, D. Snodgrass, E. M. Peel, and
E. D. Prince. 2008. Transboundary movement of Atlantic istiophorid bill-
fishes among international and U.S. domestic management areas inferred
from mark-recapture studies. Marine Fisheries Review 70:14–23.
Orbesen, E. S., D. Snodgrass, J. P. Hoolihan, and E. D. Prince. 2009. Updated
U.S. conventional tagging data base for Atlantic sailfish (1956–2009), with
comments on potential stock structure. International Commission for the
Conservation of Atlantic Tunas, SCRS/2009/047, Madrid.
Ortiz, M., E. D. Prince, J. E. Serafy, D. B. Holts, K. B. Davy, J. G. Pepperell,
M. B. Lowry, and J. C. Holdsworth. 2003. Global overview of the major
SAILFISH HABITAT UTILIZATION AND VERTICAL MOVEMENTS 365
constituent-based billfish tagging programs and their results since 1954. Ma-
rine and Freshwater Research 54:489–508.
Pepperell, J. G. and T. L. O. Davis. 1999. Post-release behavior of black marlin
(Makaira indica) caught and released using sportfishing gear off the Great
Barrier Reef (Australia). Marine Biology 135:369–380.
Prince, E. D., and C. P. Goodyear. 2006. Hypoxia-based habitat compression of
tropical pelagic fishes. Fisheries Oceanography 15:451–464.
Prince, E. D., D. B. Holts, D. Snodgrass, E. S. Orbesen, J. Luo, M. L. Domeier,
and J. E. Serafy. 2006. Transboundary movement of sailfish, Istiophorus
platypterus, off the Pacific Coast of Central America. Bulletin of Marine
Science 79:827–838.
Prince, E. D., M. Ortiz, A. Venizelos, and D. S. Rosenthal. 2002. In-water
conventional tagging techniques developed by the cooperative tagging cen-
ter for large, highly migratory species. Pages 155–171 in J. A. Lucy and
A. L. Studholme, editors. Catch and release in marine recreational fisheries.
American Fisheries Society, Symposium 30, Bethesda, Maryland.
Rice, P. H., C. P. Goodyear, E. D. Prince, D. Snodgrass, and J. E. Serafy. 2007.
Use of catenary geometry to estimate hook depth during near-surface pelagic
longline fishing: theory versus practice. North American Journal of Fisheries
Management 27:1148–1161.
Schaefer, K. M., and D. W. Fuller. 2005. Behavior of bigeye (Thunnus obe-
sus) and skipjack (Katsuwonus pelamis) tunas within aggregations associ-
ated with floating objects in the equatorial eastern Pacific. Marine Biology
146:781–792.
SCRS (Standing Committee on Research and Statistics). 2009. Report of the
2009 sailfish assessment (June 1–5, 2009). International Commission for the
Conservation of Atlantic Tunas, SCRS/2009/012, Madrid, Spain.
Sippel, T. J., P. S. Davie, J. C. Holdsworth, and B. A. Block. 2007. Striped
marlin (Tetrapturus audax) movements and habitat utilization during a sum-
mer and autumn in the Southwest Pacific Ocean. Fisheries Oceanography 16:
459–472.
Venizelos, A., M. I. Farber, and D. D. Benetti. 2001. An evaluation of assump-
tions associated with blue marlin depth distribution towards the possible
incorporation into the standardization of catch and effort statistics for use in
stock assessment. ICCAT (International Commission for the Conservation of
Atlantic Tunas) Collected Volume of Scientific Papers 53:258–262.
Voss, G. L. 1953. A contribution to the life history and biology of the sailfish,
Istiophorus americanus Cuv. and Val., in Florida waters. Bulletin of Marine
Science of the Gulf and Caribbean 3:206–240.
Weng, K. C., and B. A. Block. 2004. Diel vertical migration of the big-
eye thresher shark (Alopias superciliosus), a species possessing orbital
retia mirabilia. U.S. National Marine Fisheries Service Fishery Bulletin
102:221–229.
Yamaguchi, Y. 1989. Tuna longline fishing (I-V): historical aspects, fishing
gear and methods, selection of fishing ground, fish ecology, and conclusions.
Marine Behavior and Physiology 15:1–81.
Yokawa, K., Y. Takeuchi, M. Okazaki, and Y. Uozumi. 2001. Standardiza-
tions of CPUE of blue marlin and white marlin caught by Japanese long-
liners in the Atlantic Ocean. ICCAT (International Commission for the
Conservation of Atlantic Tunas) Collected Volume of Scientific Papers 53:
345–355.
Yoshihara, T. 1954. Distribution of catch of tuna longline. IV. On the relation
between K and ϕ
0
with a table and diagram. Bulletin of the Japanese Society
Scientific Fisheries 19:1012–1014.