Chapter 14 GAS–VAPOR MIXTURES AND AIRCONDITIONING
Bạn đang xem bản rút gọn của tài liệu. Xem và tải ngay bản đầy đủ của tài liệu tại đây (1.3 MB, 34 trang )
Chapter 14
GAS–VAPOR MIXTURES AND AIR-CONDITIONING
| 717
A
t temperatures below the critical temperature, the gas
phase of a substance is frequently referred to as a
vapor. The term vapor implies a gaseous state that is
close to the saturation region of the substance, raising the
possibility of condensation during a process.
In Chap. 13, we discussed mixtures of gases that are usu-
ally above their critical temperatures. Therefore, we were not
concerned about any of the gases condensing during a
process. Not having to deal with two phases greatly simplified
the analysis. When we are dealing with a gas–vapor mixture,
however, the vapor may condense out of the mixture during a
process, forming a two-phase mixture. This may complicate
the analysis considerably. Therefore, a gas–vapor mixture
needs to be treated differently from an ordinary gas mixture.
Several gas–vapor mixtures are encountered in engineer-
ing. In this chapter, we consider the air–water-vapor mixture,
which is the most commonly encountered gas–vapor mixture
in practice. We also discuss air-conditioning, which is the pri-
mary application area of air–water-vapor mixtures.
Objectives
The objectives of Chapter 14 are to:
• Differentiate between dry air and atmospheric air.
• Define and calculate the specific and relative humidity of
atmospheric air.
• Calculate the dew-point temperature of atmospheric air.
• Relate the adiabatic saturation temperature and wet-bulb
temperatures of atmospheric air.
• Use the psychrometric chart as a tool to determine the
properties of atmospheric air.
• Apply the principles of the conservation of mass and energy
to various air-conditioning processes.
cen84959_ch14.qxd 4/26/05 4:00 PM Page 717
14–1
DRY AND ATMOSPHERIC AIR
Air is a mixture of nitrogen, oxygen, and small amounts of some other
gases. Air in the atmosphere normally contains some water vapor (or mois-
ture) and is referred to as atmospheric air. By contrast, air that contains no
water vapor is called dry air. It is often convenient to treat air as a mixture
of water vapor and dry air since the composition of dry air remains rela-
tively constant, but the amount of water vapor changes as a result of con-
densation and evaporation from oceans, lakes, rivers, showers, and even the
human body. Although the amount of water vapor in the air is small, it plays
a major role in human comfort. Therefore, it is an important consideration
in air-conditioning applications.
The temperature of air in air-conditioning applications ranges from about
Ϫ10 to about 50°C. In this range, dry air can be treated as an ideal gas with
a constant c
p
value of 1.005 kJ/kg · K [0.240 Btu/lbm · R] with negligible
error (under 0.2 percent), as illustrated in Fig. 14–1. Taking 0°C as the ref-
erence temperature, the enthalpy and enthalpy change of dry air can be
determined from
(14–1a)
and
(14–1b)
where T is the air temperature in °C and ⌬T is the change in temperature. In
air-conditioning processes we are concerned with the changes in enthalpy
⌬h, which is independent of the reference point selected.
It certainly would be very convenient to also treat the water vapor in the
air as an ideal gas and you would probably be willing to sacrifice some
accuracy for such convenience. Well, it turns out that we can have the con-
venience without much sacrifice. At 50°C, the saturation pressure of water
is 12.3 kPa. At pressures below this value, water vapor can be treated as an
ideal gas with negligible error (under 0.2 percent), even when it is a satu-
rated vapor. Therefore, water vapor in air behaves as if it existed alone and
obeys the ideal-gas relation Pv ϭ RT. Then the atmospheric air can be
treated as an ideal-gas mixture whose pressure is the sum of the partial pres-
sure of dry air* P
a
and that of water vapor P
v
:
(14–2)
The partial pressure of water vapor is usually referred to as the vapor pres-
sure. It is the pressure water vapor would exert if it existed alone at the
temperature and volume of atmospheric air.
Since water vapor is an ideal gas, the enthalpy of water vapor is a function
of temperature only, that is, h ϭ h(T ). This can also be observed from the
T-s diagram of water given in Fig. A–9 and Fig. 14–2 where the constant-
enthalpy lines coincide with constant-temperature lines at temperatures
P ϭ P
a
ϩ P
v
¬¬
1kPa2
¢h
dry air
ϭ c
p
¢T ϭ 11.005 kJ>kg
#
°C2 ¢T
¬¬
1kJ>kg 2
h
dry air
ϭ c
p
T ϭ 11.005 kJ>kg
#
°C2T
¬¬
1kJ>kg 2
718 | Thermodynamics
T, °C
s
h = const.
50
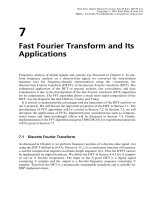
FIGURE 14–2
At temperatures below 50°C, the
h ϭ constant lines coincide with the
T ϭ constant lines in the superheated
vapor region of water.
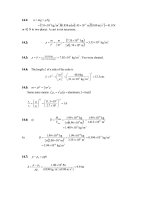
DRY AIR
T,°C c
p
,kJ/kg ·°C
–10
0
10
20
30
40
50
1.0038
1.0041
1.0045
1.0049
1.0054
1.0059
1.0065
FIGURE 14–1
The c
p
of air can be assumed to be
constant at 1.005 kJ/kg · °C in the
temperature range Ϫ10 to 50°C with
an error under 0.2 percent.
*Throughout this chapter, the subscript a denotes dry air and the subscript v denotes
water vapor.
cen84959_ch14.qxd 4/26/05 4:00 PM Page 718
below 50°C. Therefore, the enthalpy of water vapor in air can be taken to be
equal to the enthalpy of saturated vapor at the same temperature. That is,
(14–3)
The enthalpy of water vapor at 0°C is 2500.9 kJ/kg. The average c
p
value of
water vapor in the temperature range Ϫ10 to 50°C can be taken to be 1.82
kJ/kg · °C. Then the enthalpy of water vapor can be determined approxi-
mately from
(14–4)
or
(14–5)
in the temperature range Ϫ10 to 50°C (or 15 to 120°F), with negligible
error, as shown in Fig. 14–3.
14–2
SPECIFIC AND RELATIVE HUMIDITY OF AIR
The amount of water vapor in the air can be specified in various ways.
Probably the most logical way is to specify directly the mass of water vapor
present in a unit mass of dry air. This is called absolute or specific humid-
ity (also called humidity ratio) and is denoted by v:
(14–6)
The specific humidity can also be expressed as
(14–7)
or
(14–8)
where P is the total pressure.
Consider 1 kg of dry air. By definition, dry air contains no water vapor,
and thus its specific humidity is zero. Now let us add some water vapor to
this dry air. The specific humidity will increase. As more vapor or moisture
is added, the specific humidity will keep increasing until the air can hold no
more moisture. At this point, the air is said to be saturated with moisture,
and it is called saturated air. Any moisture introduced into saturated air
will condense. The amount of water vapor in saturated air at a specified
temperature and pressure can be determined from Eq. 14–8 by replacing P
v
by P
g
, the saturation pressure of water at that temperature (Fig. 14–4).
The amount of moisture in the air has a definite effect on how comfort-
able we feel in an environment. However, the comfort level depends more
on the amount of moisture the air holds (m
v
) relative to the maximum
amount of moisture the air can hold at the same temperature (m
g
). The ratio
of these two quantities is called the relative humidity f (Fig. 14–5)
(14–9)
f ϭ
m
v
m
g
ϭ
P
v
V>R
v
T
P
g
V>R
v
T
ϭ
P
v
P
g
v ϭ
0.622P
v
P Ϫ P
v
¬¬
1kg water vapor>kg dry air 2
v ϭ
m
v
m
a
ϭ
P
v
V>R
v
T
P
a
V>R
a
T
ϭ
P
v
>R
v
P
a
>R
a
ϭ 0.622
P
v
P
a
v ϭ
m
v
m
a
¬¬
1kg water vapor>kg dry air 2
h
g
1T2 Х 1060.9 ϩ 0.435T
¬¬
1Btu>lbm 2
¬¬
T in °F
h
g
1T2 Х 2500.9 ϩ 1.82T
¬¬
1kJ>kg 2
¬¬
T in °C
h
v
1T, low P2 Х h
g
1T2
Chapter 14 | 719
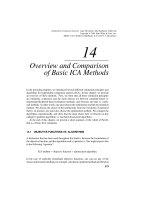
WATER VAPOR
–10
0
10
20
30
40
50
2482.1
2500.9
2519.2
2537.4
2555.6
2573.5
2591.3
2482.7
2500.9
2519.1
2537.3
2555.5
2573.7
2591.9
–0.6
0.0
0.1
0.1
0.1
–0.2
–0.6
h
g
,kJ/kg
T,°C Table A-4 Eq. 14-4
Difference,
kJ/kg
FIGURE 14–3
In the temperature range Ϫ10 to 50°C,
the h
g
of water can be determined
from Eq. 14–4 with negligible error.
AIR
AIR
25
25
°C,100 k
C,100 k
Pa
Pa
(P
sat,H
sat,H
2
O @ 25
O @ 25
°C
= 3.1698 k
= 3.1698 k
Pa)
Pa)
P
v
=
=
0
P
v
< 3.1698 k
< 3.1698 k
Pa
Pa
P
v
= 3.1698 k
= 3.1698 k
Pa
Pa
dry air
dry air
unsaturated air
unsaturated air
saturated air
saturated air
FIGURE 14–4
For saturated air, the vapor pressure is
equal to the saturation pressure of
water.
cen84959_ch14.qxd 4/29/05 11:33 AM Page 719
where
(14–10)
Combining Eqs. 14–8 and 14–9, we can also express the relative humidity as
(14–11a, b)
The relative humidity ranges from 0 for dry air to 1 for saturated air. Note
that the amount of moisture air can hold depends on its temperature. There-
fore, the relative humidity of air changes with temperature even when its
specific humidity remains constant.
Atmospheric air is a mixture of dry air and water vapor, and thus
the enthalpy of air is expressed in terms of the enthalpies of the dry air and
the water vapor. In most practical applications, the amount of dry air in the
air–water-vapor mixture remains constant, but the amount of water vapor
changes. Therefore, the enthalpy of atmospheric air is expressed per unit
mass of dry air instead of per unit mass of the air–water vapor mixture.
The total enthalpy (an extensive property) of atmospheric air is the sum of
the enthalpies of dry air and the water vapor:
Dividing by m
a
gives
or
(14–12)
since h
v
ഡ h
g
(Fig. 14–6).
Also note that the ordinary temperature of atmospheric air is frequently
referred to as the dry-bulb temperature to differentiate it from other forms
of temperatures that shall be discussed.
h ϭ h
a
ϩ vh
g
¬¬
1kJ>kg dry air 2
h ϭ
H
m
a
ϭ h
a
ϩ
m
v
m
a
h
v
ϭ h
a
ϩ vh
v
H ϭ H
a
ϩ H
v
ϭ m
a
h
a
ϩ m
v
h
v
f ϭ
vP
10.622 ϩ v2P
g
¬
and
¬
v ϭ
0.622fP
g
P Ϫ fP
g
P
g
ϭ P
sat @ T
720 | Thermodynamics
AIR
AIR
25
25
°C,1 atm
C,1 atm
m
a
=
=
1 kg
1 kg
m
v
=
=
m
v,
,
max
max
=
=
0.01 kg
0.01 kg
0.02 kg
0.02 kg
Specific humidity:
Specific humidity:
ω
= 0.01
= 0.01
Relative humidity:
Relative humidity:
φ
= 50%
= 50%
kg H
kg H
2
O
kg dry air
kg dry air
FIGURE 14–5
Specific humidity is the actual amount
of water vapor in 1 kg of dry air,
whereas relative humidity is the ratio
of the actual amount of moisture in
the air at a given temperature to the
maximum amount of moisture air can
hold at the same temperature.
moisture
ω
kg
h
g
Dry air
1 kg
h
a
(1 +
ω
) kg o
f
moist air
h = h
a
+
ω
h
g
,kJ/kg dry air
FIGURE 14–6
The enthalpy of moist (atmospheric)
air is expressed per unit mass of dry
air, not per unit mass of moist air.
T = 25°C
P = 100 kPa
φ
= 75%
ROOM
5 m × 5 m × 3 m
FIGURE 14–7
Schematic for Example 14–1.
EXAMPLE 14–1 The Amount of Water Vapor in Room Air
A 5-m ϫ 5-m ϫ 3-m room shown in Fig. 14–7 contains air at 25°C and 100
kPa at a relative humidity of 75 percent. Determine (a) the partial pressure
of dry air, (b) the specific humidity, (c) the enthalpy per unit mass of the dry
air, and (d ) the masses of the dry air and water vapor in the room.
Solution The relative humidity of air in a room is given. The dry air pres-
sure, specific humidity, enthalpy, and the masses of dry air and water vapor
in the room are to be determined.
Assumptions The dry air and the water vapor in the room are ideal gases.
Properties The constant-pressure specific heat of air at room temperature is
c
p
ϭ1.005 kJ/kg · K (Table A–2a). For water at 25°C, we have T
sat
ϭ 3.1698
kPa and h
g
ϭ 2546.5 kJ/kg (Table A–4).
cen84959_ch14.qxd 4/26/05 4:00 PM Page 720
14–3
DEW-POINT TEMPERATURE
If you live in a humid area, you are probably used to waking up most summer
mornings and finding the grass wet. You know it did not rain the night before.
So what happened? Well, the excess moisture in the air simply condensed on
the cool surfaces, forming what we call dew. In summer, a considerable
amount of water vaporizes during the day. As the temperature falls during the
Chapter 14 | 721
Analysis (a) The partial pressure of dry air can be determined from Eq. 14–2:
where
Thus,
(b) The specific humidity of air is determined from Eq. 14–8:
(c) The enthalpy of air per unit mass of dry air is determined from
Eq. 14–12:
The enthalpy of water vapor (2546.5 kJ/kg) could also be determined from
the approximation given by Eq. 14–4:
which is almost identical to the value obtained from Table A–4.
(d ) Both the dry air and the water vapor fill the entire room completely.
Therefore, the volume of each gas is equal to the volume of the room:
The masses of the dry air and the water vapor are determined from the ideal-
gas relation applied to each gas separately:
The mass of the water vapor in the air could also be determined from
Eq. 14–6:
m
v
ϭ vm
a
ϭ 10.0152 2185.61 kg2 ϭ 1.30 kg
m
v
ϭ
P
v
V
v
R
v
T
ϭ
12.38 kPa2175 m
3
2
10.4615 kPa
#
m
3
>kg
#
K21298 K2
ϭ 1.30 kg
m
a
ϭ
P
a
V
a
R
a
T
ϭ
197.62 kPa2175 m
3
2
10.287 kPa
#
m
3
>kg
#
K21298 K2
ϭ 85.61 kg
V
a
ϭ V
v
ϭ V
room
ϭ 15 m 215 m213 m2 ϭ 75 m
3
h
g @ 25°C
Х 2500.9 ϩ 1.82 1252 ϭ 2546.4 kJ>kg
ϭ 63.8 kJ
/
kg dry air
ϭ 11.005 kJ>kg
#
°C2125°C2 ϩ 10.0152212546.5 kJ>kg2
h ϭ h
a
ϩ vh
v
Х c
p
T ϩ vh
g
v ϭ
0.622P
v
P Ϫ P
v
ϭ
10.622212.38 kPa2
1100 Ϫ 2.382 kPa
ϭ 0.0152 kg H
2
O
/
kg dry air
P
a
ϭ 1100 Ϫ 2.382 kPa ϭ 97.62 kPa
P
v
ϭ fP
g
ϭ fP
sat @ 25°C
ϭ 10.75 213.1698 kPa2 ϭ 2.38 kPa
P
a
ϭ P Ϫ P
v
cen84959_ch14.qxd 4/26/05 4:00 PM Page 721
night, so does the “moisture capacity” of air, which is the maximum amount
of moisture air can hold. (What happens to the relative humidity during this
process?) After a while, the moisture capacity of air equals its moisture con-
tent. At this point, air is saturated, and its relative humidity is 100 percent.
Any further drop in temperature results in the condensation of some of the
moisture, and this is the beginning of dew formation.
The dew-point temperature T
dp
is defined as the temperature at which
condensation begins when the air is cooled at constant pressure. In other
words, T
dp
is the saturation temperature of water corresponding to the vapor
pressure:
(14–13)
This is also illustrated in Fig. 14–8. As the air cools at constant pressure, the
vapor pressure P
v
remains constant. Therefore, the vapor in the air (state 1)
undergoes a constant-pressure cooling process until it strikes the saturated
vapor line (state 2). The temperature at this point is T
dp
, and if the tempera-
ture drops any further, some vapor condenses out. As a result, the amount of
vapor in the air decreases, which results in a decrease in P
v
. The air remains
saturated during the condensation process and thus follows a path of
100 percent relative humidity (the saturated vapor line). The ordinary
temperature and the dew-point temperature of saturated air are identical.
You have probably noticed that when you buy a cold canned drink from a
vending machine on a hot and humid day, dew forms on the can. The for-
mation of dew on the can indicates that the temperature of the drink is
below the dew-point temperature of the surrounding air (Fig. 14–9).
The dew-point temperature of room air can be determined easily by cool-
ing some water in a metal cup by adding small amounts of ice and stirring.
The temperature of the outer surface of the cup when dew starts to form on
the surface is the dew-point temperature of the air.
T
dp
ϭ T
sat @ P
v
722 | Thermodynamics
T
s
T
1
T
dp
2
1
P
v
= const.
FIGURE 14–8
Constant-presssure cooling of moist
air and the dew-point temperature on
the T-s diagram of water.
MOIST
AIR
Liquid water
droplets
(dew)
T < T
dp
FIGURE 14–9
When the temperature of a cold drink
is below the dew-point temperature of
the surrounding air, it “sweats.”
COLD
OUTDOORS
10°C
AIR
20°C, 75%
Typical temperature
distribution
16°C
18°C
20°C20°C20°C
18°C
16°C
FIGURE 14–10
Schematic for Example 14–2.
EXAMPLE 14–2 Fogging of the Windows in a House
In cold weather, condensation frequently occurs on the inner surfaces of the
windows due to the lower air temperatures near the window surface. Consider
a house, shown in Fig. 14–10, that contains air at 20°C and 75 percent rela-
tive humidity. At what window temperature will the moisture in the air start
condensing on the inner surfaces of the windows?
Solution The interior of a house is maintained at a specified temperature
and humidity. The window temperature at which fogging starts is to be
determined.
Properties The saturation pressure of water at 20°C is P
sat
ϭ 2.3392 kPa
(Table A–4).
Analysis The temperature distribution in a house, in general, is not uniform.
When the outdoor temperature drops in winter, so does the indoor tempera-
ture near the walls and the windows. Therefore, the air near the walls and
the windows remains at a lower temperature than at the inner parts of a
house even though the total pressure and the vapor pressure remain constant
throughout the house. As a result, the air near the walls and the windows
undergoes a P
v
ϭ constant cooling process until the moisture in the air
cen84959_ch14.qxd 4/26/05 4:00 PM Page 722
14–4
ADIABATIC SATURATION AND
WET-BULB TEMPERATURES
Relative humidity and specific humidity are frequently used in engineering
and atmospheric sciences, and it is desirable to relate them to easily measur-
able quantities such as temperature and pressure. One way of determining
the relative humidity is to determine the dew-point temperature of air,
as discussed in the last section. Knowing the dew-point temperature, we
can determine the vapor pressure P
v
and thus the relative humidity. This
approach is simple, but not quite practical.
Another way of determining the absolute or relative humidity is related to
an adiabatic saturation process, shown schematically and on a T-s diagram
in Fig. 14–11. The system consists of a long insulated channel that contains
a pool of water. A steady stream of unsaturated air that has a specific
humidity of v
1
(unknown) and a temperature of T
1
is passed through this
channel. As the air flows over the water, some water evaporates and mixes
with the airstream. The moisture content of air increases during this process,
and its temperature decreases, since part of the latent heat of vaporization of
the water that evaporates comes from the air. If the channel is long enough,
the airstream exits as saturated air (f ϭ 100 percent) at temperature T
2
,
which is called the adiabatic saturation temperature.
If makeup water is supplied to the channel at the rate of evaporation at
temperature T
2
, the adiabatic saturation process described above can be ana-
lyzed as a steady-flow process. The process involves no heat or work inter-
actions, and the kinetic and potential energy changes can be neglected. Then
the conservation of mass and conservation of energy relations for this two-
inlet, one-exit steady-flow system reduces to the following:
Mass balance:
or
m
#
a
v
1
ϩ m
#
f
ϭ m
#
a
v
2
m
#
w
1
ϩ m
#
f
ϭ m
#
w
2
m
#
a
1
ϭ m
#
a
2
ϭ m
#
a
Chapter 14 | 723
starts condensing. This happens when the air reaches its dew-point tempera-
ture T
dp
, which is determined from Eq. 14–13 to be
where
Thus,
Discussion Note that the inner surface of the window should be maintained
above 15.4°C if condensation on the window surfaces is to be avoided.
T
dp
ϭ T
sat @ 1.754 kPa
ϭ 15.4 °C
P
v
ϭ fP
g @ 20°C
ϭ 10.75 212.3392 kPa2 ϭ 1.754 kPa
T
dp
ϭ T
sat @ P
v
T
s
2
1
Adiabatic
saturation
temperature
Dew-point
temperature
Unsaturated air
T
1
,
ω
1
f
1
Saturated air
T
2
,
ω
2
f
2
ϭ 100%
12
Liquid water
at T
2
Liquid water
P
v
1
FIGURE 14–11
The adiabatic saturation process and
its representation on a T-s diagram of
water.
(The mass flow rate of dry air
remains constant)
(The mass flow rate of vapor in the
air increases by an amount equal
to the rate of evaporation m
.
f
)
cen84959_ch14.qxd 4/26/05 4:00 PM Page 723
Thus,
Energy balance:
or
Dividing by m
.
a
gives
or
which yields
(14–14)
where, from Eq. 14–11b,
(14–15)
since f
2
ϭ 100 percent. Thus we conclude that the specific humidity (and
relative humidity) of air can be determined from Eqs. 14–14 and 14–15 by
measuring the pressure and temperature of air at the inlet and the exit of an
adiabatic saturator.
If the air entering the channel is already saturated, then the adiabatic satu-
ration temperature T
2
will be identical to the inlet temperature T
1
, in which
case Eq. 14–14 yields v
1
ϭ v
2
. In general, the adiabatic saturation tempera-
ture is between the inlet and dew-point temperatures.
The adiabatic saturation process discussed above provides a means of
determining the absolute or relative humidity of air, but it requires a long
channel or a spray mechanism to achieve saturation conditions at the exit. A
more practical approach is to use a thermometer whose bulb is covered with
a cotton wick saturated with water and to blow air over the wick, as shown in
Fig. 14–12. The temperature measured in this manner is called the wet-bulb
temperature T
wb
, and it is commonly used in air-conditioning applications.
The basic principle involved is similar to that in adiabatic saturation.
When unsaturated air passes over the wet wick, some of the water in the
wick evaporates. As a result, the temperature of the water drops, creating a
temperature difference (which is the driving force for heat transfer) between
the air and the water. After a while, the heat loss from the water by evapora-
tion equals the heat gain from the air, and the water temperature stabilizes.
The thermometer reading at this point is the wet-bulb temperature. The wet-
bulb temperature can also be measured by placing the wet-wicked ther-
mometer in a holder attached to a handle and rotating the holder rapidly,
that is, by moving the thermometer instead of the air. A device that works
v
2
ϭ
0.622P
g
2
P
2
Ϫ P
g
2
v
1
ϭ
c
p
1T
2
Ϫ T
1
2 ϩ v
2
h
fg
2
h
g
1
Ϫ h
f
2
1c
p
T
1
ϩ v
1
h
g
1
2 ϩ 1v
2
Ϫ v
1
2h
f
2
ϭ 1c
p
T
2
ϩ v
2
h
g
2
2
h
1
ϩ 1v
2
Ϫ v
1
2h
f
2
ϭ h
2
m
#
a
h
1
ϩ m
#
a
1v
2
Ϫ v
1
2h
f
2
ϭ m
#
a
h
2
m
#
a
h
1
ϩ m
#
f
h
f
2
ϭ m
#
a
h
2
E
#
in
ϭ E
#
out
¬¬
1since Q
#
ϭ 0 and W
#
ϭ 02
m
#
f
ϭ m
#
a
1v
2
Ϫ v
1
2
724 | Thermodynamics
Ordinary
thermometer
Wet-bulb
thermometer
Air
flow
Liquid
water
Wick
FIGURE 14–12
A simple arrangement to measure the
wet-bulb temperature.
cen84959_ch14.qxd 4/26/05 4:00 PM Page 724
on this principle is called a sling psychrometer and is shown in Fig. 14–13.
Usually a dry-bulb thermometer is also mounted on the frame of this device
so that both the wet- and dry-bulb temperatures can be read simultaneously.
Advances in electronics made it possible to measure humidity directly in a
fast and reliable way. It appears that sling psychrometers and wet-wicked ther-
mometers are about to become things of the past. Today, hand-held electronic
humidity measurement devices based on the capacitance change in a thin poly-
mer film as it absorbs water vapor are capable of sensing and digitally display-
ing the relative humidity within 1 percent accuracy in a matter of seconds.
In general, the adiabatic saturation temperature and the wet-bulb tempera-
ture are not the same. However, for air–water vapor mixtures at atmospheric
pressure, the wet-bulb temperature happens to be approximately equal to the
adiabatic saturation temperature. Therefore, the wet-bulb temperature T
wb
can be used in Eq. 14–14 in place of T
2
to determine the specific humidity
of air.
Chapter 14 | 725
Dry-bulb
thermometer
Wet-bulb
thermometer
wick
Wet-bulb
thermometer
FIGURE 14–13
Sling psychrometer.
EXAMPLE 14–3 The Specific and Relative Humidity of Air
The dry- and the wet-bulb temperatures of atmospheric air at 1 atm (101.325
kPa) pressure are measured with a sling psychrometer and determined to be
25 and 15°C, respectively. Determine (a) the specific humidity, (b) the rela-
tive humidity, and (c) the enthalpy of the air.
Solution Dry- and wet-bulb temperatures are given. The specific humidity,
relative humidity, and enthalpy are to be determined.
Properties The saturation pressure of water is 1.7057 kPa at 15°C, and
3.1698 kPa at 25°C (Table A–4). The constant-pressure specific heat of air
at room temperature is c
p
ϭ 1.005 kJ/kg · K (Table A–2a).
Analysis (a) The specific humidity v
1
is determined from Eq. 14–14,
where T
2
is the wet-bulb temperature and v
2
is
Thus,
(b) The relative humidity f
1
is determined from Eq. 14–11a to be
f
1
ϭ
v
1
P
2
10.622 ϩ v
1
2P
g
1
ϭ
10.0065321101.325 kPa2
10.622 ϩ 0.00653213.1698 kPa2
ϭ 0.332 or 33.2%
ϭ 0.00653 kg H
2
O
/
kg dry air
v
1
ϭ
11.005 kJ>kg
#
°C23115 Ϫ 252°C4 ϩ 10.01065 212465.4 kJ>kg2
12546.5 Ϫ 62.9822 kJ>kg
ϭ 0.01065 kg H
2
O>kg dry air
v
2
ϭ
0.622P
g
2
P
2
Ϫ P
g
2
ϭ
10.622211.7057 kPa2
1101.325 Ϫ 1.70572 kPa
v
1
ϭ
c
p
1T
2
Ϫ T
1
2 ϩ v
2
h
fg
2
h
g
1
Ϫ h
f
2
cen84959_ch14.qxd 4/26/05 4:00 PM Page 725
14–5
THE PSYCHROMETRIC CHART
The state of the atmospheric air at a specified pressure is completely speci-
fied by two independent intensive properties. The rest of the properties can
be calculated easily from the previous relations. The sizing of a typical air-
conditioning system involves numerous such calculations, which may even-
tually get on the nerves of even the most patient engineers. Therefore, there
is clear motivation to computerize calculations or to do these calculations
once and to present the data in the form of easily readable charts. Such
charts are called psychrometric charts, and they are used extensively in
air-conditioning applications. A psychrometric chart for a pressure of 1 atm
(101.325 kPa or 14.696 psia) is given in Fig. A–31 in SI units and in Fig.
A–31E in English units. Psychrometric charts at other pressures (for use at
considerably higher elevations than sea level) are also available.
The basic features of the psychrometric chart are illustrated in Fig. 14–14.
The dry-bulb temperatures are shown on the horizontal axis, and the spe-
cific humidity is shown on the vertical axis. (Some charts also show the
vapor pressure on the vertical axis since at a fixed total pressure P there is a
one-to-one correspondence between the specific humidity v and the vapor
pressure P
v
, as can be seen from Eq. 14–8.) On the left end of the chart,
there is a curve (called the saturation line) instead of a straight line. All the
saturated air states are located on this curve. Therefore, it is also the curve
of 100 percent relative humidity. Other constant relative-humidity curves
have the same general shape.
Lines of constant wet-bulb temperature have a downhill appearance to the
right. Lines of constant specific volume (in m
3
/kg dry air) look similar, except
they are steeper. Lines of constant enthalpy (in kJ/kg dry air) lie very nearly
parallel to the lines of constant wet-bulb temperature. Therefore, the constant-
wet-bulb-temperature lines are used as constant-enthalpy lines in some charts.
For saturated air, the dry-bulb, wet-bulb, and dew-point temperatures are
identical (Fig. 14–15). Therefore, the dew-point temperature of atmospheric
air at any point on the chart can be determined by drawing a horizontal line (a
line of v ϭ constant or P
v
ϭ constant) from the point to the saturated curve.
The temperature value at the intersection point is the dew-point temperature.
The psychrometric chart also serves as a valuable aid in visualizing the air-
conditioning processes. An ordinary heating or cooling process, for example,
appears as a horizontal line on this chart if no humidification or dehumidifica-
tion is involved (that is, v ϭ constant). Any deviation from a horizontal line
indicates that moisture is added or removed from the air during the process.
726 | Thermodynamics
(c) The enthalpy of air per unit mass of dry air is determined from Eq. 14–12:
Discussion The previous property calculations can be performed easily using
EES or other programs with built-in psychrometric functions.
ϭ 41.8 kJ
/
kg dry air
ϭ 11.005 kJ>kg
#
°C2125°C2 ϩ 10.00653212546.5 kJ>kg2
h
1
ϭ h
a
1
ϩ v
1
h
v
1
Х c
p
T
1
ϩ v
1
h
g
1
Dry-bulb temperature
Specific humidity,
ω
Saturation line,
φ
= 100%
φ
= const.
T
wb
= const.
h
= const.
v
= const.
FIGURE 14–14
Schematic for a psychrometric chart.
Saturation line
T
dp
=
15°C
T
db
=
15°C
T
wb
=
15°C
15°C
15°C
FIGURE 14–15
For saturated air, the dry-bulb,
wet-bulb, and dew-point
temperatures are identical.
cen84959_ch14.qxd 4/26/05 4:00 PM Page 726
14–6
HUMAN COMFORT AND AIR-CONDITIONING
Human beings have an inherent weakness—they want to feel comfortable.
They want to live in an environment that is neither hot nor cold, neither
humid nor dry. However, comfort does not come easily since the desires of
the human body and the weather usually are not quite compatible. Achieving
comfort requires a constant struggle against the factors that cause discomfort,
such as high or low temperatures and high or low humidity. As engineers, it
is our duty to help people feel comfortable. (Besides, it keeps us employed.)
Chapter 14 | 727
EXAMPLE 14–4 The Use of the Psychrometric Chart
Consider a room that contains air at 1 atm, 35°C, and 40 percent relative
humidity. Using the psychrometric chart, determine (a) the specific humidity,
(b) the enthalpy, (c) the wet-bulb temperature, (d ) the dew-point tempera-
ture, and (e) the specific volume of the air.
Solution The relative humidity of air in a room is given. The specific humid-
ity, enthalpy, wet-bulb temperature, dew-point temperature, and specific vol-
ume of the air are to be determined using the psychrometric chart.
Analysis At a given total pressure, the state of atmospheric air is completely
specified by two independent properties such as the dry-bulb temperature
and the relative humidity. Other properties are determined by directly read-
ing their values at the specified state.
(a) The specific humidity is determined by drawing a horizontal line from the
specified state to the right until it intersects with the v axis, as shown in
Fig. 14–16. At the intersection point we read
(b) The enthalpy of air per unit mass of dry air is determined by drawing a
line parallel to the h ϭ constant lines from the specific state until it inter-
sects the enthalpy scale, giving
(c) The wet-bulb temperature is determined by drawing a line parallel to the
T
wb
ϭ constant lines from the specified state until it intersects the satura-
tion line, giving
(d ) The dew-point temperature is determined by drawing a horizontal line from
the specified state to the left until it intersects the saturation line, giving
(e) The specific volume per unit mass of dry air is determined by noting the
distances between the specified state and the v ϭ constant lines on both sides
of the point. The specific volume is determined by visual interpolation to be
Discussion Values read from the psychrometric chart inevitably involve read-
ing errors, and thus are of limited accuracy.
v ϭ 0.893 m
3
/
kg dry air
T
dp
ϭ 19.4°C
T
wb
ϭ 24°C
h ϭ 71.5 kJ
/
kg dry air
v ϭ 0.0142 kg H
2
O
/
kg dry air
T = 35°C
T
dp
T
wb
h
φ
= 40%
ω
v
FIGURE 14–16
Schematic for Example 14–4.
cen84959_ch14.qxd 4/26/05 4:00 PM Page 727
It did not take long for people to realize that they could not change the
weather in an area. All they can do is change it in a confined space such as a
house or a workplace (Fig. 14–17). In the past, this was partially accomplished
by fire and simple indoor heating systems. Today, modern air-conditioning
systems can heat, cool, humidify, dehumidify, clean, and even deodorize the
air–in other words, condition the air to peoples’ desires. Air-conditioning sys-
tems are designed to satisfy the needs of the human body; therefore, it is
essential that we understand the thermodynamic aspects of the body.
The human body can be viewed as a heat engine whose energy input is
food. As with any other heat engine, the human body generates waste heat
that must be rejected to the environment if the body is to continue operat-
ing. The rate of heat generation depends on the level of the activity. For an
average adult male, it is about 87 W when sleeping, 115 W when resting or
doing office work, 230 W when bowling, and 440 W when doing heavy
physical work. The corresponding numbers for an adult female are about
15 percent less. (This difference is due to the body size, not the body
temperature. The deep-body temperature of a healthy person is maintained
constant at about 37°C.) A body will feel comfortable in environments in
which it can dissipate this waste heat comfortably (Fig. 14–18).
Heat transfer is proportional to the temperature difference. Therefore in
cold environments, a body loses more heat than it normally generates,
which results in a feeling of discomfort. The body tries to minimize the
energy deficit by cutting down the blood circulation near the skin (causing a
pale look). This lowers the skin temperature, which is about 34°C for an
average person, and thus the heat transfer rate. A low skin temperature
causes discomfort. The hands, for example, feel painfully cold when the
skin temperature reaches 10°C (50°F). We can also reduce the heat loss
from the body either by putting barriers (additional clothes, blankets, etc.)
in the path of heat or by increasing the rate of heat generation within the
body by exercising. For example, the comfort level of a resting person
dressed in warm winter clothing in a room at 10°C (50°F) is roughly equal
to the comfort level of an identical person doing moderate work in a room
at about Ϫ23°C (Ϫ10°F). Or we can just cuddle up and put our hands
between our legs to reduce the surface area through which heat flows.
In hot environments, we have the opposite problem—we do not seem to
be dissipating enough heat from our bodies, and we feel as if we are going
to burst. We dress lightly to make it easier for heat to get away from our
bodies, and we reduce the level of activity to minimize the rate of waste
heat generation in the body. We also turn on the fan to continuously replace
the warmer air layer that forms around our bodies as a result of body heat
by the cooler air in other parts of the room. When doing light work or walk-
ing slowly, about half of the rejected body heat is dissipated through perspi-
ration as latent heat while the other half is dissipated through convection and
radiation as sensible heat. When resting or doing office work, most of the
heat (about 70 percent) is dissipated in the form of sensible heat whereas
when doing heavy physical work, most of the heat (about 60 percent) is dis-
sipated in the form of latent heat. The body helps out by perspiring or sweat-
ing more. As this sweat evaporates, it absorbs latent heat from the body and
cools it. Perspiration is not much help, however, if the relative humidity of
728 | Thermodynamics
FIGURE 14–17
We cannot change the weather, but we
can change the climate in a confined
space by air-conditioning.
© Vol. 77/PhotoDisc
23°C
Waste
heat
37°C
FIGURE 14–18
A body feels comfortable when it can
freely dissipate its waste heat, and no
more.
cen84959_ch14.qxd 4/27/05 10:46 AM Page 728
the environment is close to 100 percent. Prolonged sweating without any
fluid intake causes dehydration and reduced sweating, which may lead to a
rise in body temperature and a heat stroke.
Another important factor that affects human comfort is heat transfer by
radiation between the body and the surrounding surfaces such as walls and
windows. The sun’s rays travel through space by radiation. You warm up in
front of a fire even if the air between you and the fire is quite cold. Likewise,
in a warm room you feel chilly if the ceiling or the wall surfaces are at a
considerably lower temperature. This is due to direct heat transfer between
your body and the surrounding surfaces by radiation. Radiant heaters are
commonly used for heating hard-to-heat places such as car repair shops.
The comfort of the human body depends primarily on three factors: the
(dry-bulb) temperature, relative humidity, and air motion (Fig. 14–19). The
temperature of the environment is the single most important index of com-
fort. Most people feel comfortable when the environment temperature is
between 22 and 27°C (72 and 80°F). The relative humidity also has a con-
siderable effect on comfort since it affects the amount of heat a body can
dissipate through evaporation. Relative humidity is a measure of air’s ability
to absorb more moisture. High relative humidity slows down heat rejection
by evaporation, and low relative humidity speeds it up. Most people prefer a
relative humidity of 40 to 60 percent.
Air motion also plays an important role in human comfort. It removes the
warm, moist air that builds up around the body and replaces it with fresh
air. Therefore, air motion improves heat rejection by both convection and
evaporation. Air motion should be strong enough to remove heat and mois-
ture from the vicinity of the body, but gentle enough to be unnoticed. Most
people feel comfortable at an airspeed of about 15 m/min. Very-high-speed
air motion causes discomfort instead of comfort. For example, an environ-
ment at 10°C (50°F) with 48 km/h winds feels as cold as an environment at
Ϫ7°C (20°F) with 3 km/h winds as a result of the body-chilling effect of the
air motion (the wind-chill factor). Other factors that affect comfort are air
cleanliness, odor, noise, and radiation effect.
14–7
AIR-CONDITIONING PROCESSES
Maintaining a living space or an industrial facility at the desired temperature
and humidity requires some processes called air-conditioning processes.
These processes include simple heating (raising the temperature), simple cool-
ing (lowering the temperature), humidifying (adding moisture), and dehumidi-
fying (removing moisture). Sometimes two or more of these processes are
needed to bring the air to a desired temperature and humidity level.
Various air-conditioning processes are illustrated on the psychrometric
chart in Fig. 14–20. Notice that simple heating and cooling processes appear
as horizontal lines on this chart since the moisture content of the air remains
constant (v ϭ constant) during these processes. Air is commonly heated
and humidified in winter and cooled and dehumidified in summer. Notice
how these processes appear on the psychrometric chart.
Chapter 14 | 729
23°C
f = 50%
Air motion
15 m/min
FIGURE 14–19
A comfortable environment.
© Reprinted with special permission of King
Features Syndicate.
Cooling
Heating
Humidifying
Dehumidifying
Cooling and
dehumidifying
Heating and
humidifying
FIGURE 14–20
Various air-conditioning processes.
cen84959_ch14.qxd 4/26/05 4:00 PM Page 729
Most air-conditioning processes can be modeled as steady-flow processes,
and thus the mass balance relation m
.
in
ϭ m
.
out
can be expressed for dry air
and water as
Mass balance for dry air: (14–16)
Mass balance for water: (14–17)
Disregarding the kinetic and potential energy changes, the steady-flow
energy balance relation E
.
in
ϭ E
.
out
can be expressed in this case as
(14–18)
The work term usually consists of the fan work input, which is small rela-
tive to the other terms in the energy balance relation. Next we examine
some commonly encountered processes in air-conditioning.
Simple Heating and Cooling (V ؍ constant)
Many residential heating systems consist of a stove, a heat pump, or an elec-
tric resistance heater. The air in these systems is heated by circulating it
through a duct that contains the tubing for the hot gases or the electric resis-
tance wires, as shown in Fig. 14–21. The amount of moisture in the air
remains constant during this process since no moisture is added to or
removed from the air. That is, the specific humidity of the air remains con-
stant (v ϭ constant) during a heating (or cooling) process with no humidifi-
cation or dehumidification. Such a heating process proceeds in the direction
of increasing dry-bulb temperature following a line of constant specific
humidity on the psychrometric chart, which appears as a horizontal line.
Notice that the relative humidity of air decreases during a heating process
even if the specific humidity v remains constant. This is because the relative
humidity is the ratio of the moisture content to the moisture capacity of air
at the same temperature, and moisture capacity increases with temperature.
Therefore, the relative humidity of heated air may be well below comfort-
able levels, causing dry skin, respiratory difficulties, and an increase in
static electricity.
A cooling process at constant specific humidity is similar to the heating
process discussed above, except the dry-bulb temperature decreases and the
relative humidity increases during such a process, as shown in Fig. 14–22.
Cooling can be accomplished by passing the air over some coils through
which a refrigerant or chilled water flows.
The conservation of mass equations for a heating or cooling process that
involves no humidification or dehumidification reduce to m
.
a
1
ϭ m
.
a
2
ϭ m
.
a for
dry air and v
1
ϭ v
2
for water. Neglecting any fan work that may be present,
the conservation of energy equation in this case reduces to
where h
1
and h
2
are enthalpies per unit mass of dry air at the inlet and the
exit of the heating or cooling section, respectively.
Q
#
ϭ m
#
a
1h
2
Ϫ h
1
2
¬
or
¬
q ϭ h
2
Ϫ h
1
Q
#
in
ϩ W
#
in
ϩ
a
in
m
#
h ϭ Q
#
out
ϩ W
#
out
ϩ
a
out
m
#
h
a
in
m
#
w
ϭ
a
out
m
#
w
¬
or
¬
a
in
m
#
a
v ϭ
a
out
m
#
a
v
a
in
m
#
a
ϭ
a
out
m
#
a
¬¬
1kg>s 2
730 | Thermodynamics
ω
2
=
ω
1
Heating coils
Heat
Air
T
2
T
1
, ω
1
,
f
1
f
2
< f
1
FIGURE 14–21
During simple heating, specific
humidity remains constant, but relative
humidity decreases.
1
2
12°C30°C
v = constant
Cooling
f
2
= 80%
f
1
= 30%
FIGURE 14–22
During simple cooling, specific
humidity remains constant, but relative
humidity increases.
cen84959_ch14.qxd 4/27/05 10:46 AM Page 730
Heating with Humidification
Problems associated with the low relative humidity resulting from simple
heating can be eliminated by humidifying the heated air. This is accom-
plished by passing the air first through a heating section (process 1-2) and
then through a humidifying section (process 2-3), as shown in Fig. 14–23.
The location of state 3 depends on how the humidification is accom-
plished. If steam is introduced in the humidification section, this will result
in humidification with additional heating (T
3
Ͼ T
2
). If humidification is
accomplished by spraying water into the airstream instead, part of the latent
heat of vaporization comes from the air, which results in the cooling of the
heated airstream (T
3
Ͻ T
2
). Air should be heated to a higher temperature in
the heating section in this case to make up for the cooling effect during the
humidification process.
EXAMPLE 14–5 Heating and Humidification of Air
An air-conditioning system is to take in outdoor air at 10°C and 30 percent
relative humidity at a steady rate of 45 m
3
/min and to condition it to 25°C
and 60 percent relative humidity. The outdoor air is first heated to 22°C in
the heating section and then humidified by the injection of hot steam in the
humidifying section. Assuming the entire process takes place at a pressure
of 100 kPa, determine (a) the rate of heat supply in the heating section and
(b) the mass flow rate of the steam required in the humidifying section.
Solution Outdoor air is first heated and then humidified by steam injec-
tion. The rate of heat transfer and the mass flow rate of steam are to be
determined.
Assumptions 1 This is a steady-flow process and thus the mass flow rate of
dry air remains constant during the entire process. 2 Dry air and water vapor
are ideal gases. 3 The kinetic and potential energy changes are negligible.
Properties The constant-pressure specific heat of air at room temperature is
c
p
ϭ 1.005 kJ/kg · K, and its gas constant is R
a
ϭ 0.287 kJ/kg · K (Table
A–2a). The saturation pressure of water is 1.2281 kPa at 10°C, and 3.1698
kPa at 25°C. The enthalpy of saturated water vapor is 2519.2 kJ/kg at 10°C,
and 2541.0 kJ/kg at 22°C (Table A–4).
Analysis We take the system to be the heating or the humidifying section,
as appropriate. The schematic of the system and the psychrometric chart of
the process are shown in Fig. 14–24. We note that the amount of water
vapor in the air remains constant in the heating section (v
1
ϭ v
2
) but
increases in the humidifying section (v
3
Ͼ v
2
).
(a) Applying the mass and energy balances on the heating section gives
Dry air mass balance:
Water mass balance:
Energy balance:
The psychrometric chart offers great convenience in determining the properties
of moist air. However, its use is limited to a specified pressure only, which is 1
atm (101.325 kPa) for the one given in the appendix. At pressures other than
Q
#
in
ϩ m
#
a
h
1
ϭ m
#
a
h
2
¬
S
¬
Q
#
in
ϭ m
#
a
1h
2
Ϫ h
1
2
m
#
a
1
v
1
ϭ m
#
a
2
v
2
¬
S
¬
v
1
ϭ v
2
m
#
a
1
ϭ m
#
a
2
ϭ m
#
a
Chapter 14 | 731
Air
Heating
coils
ω
2
=
ω
1
12
3
Heating
section
Humidifying
section
ω
3
>
ω
2
Humidifier
FIGURE 14–23
Heating with humidification.
·
Air
1
2
3
V
1
= 45 m
3
/min
10°C22°C25°C
12
3
1
= 30%
3
= 60%
T
1
= 10°C
T
2
= 22°C
T
3
= 25°C
Humidifier
f
1
= 30% f
3
= 60%
Heating
coils
f
f
FIGURE 14–24
Schematic and psychrometric chart for
Example 14–5.
cen84959_ch14.qxd 4/26/05 4:01 PM Page 731
1 atm, either other charts for that pressure or the relations developed earlier
should be used. In our case, the choice is clear:
since v
2
ϭ v
1
. Then the rate of heat transfer to air in the heating section
becomes
(b) The mass balance for water in the humidifying section can be expressed as
or
where
Thus,
Discussion The result 0.539 kg/min corresponds to a water requirement of
close to one ton a day, which is significant.
Cooling with Dehumidification
The specific humidity of air remains constant during a simple cooling
process, but its relative humidity increases. If the relative humidity reaches
undesirably high levels, it may be necessary to remove some moisture from
the air, that is, to dehumidify it. This requires cooling the air below its dew-
point temperature.
ϭ 0.539 kg
/
min
m
#
w
ϭ 155.2 kg>min210.01206 Ϫ 0.0023 2
ϭ 0.01206 kg H
2
O>kg dry air
v
3
ϭ
0.622f
3
P
g
3
P
3
Ϫ f
3
P
g
3
ϭ
0.622 10.60213.1698 kPa2
3100 Ϫ 10.60 213.169824 kPa
m
#
w
ϭ m
#
a
1v
3
Ϫ v
2
2
m
#
a
2
v
2
ϩ m
#
w
ϭ m
#
a
3
v
3
ϭ 673 kJ
/
min
Q
#
in
ϭ m
#
a
1h
2
Ϫ h
1
2 ϭ 155.2 kg>min 23128.0 Ϫ 15.82 kJ>kg 4
ϭ 28.0 kJ>kg dry air
h
2
ϭ c
p
T
2
ϩ v
2
h
g
2
ϭ 11.005 kJ>kg
#
°C2122°C2 ϩ 10.0023212541.0 kJ>kg2
ϭ 15.8 kJ>kg dry air
h
1
ϭ c
p
T
1
ϩ v
1
h
g
1
ϭ 11.005 kJ>kg
#
°C2110°C2 ϩ 10.0023212519.2 kJ>kg2
v
1
ϭ
0.622P
v
1
P
1
Ϫ P
v
1
ϭ
0.622 10.368 kPa2
1100 Ϫ 0.3682 kPa
ϭ 0.0023 kg H
2
O>kg dry air
m
#
a
ϭ
V
#
1
v
1
ϭ
45 m
3
>min
0.815 m
3
>kg
ϭ 55.2 kg>min
v
1
ϭ
R
a
T
1
P
a
ϭ
10.287 kPa
#
m
3
>kg
#
K21283 K2
99.632 kPa
ϭ 0.815 m
3
>kg dry air
P
a
1
ϭ P
1
Ϫ P
v
1
ϭ 1100 Ϫ 0.3682 kPa ϭ 99.632 kPa
P
v
1
ϭ f
1
P
g
1
ϭ fP
sat @ 10°C
ϭ 10.3 211.2281 kPa2 ϭ 0.368 kPa
732 | Thermodynamics
cen84959_ch14.qxd 4/26/05 4:01 PM Page 732
The cooling process with dehumidifying is illustrated schematically and
on the psychrometric chart in Fig. 14–25 in conjunction with Example
14–6. Hot, moist air enters the cooling section at state 1. As it passes
through the cooling coils, its temperature decreases and its relative humidity
increases at constant specific humidity. If the cooling section is sufficiently
long, air reaches its dew point (state x, saturated air). Further cooling of air
results in the condensation of part of the moisture in the air. Air remains sat-
urated during the entire condensation process, which follows a line of 100
percent relative humidity until the final state (state 2) is reached. The water
vapor that condenses out of the air during this process is removed from the
cooling section through a separate channel. The condensate is usually
assumed to leave the cooling section at T
2
.
The cool, saturated air at state 2 is usually routed directly to the room,
where it mixes with the room air. In some cases, however, the air at state 2
may be at the right specific humidity but at a very low temperature. In such
cases, air is passed through a heating section where its temperature is raised
to a more comfortable level before it is routed to the room.
EXAMPLE 14–6 Cooling and Dehumidification of Air
Air enters a window air conditioner at 1 atm, 30°C, and 80 percent relative
humidity at a rate of 10 m
3
/min, and it leaves as saturated air at 14°C. Part
of the moisture in the air that condenses during the process is also removed
at 14°C. Determine the rates of heat and moisture removal from the air.
Solution Air is cooled and dehumidified by a window air conditioner. The
rates of heat and moisture removal are to be determined.
Assumptions 1 This is a steady-flow process and thus the mass flow rate of dry
air remains constant during the entire process. 2 Dry air and the water vapor
are ideal gases. 3 The kinetic and potential energy changes are negligible.
Properties The enthalpy of saturated liquid water at 14°C is 58.8 kJ/kg
(Table A–4). Also, the inlet and the exit states of the air are completely spec-
ified, and the total pressure is 1 atm. Therefore, we can determine the prop-
erties of the air at both states from the psychrometric chart to be
h
1
ϭ 85.4 kJ/kg dry air h
2
ϭ 39.3 kJ/kg dry air
v
1
ϭ 0.0216 kg H
2
O/kg dry air and v
2
ϭ 0.0100 kg H
2
O/kg dry air
v
1
ϭ 0.889 m
3
/kg dry air
Analysis We take the cooling section to be the system. The schematic of
the system and the psychrometric chart of the process are shown in Fig.
14–25. We note that the amount of water vapor in the air decreases during
the process (v
2
Ͻ v
1
) due to dehumidification. Applying the mass and
energy balances on the cooling and dehumidification section gives
Dry air mass balance:
Water mass balance:
Energy balance:
a
in
m
#
h ϭ Q
#
out
ϩ
a
out
m
#
h
¬
S
¬
Q
#
out
ϭ m
#
1h
1
Ϫ h
2
2 Ϫ m
#
w
h
w
m
#
a
1
v
1
ϭ m
#
a
2
v
2
ϩ m
#
w
¬
S
¬
m
#
w
ϭ m
#
a
1v
1
Ϫ v
2
2
m
#
a
1
ϭ m
#
a
2
ϭ m
#
a
Chapter 14 | 733
·
Air
Cooling coils
21
14°C30°C
1
2
f
1
= 80%
f
2
= 100%
T
2
= 14°C
f
2
= 100%
T
1
= 30°C
f
1
= 80%
V
1
= 10 m
3
/min
Condensate
removal
14°C
Condensate
x
FIGURE 14–25
Schematic and psychrometric chart for
Example 14–6.
cen84959_ch14.qxd 4/26/05 4:01 PM Page 733
Then,
Therefore, this air-conditioning unit removes moisture and heat from the air
at rates of 0.131 kg/min and 511 kJ/min, respectively.
Evaporative Cooling
Conventional cooling systems operate on a refrigeration cycle, and they can
be used in any part of the world. But they have a high initial and operating
cost. In desert (hot and dry) climates, we can avoid the high cost of cooling
by using evaporative coolers, also known as swamp coolers.
Evaporative cooling is based on a simple principle: As water evaporates,
the latent heat of vaporization is absorbed from the water body and the sur-
rounding air. As a result, both the water and the air are cooled during the
process. This approach has been used for thousands of years to cool water.
A porous jug or pitcher filled with water is left in an open, shaded area.
A small amount of water leaks out through the porous holes, and the pitcher
“sweats.” In a dry environment, this water evaporates and cools the remain-
ing water in the pitcher (Fig. 14–26).
You have probably noticed that on a hot, dry day the air feels a lot cooler
when the yard is watered. This is because water absorbs heat from the air as
it evaporates. An evaporative cooler works on the same principle. The evap-
orative cooling process is shown schematically and on a psychrometric chart
in Fig. 14–27. Hot, dry air at state 1 enters the evaporative cooler, where it
is sprayed with liquid water. Part of the water evaporates during this process
by absorbing heat from the airstream. As a result, the temperature of the
airstream decreases and its humidity increases (state 2). In the limiting case,
the air leaves the evaporative cooler saturated at state 2Ј. This is the lowest
temperature that can be achieved by this process.
The evaporative cooling process is essentially identical to the adiabatic satu-
ration process since the heat transfer between the airstream and the surround-
ings is usually negligible. Therefore, the evaporative cooling process follows a
line of constant wet-bulb temperature on the psychrometric chart. (Note that
this will not exactly be the case if the liquid water is supplied at a temperature
different from the exit temperature of the airstream.) Since the constant-wet-
bulb-temperature lines almost coincide with the constant-enthalpy lines, the
enthalpy of the airstream can also be assumed to remain constant. That is,
(14–19)
and
(14–20)
during an evaporative cooling process. This is a reasonably accurate approx-
imation, and it is commonly used in air-conditioning calculations.
h Х constant
T
wb
Х constant
ϭ 511 kJ
/
min
Q
#
out
ϭ 111.25 kg>min23185.4 Ϫ 39.32 kJ>kg 4 Ϫ 10.131 kg>min2158.8 kJ>kg2
m
#
w
ϭ 111.25 kg>min210.0216 Ϫ 0.0100 2 ϭ 0.131 kg
/
min
m
#
a
ϭ
V
#
1
v
1
ϭ
10 m
3
>min
0.889 m
3
>kg dry air
ϭ 11.25 kg>min
734 | Thermodynamics
Water that
leaks out
Hot, dry
air
FIGURE 14–26
Water in a porous jug left in an open,
breezy area cools as a result of
evaporative cooling.
HOT,
DRY
AIR
2
1
1
2
2'
COOL,
MOIST
AIR
Liquid
water
T
wb
= const.
h = const.
~
~
FIGURE 14–27
Evaporative cooling.
cen84959_ch14.qxd 4/26/05 4:01 PM Page 734
EXAMPLE 14–7 Evaporative Cooling of Air by a Swamp Cooler
Air enters an evaporative (or swamp) cooler at 14.7 psi, 95°F, and 20 percent
relative humidity, and it exits at 80 percent relative humidity. Determine
(a) the exit temperature of the air and (b) the lowest temperature to which
the air can be cooled by this evaporative cooler.
Solution Air is cooled steadily by an evaporative cooler. The temperature
of discharged air and the lowest temperature to which the air can be cooled
are to be determined.
Analysis The schematic of the evaporative cooler and the psychrometric
chart of the process are shown in Fig. 14–28.
(a) If we assume the liquid water is supplied at a temperature not much dif-
ferent from the exit temperature of the airstream, the evaporative cooling
process follows a line of constant wet-bulb temperature on the psychrometric
chart. That is,
The wet-bulb temperature at 95°F and 20 percent relative humidity is deter-
mined from the psychrometric chart to be 66.0°F. The intersection point of
the T
wb
ϭ 66.0°F and the f ϭ 80 percent lines is the exit state of the air.
The temperature at this point is the exit temperature of the air, and it is
determined from the psychrometric chart to be
(b) In the limiting case, air leaves the evaporative cooler saturated (f ϭ 100
percent), and the exit state of the air in this case is the state where the T
wb
ϭ 66.0°F line intersects the saturation line. For saturated air, the dry- and
the wet-bulb temperatures are identical. Therefore, the lowest temperature to
which air can be cooled is the wet-bulb temperature, which is
Discussion Note that the temperature of air drops by as much as 30°F in
this case by evaporative cooling.
Adiabatic Mixing of Airstreams
Many air-conditioning applications require the mixing of two airstreams.
This is particularly true for large buildings, most production and process
plants, and hospitals, which require that the conditioned air be mixed with a
certain fraction of fresh outside air before it is routed into the living space.
The mixing is accomplished by simply merging the two airstreams, as
shown in Fig. 14–29.
The heat transfer with the surroundings is usually small, and thus the mix-
ing processes can be assumed to be adiabatic. Mixing processes normally
involve no work interactions, and the changes in kinetic and potential ener-
gies, if any, are negligible. Then the mass and energy balances for the adia-
batic mixing of two airstreams reduce to
Mass of dry air: (14–21)
Mass of water vapor: (14–22)
Energy: (14–23)
m
#
a
1
h
1
ϩ m
#
a
2
h
2
ϭ m
#
a
3
h
3
v
1
m
#
a
1
ϩ v
2
m
#
a
2
ϭ v
3
m
#
a
3
m
#
a
1
ϩ m
#
a
2
ϭ m
#
a
3
T
min
ϭ T
2¿
ϭ 66.0°F
T
2
ϭ 70.4°F
T
wb
Х constant
Chapter 14 | 735
2'
1
1
2
2'
AIR
T
min
T
2
95°F
2
T
1
= 95°F
f = 20%
P = 14.7 psia
f
2
= 80%
f
1
= 20%
FIGURE 14–28
Schematic and psychrometric chart for
Example 14–7.
cen84959_ch14.qxd 4/26/05 4:01 PM Page 735
Eliminating m
.
a
3
from the relations above, we obtain
(14–24)
This equation has an instructive geometric interpretation on the psychro-
metric chart. It shows that the ratio of v
2
Ϫ v
3
to v
3
Ϫ v
1
is equal to the
ratio of m
.
a
1
to m
.
a
2
. The states that satisfy this condition are indicated by the
dashed line AB. The ratio of h
2
Ϫ h
3
to h
3
Ϫ h
1
is also equal to the ratio of
m
.
a
1
to m
.
a
2
, and the states that satisfy this condition are indicated by the dashed
line CD. The only state that satisfies both conditions is the intersection point
of these two dashed lines, which is located on the straight line connecting
states 1 and 2. Thus we conclude that when two airstreams at two different
states (states 1 and 2) are mixed adiabatically, the state of the mixture (state 3)
lies on the straight line connecting states 1 and 2 on the psychrometric chart,
and the ratio of the distances 2-3 and 3-1 is equal to the ratio of mass flow
rates m
.
a
1
and m
.
a
2
.
The concave nature of the saturation curve and the conclusion above lead
to an interesting possibility. When states 1 and 2 are located close to the sat-
uration curve, the straight line connecting the two states will cross the satu-
ration curve, and state 3 may lie to the left of the saturation curve. In this
case, some water will inevitably condense during the mixing process.
EXAMPLE 14–8 Mixing of Conditioned Air with Outdoor Air
Saturated air leaving the cooling section of an air-conditioning system at
14°C at a rate of 50 m
3
/min is mixed adiabatically with the outside air at
32°C and 60 percent relative humidity at a rate of 20 m
3
/min. Assuming that
the mixing process occurs at a pressure of 1 atm, determine the specific
humidity, the relative humidity, the dry-bulb temperature, and the volume
flow rate of the mixture.
Solution Conditioned air is mixed with outside air at specified rates. The
specific and relative humidities, dry-bulb temperature, and the flow rate of
the mixture are to be determined.
Assumptions 1 Steady operating conditions exist. 2 Dry air and water vapor
are ideal gases. 3 The kinetic and potential energy changes are negligible.
4 The mixing section is adiabatic.
Properties The properties of each inlet stream are determined from the psy-
chrometric chart to be
and
v
2
ϭ 0.889 m
3
>kg dry air
v
2
ϭ 0.0182 kg H
2
O>kg dry air
h
2
ϭ 79.0 kJ>kg dry air
v
1
ϭ 0.826 m
3
>kg dry air
v
1
ϭ 0.010 kg H
2
O>kg dry air
h
1
ϭ 39.4 kJ>kg dry air
m
#
a
1
m
#
a
2
ϭ
v
2
Ϫ v
3
v
3
Ϫ v
1
ϭ
h
2
Ϫ h
3
h
3
Ϫ h
1
736 | Thermodynamics
1
2
3
A
C
h
2
h
3
h
1
D
ω
2
–
ω
3
ω
3
–
ω
1
ω
2
ω
3
ω
1
B
2
1
3
Mixing
section
ω
1
h
1
ω
2
h
2
ω
3
h
3
h
2
– h
3
h
3
– h
1
FIGURE 14–29
When two airstreams at states 1 and 2
are mixed adiabatically, the state of
the mixture lies on the straight line
connecting the two states.
cen84959_ch14.qxd 4/26/05 4:01 PM Page 736
Chapter 14 | 737
Analysis We take the mixing section of the streams as the system. The
schematic of the system and the psychrometric chart of the process are
shown in Fig. 14–30. We note that this is a steady-flow mixing process.
The mass flow rates of dry air in each stream are
From the mass balance of dry air,
The specific humidity and the enthalpy of the mixture can be determined
from Eq. 14–24,
which yield
These two properties fix the state of the mixture. Other properties of the mix-
ture are determined from the psychrometric chart:
Finally, the volume flow rate of the mixture is determined from
Discussion Notice that the volume flow rate of the mixture is approximately
equal to the sum of the volume flow rates of the two incoming streams. This
is typical in air-conditioning applications.
Wet Cooling Towers
Power plants, large air-conditioning systems, and some industries generate
large quantities of waste heat that is often rejected to cooling water from
nearby lakes or rivers. In some cases, however, the cooling water supply is
limited or thermal pollution is a serious concern. In such cases, the waste
heat must be rejected to the atmosphere, with cooling water recirculating
and serving as a transport medium for heat transfer between the source and
the sink (the atmosphere). One way of achieving this is through the use of
wet cooling towers.
A wet cooling tower is essentially a semienclosed evaporative cooler. An
induced-draft counterflow wet cooling tower is shown schematically in
V
#
3
ϭ m
#
a
3
v
3
ϭ 183 kg>min210.844 m
3
>kg2 ϭ 70.1 m
3
/
min
v
3
ϭ 0.844 m
3
>kg dry air
f
3
ϭ 89%
T
3
ϭ 19.0°C
h
3
ϭ 50.1 kJ>kg dry air
v
3
ϭ 0.0122 kg H
2
O
/
kg dry air
60.5
22.5
ϭ
0.0182 Ϫ v
3
v
3
Ϫ 0.010
ϭ
79.0 Ϫ h
3
h
3
Ϫ 39.4
m
#
a
1
m
#
a
2
ϭ
v
2
Ϫ v
3
v
3
Ϫ v
1
ϭ
h
2
Ϫ h
3
h
3
Ϫ h
1
m
#
a
3
ϭ m
#
a
1
ϩ m
#
a
2
ϭ 160.5 ϩ 22.52 kg>min ϭ 83 kg>min
m
#
a
2
ϭ
V
#
2
v
2
ϭ
20 m
3
>min
0.889 m
3
>kg dry air
ϭ 22.5 kg>min
m
#
a
1
ϭ
V
#
1
v
1
ϭ
50 m
3
>min
0.826 m
3
>kg dry air
ϭ 60.5 kg>min
·
·
T
2
= 32°C
f
2
= 60%
V
2
= 20 m
3
/min
Saturated air
T
1
= 14°C
V
1
= 50 m
3
/min
2
1
3
Mixing
section
P = 1 atm
V
3
v
3
f
3
T
3
2
3
1
14°C32°C
f
1
= 100%
f
2
= 60%
·
FIGURE 14–30
Schematic and psychrometric chart for
Example 14–8.
cen84959_ch14.qxd 4/26/05 4:01 PM Page 737
Fig. 14–31. Air is drawn into the tower from the bottom and leaves through
the top. Warm water from the condenser is pumped to the top of the tower
and is sprayed into this airstream. The purpose of spraying is to expose a
large surface area of water to the air. As the water droplets fall under the
influence of gravity, a small fraction of water (usually a few percent) evapo-
rates and cools the remaining water. The temperature and the moisture content
of the air increase during this process. The cooled water collects at the bottom
of the tower and is pumped back to the condenser to absorb additional waste
heat. Makeup water must be added to the cycle to replace the water lost by
evaporation and air draft. To minimize water carried away by the air, drift
eliminators are installed in the wet cooling towers above the spray section.
The air circulation in the cooling tower described is provided by a fan,
and therefore it is classified as a forced-draft cooling tower. Another popular
type of cooling tower is the natural-draft cooling tower, which looks like a
large chimney and works like an ordinary chimney. The air in the tower has
a high water-vapor content, and thus it is lighter than the outside air. Conse-
quently, the light air in the tower rises, and the heavier outside air fills the
vacant space, creating an airflow from the bottom of the tower to the top.
The flow rate of air is controlled by the conditions of the atmospheric air.
Natural-draft cooling towers do not require any external power to induce the
air, but they cost a lot more to build than forced-draft cooling towers. The
natural-draft cooling towers are hyperbolic in profile, as shown in Fig.
14–32, and some are over 100 m high. The hyperbolic profile is for greater
structural strength, not for any thermodynamic reason.
The idea of a cooling tower started with the spray pond, where the warm
water is sprayed into the air and is cooled by the air as it falls into the pond,
as shown in Fig. 14–33. Some spray ponds are still in use today. However,
they require 25 to 50 times the area of a cooling tower, water loss due to air
drift is high, and they are unprotected against dust and dirt.
We could also dump the waste heat into a still cooling pond, which is
basically a large artificial lake open to the atmosphere. Heat transfer from
the pond surface to the atmosphere is very slow, however, and we would
need about 20 times the area of a spray pond in this case to achieve the
same cooling.
EXAMPLE 14–9 Cooling of a Power Plant by a Cooling Tower
Cooling water leaves the condenser of a power plant and enters a wet cooling
tower at 35°C at a rate of 100 kg/s. Water is cooled to 22°C in the cooling
tower by air that enters the tower at 1 atm, 20°C, and 60 percent relative
humidity and leaves saturated at 30°C. Neglecting the power input to the
fan, determine (a) the volume flow rate of air into the cooling tower and (b)
the mass flow rate of the required makeup water.
Solution Warm cooling water from a power plant is cooled in a wet cooling
tower. The flow rates of makeup water and air are to be determined.
Assumptions 1 Steady operating conditions exist and thus the mass flow
rate of dry air remains constant during the entire process. 2 Dry air and the
water vapor are ideal gases. 3 The kinetic and potential energy changes are
negligible. 4 The cooling tower is adiabatic.
738 | Thermodynamics
WARM
WATER
COOL
WATER
AIR
INLET
FIGURE 14–32
A natural-draft cooling tower.
FIGURE 14–33
A spray pond.
Photo by Yunus Çengel.
COOL
WATER
AIR EXIT
WARM
WATER
AIR
INLET
FA N
FIGURE 14–31
An induced-draft counterflow cooling
tower.
cen84959_ch14.qxd 4/28/05 2:58 PM Page 738
Chapter 14 | 739
COOL
WATER
WARM
WATER
AIR
35°C
100 kg/s
100 kg/s
System
boundary
4
1
3
2
1 atm
20°C
f
1
= 60%
30°C
f
2
= 100%
V
1
Makeup
water
22°C
·
FIGURE 14–34
Schematic for Example 14–9.
Properties The enthalpy of saturated liquid water is 92.28 kJ/kg at 22°C
and 146.64 kJ/kg at 35°C (Table A–4). From the psychrometric chart,
h
1
ϭ 42.2 kJ/kg dry air h
2
ϭ 100.0 kJ/kg dry air
v
1
ϭ 0.0087 kg H
2
O/kg dry air v
2
ϭ 0.0273 kg H
2
O/kg dry air
v
1
ϭ 0.842 m
3
/kg dry air
Analysis We take the entire cooling tower to be the system, which is shown
schematically in Fig. 14–34. We note that the mass flow rate of liquid water
decreases by an amount equal to the amount of water that vaporizes in the
tower during the cooling process. The water lost through evaporation must be
made up later in the cycle to maintain steady operation.
(a) Applying the mass and energy balances on the cooling tower gives
Dry air mass balance:
Water mass balance:
or
Energy balance:
or
Solving for m
·
a
gives
Substituting,
Then the volume flow rate of air into the cooling tower becomes
(b) The mass flow rate of the required makeup water is determined from
Discussion Note that over 98 percent of the cooling water is saved and
recirculated in this case.
m
#
makeup
ϭ m
#
a
1v
2
Ϫ v
1
2 ϭ 196.9 kg>s 210.0273 Ϫ 0.0087 2 ϭ 1.80 kg
/
s
V
#
1
ϭ m
#
a
v
1
ϭ 196.9 kg>s210.842 m
3
>kg2 ϭ 81.6 m
3
/
s
m
#
a
ϭ
1100 kg>s 231146.64 Ϫ 92.282 kJ> kg 4
31100.0 Ϫ 42.22 kJ>kg4 Ϫ 310.0273 Ϫ 0.0087 2192.282 kJ>kg4
ϭ 96.9 kg>s
m
#
a
ϭ
m
#
3
1h
3
Ϫ h
4
2
1h
2
Ϫ h
1
2 Ϫ 1v
2
Ϫ v
1
2h
4
m
#
3
h
3
ϭ m
#
a
1h
2
Ϫ h
1
2 ϩ 1m
#
3
Ϫ m
#
makeup
2h
4
a
in
m
#
h ϭ
a
out
m
#
h S m
#
a
1
h
1
ϩ m
#
3
h
3
ϭ m
#
a
2
h
2
ϩ m
#
4
h
4
m
#
3
Ϫ m
#
4
ϭ m
#
a
1v
2
Ϫ v
1
2 ϭ m
#
makeup
m
#
3
ϩ m
#
a
1
v
1
ϭ m
#
4
ϩ m
#
a
2
v
2
m
#
a
1
ϭ m
#
a
2
ϭ m
#
a
SUMMARY
In this chapter we discussed the air–water-vapor mixture,
which is the most commonly encountered gas–vapor mixture
in practice. The air in the atmosphere normally contains some
water vapor, and it is referred to as atmospheric air. By con-
trast, air that contains no water vapor is called dry air. In the
temperature range encountered in air-conditioning applica-
tions, both the dry air and the water vapor can be treated as
ideal gases. The enthalpy change of dry air during a process
can be determined from
The atmospheric air can be treated as an ideal-gas mixture
whose pressure is the sum of the partial pressure of dry air P
a
and that of the water vapor P
v
,
P ϭ P
a
ϩ P
v
¢h
dry air
ϭ c
p
¢T ϭ 11.005 kJ>kg
#
°C2 ¢T
cen84959_ch14.qxd 4/26/05 4:01 PM Page 739
740 | Thermodynamics
The enthalpy of water vapor in the air can be taken to be equal
to the enthalpy of the saturated vapor at the same temperature:
h
v
(T,low P) ഡ h
g
(T) ഡ 2500.9 ϩ 1.82T (kJ/kg) T in °C
ഡ 1060.9 ϩ 0.435T (Btu/lbm) T in °F
in the temperature range Ϫ10 to 50°C (15 to 120°F).
The mass of water vapor present per unit mass of dry air is
called the specific or absolute humidity v,
where P is the total pressure of air and P
v
is the vapor pres-
sure. There is a limit on the amount of vapor the air can hold
at a given temperature. Air that is holding as much moisture
as it can at a given temperature is called saturated air. The
ratio of the amount of moisture air holds (m
v
) to the maxi-
mum amount of moisture air can hold at the same tempera-
ture (m
g
) is called the relative humidity f,
where P
g
ϭ P
sat @ T
. The relative and specific humidities can
also be expressed as
Relative humidity ranges from 0 for dry air to 1 for saturated
air.
The enthalpy of atmospheric air is expressed per unit mass
of dry air, instead of per unit mass of the air–water-vapor
mixture, as
The ordinary temperature of atmospheric air is referred to
as the dry-bulb temperature to differentiate it from other forms
of temperatures. The temperature at which condensation begins
if the air is cooled at constant pressure is called the dew-point
temperature T
dp
:
Relative humidity and specific humidity of air can be deter-
mined by measuring the adiabatic saturation temperature of
air, which is the temperature air attains after flowing over
water in a long adiabatic channel until it is saturated,
v
1
ϭ
c
p
1T
2
Ϫ T
1
2 ϩ v
2
h
fg
2
h
g
1
Ϫ h
f
2
T
dp
ϭ T
sat @ P
v
h ϭ h
a
ϩ vh
g
¬¬
1kJ>kg dry air 2
f ϭ
vP
10.622 ϩ v2P
g
¬
and
¬
v ϭ
0.622fP
g
P Ϫ fP
g
f ϭ
m
v
m
g
ϭ
P
v
P
g
v ϭ
m
v
m
a
ϭ
0.622P
v
P Ϫ P
v
¬¬
1kg H
2
O>kg dry air2
where
and T
2
is the adiabatic saturation temperature. A more practi-
cal approach in air-conditioning applications is to use a ther-
mometer whose bulb is covered with a cotton wick saturated
with water and to blow air over the wick. The temperature
measured in this manner is called the wet-bulb temperature
T
wb
, and it is used in place of the adiabatic saturation temper-
ature. The properties of atmospheric air at a specified total
pressure are presented in the form of easily readable charts,
called psychrometric charts. The lines of constant enthalpy
and the lines of constant wet-bulb temperature are very
nearly parallel on these charts.
The needs of the human body and the conditions of the
environment are not quite compatible. Therefore, it often
becomes necessary to change the conditions of a living space
to make it more comfortable. Maintaining a living space or
an industrial facility at the desired temperature and humidity
may require simple heating (raising the temperature), simple
cooling (lowering the temperature), humidifying (adding
moisture), or dehumidifying (removing moisture). Sometimes
two or more of these processes are needed to bring the air to
the desired temperature and humidity level.
Most air-conditioning processes can be modeled as steady-
flow processes, and therefore they can be analyzed by apply-
ing the steady-flow mass (for both dry air and water) and
energy balances,
Dry air mass:
Water mass:
Energy:
The changes in kinetic and potential energies are assumed to
be negligible.
During a simple heating or cooling process, the specific
humidity remains constant, but the temperature and the rela-
tive humidity change. Sometimes air is humidified after it is
heated, and some cooling processes include dehumidification.
In dry climates, air can be cooled via evaporative cooling by
passing it through a section where it is sprayed with water. In
locations with limited cooling water supply, large amounts of
waste heat can be rejected to the atmosphere with minimum
water loss through the use of cooling towers.
Q
#
in
ϩ W
#
in
ϩ
a
in
m
#
h ϭ Q
#
out
ϩ W
#
out
ϩ
a
out
m
#
h
a
in
m
#
w
ϭ
a
out
m
#
w
or
a
in
m
#
a
v ϭ
a
out
m
#
a
v
a
in
m
#
a
ϭ
a
out
m
#
a
v
2
ϭ
0.622P
g
2
P
2
Ϫ P
g
2
cen84959_ch14.qxd 4/26/05 4:01 PM Page 740
Chapter 14 | 741
1. ASHRAE. 1981 Handbook of Fundamentals. Atlanta,
GA: American Society of Heating, Refrigerating, and Air-
Conditioning Engineers, 1981.
2. S. M. Elonka. “Cooling Towers.” Power, March 1963.
3. W. F. Stoecker and J. W. Jones. Refrigeration and Air
Conditioning. 2nd ed. New York: McGraw-Hill, 1982.
REFERENCES AND SUGGESTED READINGS
4. K. Wark and D. E. Richards. Thermodynamics. 6th ed.
New York: McGraw-Hill, 1999.
5. L. D. Winiarski and B. A. Tichenor. “Model of Natural
Draft Cooling Tower Performance.” Journal of the
Sanitary Engineering Division, Proceedings of the
American Society of Civil Engineers, August 1970.
Dry and Atmospheric Air: Specific and Relative Humidity
14–1C Is it possible to obtain saturated air from unsatu-
rated air without adding any moisture? Explain.
14–2C Is the relative humidity of saturated air necessarily
100 percent?
14–3C Moist air is passed through a cooling section where
it is cooled and dehumidified. How do (a) the specific humid-
ity and (b) the relative humidity of air change during this
process?
14–4C What is the difference between dry air and atmo-
spheric air?
14–5C Can the water vapor in air be treated as an ideal
gas? Explain.
14–6C What is vapor pressure?
14–7C How would you compare the enthalpy of water
vapor at 20°C and 2 kPa with the enthalpy of water vapor at
20°C and 0.5 kPa?
14–8C What is the difference between the specific humid-
ity and the relative humidity?
14–9C How will (a) the specific humidity and (b) the rela-
tive humidity of the air contained in a well-sealed room
change as it is heated?
PROBLEMS*
14–10C How will (a) the specific humidity and (b) the rela-
tive humidity of the air contained in a well-sealed room
change as it is cooled?
14–11C Consider a tank that contains moist air at 3 atm
and whose walls are permeable to water vapor. The surround-
ing air at 1 atm pressure also contains some moisture. Is it
possible for the water vapor to flow into the tank from sur-
roundings? Explain.
14–12C Why are the chilled water lines always wrapped
with vapor barrier jackets?
14–13C Explain how vapor pressure of the ambient air is
determined when the temperature, total pressure, and the rel-
ative humidity of air are given.
14–14 An 8 m
3
-tank contains saturated air at 30°C, 105 kPa.
Determine (a) the mass of dry air, (b) the specific humidity,
and (c) the enthalpy of the air per unit mass of the dry air.
14–15 A tank contains 21 kg of dry air and 0.3 kg of water
vapor at 30°C and 100 kPa total pressure. Determine (a) the
specific humidity, (b) the relative humidity, and (c) the vol-
ume of the tank.
14–16 Repeat Prob. 14–15 for a temperature of 24°C.
14–17 A room contains air at 20°C and 98 kPa at a relative
humidity of 85 percent. Determine (a) the partial pressure of
dry air, (b) the specific humidity of the air, and (c) the
enthalpy per unit mass of dry air.
14–18 Repeat Prob. 14–17 for a pressure of 85 kPa.
14–19E A room contains air at 70°F and 14.6 psia at a
relative humidity of 85 percent. Determine (a) the partial
pressure of dry air, (b) the specific humidity, and (c) the
enthalpy per unit mass of dry air.
Answers: (a) 14.291 psia,
(b) 0.0134 lbm H
2
O/lbm dry air, (c) 31.43 Btu/lbm dry air
14–20 Determine the masses of dry air and the water vapor
contained in a 240-m
3
room at 98 kPa, 23°C, and 50 percent
relative humidity.
Answers: 273 kg, 2.5 kg
*Problems designated by a “C” are concept questions, and students
are encouraged to answer them all. Problems designated by an “E”
are in English units, and the SI users can ignore them. Problems
with a CD-EES icon are solved using EES, and complete solutions
together with parametric studies are included on the enclosed DVD.
Problems with a computer-EES icon are comprehensive in nature,
and are intended to be solved with a computer, preferably using the
EES software that accompanies this text.
cen84959_ch14.qxd 4/26/05 4:01 PM Page 741