SOCIAL CAPITAL, LIVELIHOOD DIVERSIFICATION AND HOUSEHOLD RESILIENCE TO ANNUAL FLOOD EVENTS IN THE VIETNAMESE MEKONG RIVER DELTA
Bạn đang xem bản rút gọn của tài liệu. Xem và tải ngay bản đầy đủ của tài liệu tại đây (2.86 MB, 62 trang )
SOCIAL CAPITAL, LIVELIHOOD
DIVERSIFICATION AND HOUSEHOLD RESILIENCE
TO ANNUAL FLOOD EVENTS IN THE VIETNAMESE
MEKONG RIVER DELTA
Nguyen Van Kien
December, 2011
Comments should be sent to: Mr Nguyen Van Kien, Australian Demographic and Social
Research Institute, the Australian National University, Acton 0200, Canberra, ACT,
Australia.
Tel: +61 2 6125 3800
Fax: +61 2 6125 2992
Email:
or
Department of Soil and Resources Management, Faculty of Agriculture and Natural
Resources, An Giang University, Vietnam.
Mobile: +84 1673566875
Email:
The Economy and Environment Program for Southeast Asia (EEPSEA) was
established in May 1993 to support research and training in environmental and resource
economics. Its objective is to enhance local capacity to undertake the economic analysis of
environmental problems and policies. It uses a networking approach, involving courses,
meetings, technical support, access to literature and opportunities for comparative research.
Member countries are Thailand, Malaysia, Indonesia, the Philippines, Vietnam, Cambodia,
Lao PDR, China, and Papua New Guinea.
EEPSEA is supported by the International Development Research Centre (IDRC); the
Swedish International Development Cooperation Agency (Sida); and the Canadian
International Development Agency (CIDA).
EEPSEA publications are also available online at .
ACKNOWLEDGEMENTS
I would like to greatly thank Dr Hermi Francisco, Director of EEPSEA in Singapore,
for kindly giving support and funding to this research project. I would also like to thank Dr
David James, Professor of Economics at Sunshine Coast University, and Dr Tran Khanh
Nam, lecturer at HCM Economics University, for their useful comments on the final report. I
would like to thank my supervisory panel members, Professor Peter McDonal, Professor
Helen James, Professor Adrian Hayes and Dr Philip Taylor, at the Australian National
University (ANU) for their valuable advice and comments on my PhD thesis at ANU.
Finally, I would like to thank my colleagues at An Giang University in Vietnam, who assisted
my fieldwork in the Mekong River Delta.
TABLE OF CONTENTS
EXECUTIVE SUMMARY
1.0 INTRODUCTION 1
1.1 Research Issues 1
1.2 Research Objectives 2
1.3 Research Questions 2
1.4 The Mekong River Delta and Flooding 3
2.0 REVIEW OF LITERATURE 7
2.1 Resilience, Social Capital and Livelihood Adaptation 7
2.2 The Relationship between Livelihood Adaptation and Resilience 7
2.3 Social Capital and Resilience to Environmental Hazards 9
3.0 METHODOLOGY 12
3.1 Selection of Study Sites 12
3.2 Data Collection 13
3.3 Sampling Procedures 14
3.4 Characteristics of the Respondents 15
3.5 Methods of Analysis 17
3.6 Constructing Indexes of Resilience, Livelihood Diversity and
Social Capital 18
4.0 RESULTS AND DISCUSSION 30
4.1 Impacts of Different Flood Levels 30
4.2 Resilience Factor One and Socio-economic Variables, Social Capital, 40
and Livelihood Diversity
4.3 Resilience Factor Two and Socio-economic Factors, Social Capital, 41
and Livelihood Adaptation
4.4 Resilience Factor Three and Socio-economic Variables, Social Capital, 42
and Livelihood Diversity
5.0 CONCLUSIONS 45
6.0 POLICY IMPLICATIONS 47
REFERENCES 48
LIST OF TABLES
Table 1.
Flood characteristics of the MRD
5
Table 2.
Impacts of floods on people, housing, crops and public
infrastructure in the MRD
6
Table 3.
Socio-economic conditions and livelihood activities of the three
study sites
13
Table 4.
Distribution of types of households across the three study sites
15
Table 5.
Respondent (household) characteristics
16
Table 6.
Proportion of respondents who answered five-point Likert scale
questions (nine items)
20
Table 7.
Factor matrix of household resilience, MRD, Vietnam, 2010
(five items)
21
Table 8.
Factor matrix of social capital (neighbourhood attachment,
MRD, 2010, 10 final items)
23
Table 9.
Participation in formal groups and associations
24
Table 10.
Social networks of respondents, MRD, 2010
25
Table 11.
Mean indexes of social capital by the socio-economic conditions
of the respondents
26
Table 12.
Definition of variables
29
Table 13.
The impacts of big floods on household livelihood activities and
assets by social group
33
Table 14.
Perceived benefits of a big flood to household livelihood
activities and assets by social group
35
Table 15.
Negative impacts of moderate floods by social group
36
Table 16.
Benefits of moderate floods by social group
37
Table 17.
Negative impacts of small floods by social group
39
Table 18.
Perceived benefits of small floods to household livelihood
activities and assets by social group
40
Table 19.
Multiple regressions for resilience factor one
41
Table 20.
Multiple regressions for resilience factor two
42
Table 21.
Multiple regressions for resilience factor three
45
LIST OF FIGURES
Figure 1.
Map of the Mekong River Delta (Karonen 2008)
3
Figure 2.
Water level at Tân Châu Gauging Station, MRD, (1992-2009)
4
Figure 3.
The highest water levels during different flood years in the
MRD, (1929-2007)
6
Figure 4.
Analytical framework for examining the relationship between
social capital, livelihood adaptation and household resilience
to floods in the MRD
12
Figure 5.
Location of the Mekong River Delta and the study sites
13
Figure 6.
Relationship between livelihood diversity index and household
income quintiles
27
Figure 7.
Negative impacts of different flood levels on household
livelihoods
30
Figure 8.
Perceived benefits of different flood levels
31
Figure 9.
Perceived negative impacts of big floods on household
livelihoods
32
Figure 10.
Perceived benefits of big floods on household livelihoods
34
Figure 11.
Perceived negative impacts of moderate floods on household
livelihoods
35
Figure 12.
Perceived benefits of moderate floods on household
livelihoods
37
Figure 13.
Perceived negative impacts of small floods on household
livelihoods
38
Figure 14.
Perceived benefits of small floods on household livelihoods
39
ABBREVIATIONS
AusAID
Australian Agency for Aid and Development
CTU
Can Tho University
GSOV
General Statistical Office of Vietnam
IHHD
Inverse Herfindahl-Hirschman Index
MRC
Mekong River Commission
MRD
Mekong River Delta
MSL
Mean Sea Level
VND
Vietnam Dong
SOCIAL CAPITAL, LIVELIHOOD DIVERSIFICATION AND HOUSEHOLD
RESILIENCE TO ANNUAL FLOOD EVENTS IN THE VIETNAMESE MEKONG
RIVER DELTA
Nguyen Van Kien
EXECUTIVE SUMMARY
Floods are a familiar and frequent feature of life in the Vietnamese Mekong River
Delta (MRD). Although floods bring hardship to people, they also bring benefits, such as
livelihood development. People in the MRD have experienced the impacts of floods for
years, however some adapt well to the floods, while others are more vulnerable. Studying
resilience to floods is useful as a way of assessing the capacity of rural households to cope
with, and benefit from, annual floods. Social capital plays an important role in a household’s
ability to access technical information, resources and local knowledge during annual
flooding. Livelihood diversity is known to be a vital strategy for coping with the risks of
flood damage. However little is known about the effects of social capital and livelihood
diversity on household resilience to floods in terms of securing their homes, securing food,
and protecting income, as well as learning new flood-based livelihoods. This study explores
the relationship between a household’s resilience to floods in the MRD and levels of social
capital (neighbourhood attachment, social supportive network, and participation in groups
and associations) and livelihood diversification. These different forms of social capital were
measured using the Inverse Herfindahl-Hirschman Index (IHHD).
Resilience in this context is defined as the ability of households to learn from, cope
with, and benefit from, flood events. Household resilience was measured using expected
levels of well-being, obtained from a household survey in 2010, using a five-point Likert
scale to construct indexes of household resilience. The results from multiple regressions
demonstrate that different forms of social capital have different effects on different forms of
household resilience. Neighbourhood attachment has statistically significant effects on a
household’s ability to secure food, income, and a level of interest in learning new flood-based
livelihoods, but it does not have a significant effect on the capacity of households to secure
their home. Similarly, the social supportive network index has significant effects on a
household’s ability to learn new livelihoods during the flood season, but it does not have a
significant effect on household capacity to secure the home, food and income. Besides social
capital, the socio-economic condition of households (household income) is shown to have a
significant effect on the three resilience factors – capacity to secure homes, secure food and
income, and level of interest in learning and engaging in new livelihoods. Rich households
are less likely to be interested in learning new livelihoods (negative effect). Rich households
often own large areas of land so they are more likely to specialize in rice farming, which
takes a break during the flood season. Poor and medium-income households often own less
land or are landless, so they have to work harder to secure an income and food in order to
survive during the flood season. Other socio-economic variables, such as the gender and age
of respondents, have significant effect on the level of interest shown in learning new
livelihoods (negative effect). Housing type also has a significant effect on household capacity
to secure the home (concrete houses are less vulnerable). Regional flood factors also have a
significant effect on the three resilience factors; people in the highest flood-prone region are
less likely to be resilient in terms of securing their houses, food and income, but are more
likely to learn new ways of living with floods. Surprisingly, the livelihood diversity index has
no effect on household resilience to floods in this context.
1
1.0 INTRODUCTION
1.1 Research Issues
Flooding is well-known in Vietnam, especially in the Red River Delta, the Central
coastal region and the Mekong River Delta (MRD) (Socialist Republic of Vietnam 2004).
Among disaster events, flood frequency, damage and mortality were ranked as the second
most severe after the impacts of typhoons in Vietnam (Imamura and Đặng Văn Tô 1997).
Half of the MRD’s area (2 million ha) is annually flooded and the majority of rural
populations are vulnerable to the impacts of floods, including loss of human life, loss of crops
and damage to property. There is additional evidence that a rise in sea level due to climate
change will increase the risk of flooding in the MRD, which will affect the livelihoods of
millions of people (Dasgupta et al. 2007; Eastham et al. 2008; Wassmann et al. 2004). Sea
level is expected to increase by 75 cm by the end of the 21
st
century in Vietnam’s Mekong
Delta (Ministry of Natural Resources and Environment 2009). Consequently, the livelihoods
of people in the MRD will be vulnerable if measures are not undertaken to cope with and
adapt to future flooding.
Flooding in the MRD has both negative and positive effects. On the negative side,
flooding always brings hardship to rural populations via such impacts as crop losses,
submerged and destroyed houses, and loss of human life. On the positive side, flooding
brings beneficial resources such as an abundance of fish, fertile sediment, and a huge amount
of water that supports productive agriculture. However, not all of the population experiences
similar benefits or losses in any given flood year. Some people are vulnerable, while some
are resilient to flood events. Some social groups can turn floods, which are often perceived as
a disaster, into resources that allow them to benefit and become more resilient.
Although it has been acknowledged that annual floods in the MRD bring both benefits
and costs to rural populations, no study had demonstrated which social groups benefit from or
are disadvantaged by the flooding. This study attempts to identify the winners and the losers
from annual flood events, with the aim of providing a better understanding of the MRD
floods.
Resilience is a useful concept in studies of adaptation to natural hazards and climate
change. The resilience concept is important for understanding the capacities and livelihoods
of resource-dependent communities and households when coping with and adapting to stress
or shocks (Adger 1999, 2000; Adger et al. 2005; Adger et al. 2002; Armitage and Johnson
2006; Berkes 2001; Folke 2006; Folke et al. 2002; Klein, Nicholls and Thomalla 2003;
Langridge, Christian-Smith and Lohse. 2006; Marshall and Marshall 2007; Walker et al.
2002). From an ecological point of view, resilience is defined as “the ability of a system to
absorb change of state variables, driving variables, and parameters and still persist” (Holling
1973: 17). In a social system, Adger et al. (2002: 358) define resilience as “the ability of
communities to absorb external changes and stress, while maintaining the sustainability of
their livelihoods”. Resilience has been discussed as the capacity of an ecological or social
system to absorb changes but still maintain its core function. The concept of resilience has
been discussed within a linked ecological-social system. One important aspect of resilience is
the capacity to learn, to innovate, and to transform (Folke et al. 2002; Walker et al. 2004).
Resilience in the context of living with flooding in the MRD is defined as the capacity of
households to learn from, cope with, and benefit from floods.
Most researchers attempt to define the concept of resilience but very few studies
conceptualize resilience. However, Marshall and Marshall (2007) developed items to measure
2
individual fishermen’s resilience to institutional changes in the Australian context. Little is
known about individual levels of resilience to natural hazards such as flooding. Additionally,
most studies explain social and ecological resilience in qualitative ways; very few studies
quantify resilience in the context of coping with natural hazards and climate change. This
study continues to develop resilience theory and conceptualize the resilience concept in the
context of living with flooding in the Vietnamese Mekong River Delta.
Livelihood adaptation is the key to resilience. Livelihood adaptation means either
specialization or diversification of income sources. Livelihood diversification is also an
important strategy for coping with risk (Ellis 2000; Ellis and Freeman 2005). Many studies
have investigated the role of livelihood diversification in coping with drought and have
suggested that diversification toward non-farm activities can help poor households to reduce
their vulnerability to climate change (Eriksen, Brown and Kelly 2005; Smith et al. 2001).
However, it is argued that poor households are more likely to diversify livelihood activities
for survival, while rich households tend to diversify for development and wealth
accumulation (Carswell 2000). This study examines whether diversification or livelihood
specialization is better for coping with the flood season in the MRD.
Social capital is considered as important an asset as physical, natural, financial and
human capital for coping with natural hazards and climate change. However, most studies
examine the effects of social capital on adapting to climate change in qualitative terms
(Airriess et al. 2008; Eriksen et al. 2005; Hawkins and Maurer 2010; Mathbor 2007). Some
studies investigate the role of formal social capital, such as participation in formal
organizations, but little is known about informal social capital, such as bonding and bridging
social capital, especially in adapting to climate change (Pelling and High 2005). The effects
of different forms of social capital on household resilience to natural hazards have been
largely neglected in quantitative terms. This study examines the relationship between
household resilience to annual flood events and livelihood adaptation, and different forms of
social capital (neighbourhood attachment, social supportive networks, participation in groups
and organizations) in the Vietnamese MRD, adopted from Li et al. (2005). Li et al. treated the
neighbourhood attachment of individuals, social supportive networks and civic engagement
as informal and formal social capital and assessed their effects on job attainment in the UK.
The findings of this study provide insights into developing adaptive non-structural measures
for coping with and adapting to future flood events in the MRD.
1.2 Research Objectives
The main objective of this study is to advance our understanding of the resilience of
different social groups, and its relationship with different forms of social capital and
livelihood adaptation in the context of living with flooding in the MRD. The report will
explore three sub-objectives to support the key aim.
1. To examine the impacts of three levels of flooding on different households’ livelihood
activities and assets in the MRD.
2. To investigate the relationship between livelihood adaptation (diversification or
specialization) and household resilience to floods in the MRD.
3. To examine the relationship between different forms of individual levels of social
capital and household resilience to floods in the MRD.
1.3 Research Questions
The research will seek to answer three key questions in order to advance our
understanding of the impacts of floods on different social groups, and to test the hypothesis
3
that there is a significant relationship between a household’s resilience to floods, livelihood
diversity, and different forms of individual social capital. The research also seeks to answer
three sub-questions.
1. Are the impacts of annual flood events on household livelihoods considered
“beneficial”, or “disadvantageous” for different households in different
geographically flood-prone regions of the MRD?
2. To what extent is there a relationship between livelihood diversification or
specialization and household resilience to floods in the MRD?
3. To what extent is there a relationship between different forms of individual
levels of social capital and household resilience to floods in the MRD?
1.4. The Mekong River Delta and Flooding
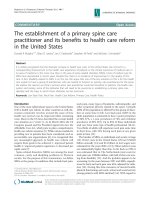
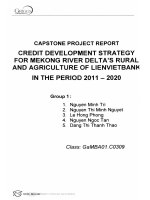
The Vietnamese Mekong River Delta is located on the south-western edge of
Vietnam. The delta comprises 4 million hectares (ha) of land, accounting for 12.25% of
Vietnam’s total land area (Figure 1). Geologically, the average elevation of the delta is
slightly (<2 m) above mean sea level (Võ Tòng Xuân and Matsui 1998). With a total
population of 17.4 million and an average density of approximately 429 inhabitants per sq
km, the delta is the second-most populated region within the country. Approximately 80% of
the population live in rural areas and the livelihood of 77% of the population is based on
agriculture, aquaculture and forestry (Australian Agency for Aid and Development (AusAID)
2004; General Statistical Office of Vietnam (GSOV) 2006). In addition, 13% of the rural
population lives below the poverty line (GSOV 2006).
The delta has an important economic role. Rice is the main agricultural crop,
amounting to 18.1 million tonnes of paddy, providing 50% of total rice production in
Vietnam (GSOV 2006). Aquaculture is the second most important product in the Delta.
Approximately 2 million tonnes of aquaculture products were produced in 2006 (GSOV
2006), of which shrimp production was estimated at 287.1 thousand tonnes (GSOV 2006).
Figure 1. Map of the Mekong River Delta (Karonen 2008)
Annual flooding strongly affects the economic foundation and socio-economic
development of the delta. Annually, about 1.2-1.4 million ha are flooded, causing severe
difficulties for socio-economic development but maintaining productivity for agricultural
4
development in the region (Lê Anh Tuấn et al. 2007b). Floods are “good” but also “bad” for
human society. Local people distinguish between flooding that is “moderate” and “big” (Đào
Công Tiến 2001b). Floods bring fish, wash away farm residuals, deposit silt sediment, purify
water, kill pests, and wash alum, which makes the soil of the delta fertile (Đào Công Tiến
2001b; Phóng Trần et al. 2008). It is estimated that the average fish capture in the delta is
about 500 kg per household per year, providing a significant protein source for local people
(Mekong River Commission (MRC) 2002 9; Nguyen Van Trong and Le Thanh Binh 2004).
Every year, the flood deposits around 150 million tonnes of fertile sediment on paddy fields
throughout the flood-prone areas of the MRD (Đào Công Tiến 2001b). Rice farmers achieve
good yields after every flood season thanks to water and sediment brought by the flooding.
‘Flooding’ in the Vietnamese Mekong Delta is defined as riverine flooding, which is
caused by upstream discharge, heavy rainfall in the Delta itself and variation in the tides of
the East Sea and the Gulf of Thailand (Wassmann et al. 2004). Floods are an annual event
that begin in June, gradually increase to reach a peak in September or October, and recede in
November or December each year (Figure 2).
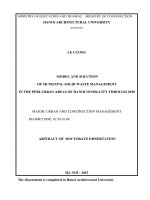
Figure 2. Water level at Tân Châu Gauging Station, MRD, (1992-2009)
Source: adapted from Mekong River Commission (2009)
Hydrologists classify floods into four main categories of severity (alarm level I, II, III, and
over III). Based on information from the Tân Châu Gauging Station (Table 1), alarm level I
occurs if the flood level at Tân Châu is less than 3.0 meters (m) above mean sea level (MSL).
If the flood level ranges from 3.0 m to less than 3.6 MSL, it qualifies as alarm level II. Alarm
level III is achieved if the floodwaters reach over 3.6 m but are less than 4.2 m. If the flood
level exceeds 4.2 m, then over alarm level III, the most dangerous flood level, has been
reached. Since 1978, there have been seven extreme flood events in the MRD, and the flood
peak varies each year (Figure 2). In some years, floods are considered “big” such as the
floods in 1996, 2000, 2001 and 2002, while the floods are considered “moderate or small” in
other years.
5
Table 1. Flood characteristics of the MRD
Levels
Gauging Stations
Description
Tân Châu
(Tien
River
Chau Doc
(Hau
River)
I
≤3.0
≤2.5
Possible flood conditions – river water level is high;
threat to low embankments; flooding of very low-
lying areas; infrastructure safe.
II
≤3.6
≤3.0
Dangerous flood conditions: flood plain inundation
expected; towns and cities still generally protected by
flood defenses; high velocity of river flows pose
danger of bank and dyke erosion; bridge foundations
at risk; infrastructure generally safe.
III
≤4.2
≤3.5
Very dangerous flood conditions – all low-lying areas
submerged, including low-lying areas of cities and
towns; safety of river protection (dykes) in jeopardy;
damage to infrastructure begins.
Over III
≥4.2
≥3.5
Emergency flood conditions – general and widespread
uncontrollable flooding; dyke failure a certainty and
probably uncontrollable; damage to infrastructure
severe.
Source: Lê Anh Tuấn, et al. (2007a: 30)
Big floods bring costs to rural people. Recorded data show that big floods occurred in
1850, 1937, 1961, 1966, 1978, 1984, 1994, 1995, 1996, 2000, 2001, and 2002 (Can Tho
University (CTU) 1995; Socialist Republic of Vietnam 2004). Costs included rice crop and
house damage, livestock and human losses, injuries, and water-borne diseases (Đặng Quang
Tính and Phạm Thanh Hằng 2003; Đào Công Tiến 2001b; Dương Văn Nhã 2006; Few et al.
2005; Nguyễn Văn Kiền 2006). The flood in 1994 killed 407 people and caused economic
damage of around VND
1
2,284 billion (USD 207.6 million) (Socialist Republic of Vietnam
2004). The next flood, in 1997, killed 607 people and destroyed 173,606 houses. The worst
flood, in 2000, affected 11 million people living in 610 flooded communes, of which 4.5
million people lived in the 77 most affected sub-districts where flood levels exceeded more
than 3 meters (Nguyen Dinh Huan 2003). In addition, more than 800,000 houses were
inundated, 50,000 households had to be evacuated, 500,000 households needed emergency
support, and 800,000 high school students had to stop their studies (Đào Công Tiến 2001a:
3). About 55,123 ha of rice crop was completely destroyed and an additional 159,260 ha of
rice was inundated and so had to be harvested immediately (Đặng Quang Tính and Phạm
Thanh Hằng 2003: 5). The total direct economic cost of the 2000 flood was estimated at
VND
2
4,000 billion (USD 289.8 million). Damage to homes, damage to health, and loss of
income due to crop damage, fishing losses, and missed waged labour, were the most
significant impacts at a household level (Table 2).
1
One USD (in 1997) is roughly equivalent to 11,000 VND.
2
One USD (in 2000) is equivalent to 13,800 VND.
6
Table 2. Impacts of floods on people, housing, crops and public infrastructure in the MRD
Year
Deaths
Child
deaths
Rice
area
destro
yed
Reduced
rice
yield
Collapsed
houses
Damaged
houses
Classrooms
damaged
Clinics
damaged
People
People
ha
Ha
Number
Number
Number
Number
1991
143
72,140
61,482
2,977
278,546
5,136
1992
1993
1994
407
265
26,865
202,186
2,807
779,119
405
1995
127
101
11,101
62,399
696
203,874
2,963
131
1996
222
166
60,368
132,309
42,358
836,773
11,953
1997
607
5
19,758
251,341
74,368
99,238
72
7
1998
1999
2000
481
335
46,402
197,652
4,093
891,406
12,909
397
2001
407
321
4,553
53,267
1,000
341,614
5,559
89
2002
170
151
335
960
286,660
2,694
2003
2004
38.0
34.0
115.0
193.0
690.0
2005
44.0
39.0
185.0
2,723.0
4,472.0
2006
22.0
21.0
Source: Adapted from Department of Agriculture and Rural Development, flooded provinces (2008), MRC
(2005), Socialist Republic of Vietnam (2004)
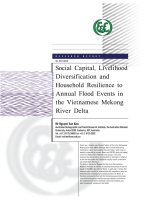
At the other end of the scale, small floods are rare. The flooding of 1998 is thought to
have been the smallest flood in the past 80 years (Figure 3). A small flood often does not
cause damage to property, houses, crops and other livelihood activities and assets. However,
a small flood affects rural livelihoods in different ways. Poor people are more likely to lose
their income from fishing as they cannot catch much fish during the flood season.
Flood peak in the MRD from 1929 to 2007
0
100
200
300
400
500
600
1929
1937
1943
1952
1961
1966
1975
Aug-79
Aug-81
Oct-83
Sep-85
Sep-87
Oct-89
Sep-91
Sep-93
Sep-95
Oct-97
Oct-99
Sep-01
Sep-03
Oct-05
Oct-07
cm
Figure 3. The highest water levels during different flood years in the MRD, (1929-2007)
Source: An Giang Statistical Year Book (2009) and Nguyen Anh Tuan et al. (2007
a
)
7
2.0 REVIEW OF LITERATURE
2.1 Resilience, Social Capital and Livelihood Adaptation
Resilience has become a useful concept in the study of environmental hazards. The
term “resilience” first originated in the field of ecology. Holling (1973: 17) defines resilience
as “the ability of a system to absorb change of state variables, driving variables and
parameters and still persist”. This concept focuses on the capacity of an ecological system to
absorb changes but still maintain its core function. In a social system, Adger et al. (2002:
358) define social resilience as “the ability of communities to absorb external changes and
stress, while maintaining the sustainability of their livelihoods”. Flood risk managers define
resilience as the ability of a system to recover from floods, while “resistance” is the ability to
prevent floods occurring (Bruijn 2004: 199). However, most resilience definitions address the
capacity of a system to cope with stress and external change, but still maintain its function.
The concept of resilience has recently been seen in a linked social and ecological system
(Adger 2000; Folke 2006; Folke, Berkes and Colding 1998). The resilience concept also
refers to the capacity for renewal, re-organization and development (Folke 2006: 253);
creativity (Adger 2000; Maguire and Hagan 2007), and transformation within a social-
ecological system (Walker et al. 2004).
Flooding in the MRD may not be an external change because most people experience
its impacts on their livelihoods every year. Flooding can be seen as part of the ecological-
social system since most people benefit from fishing and the fertile sediment left by the
floods. In particular, farmers can develop flood-based livelihoods to maintain household
income during the flood season. However annual flooding can also be seen as an “external
shock”, if the flood is either too big or too small and so exceeds the coping capacity of
households and communities. A big flood often disrupts rural livelihoods so many people are
affected. Therefore, the resilience concept in the context of living with floods in the MRD
can be defined as “the capacity of households to cope with, adapt to, and benefit from the
flood season”.
2.2 The Relationship between Livelihood Adaptation and Resilience
Three main bodies of literature discuss the ways rural households adopt livelihood
strategies to cope with climate change and other stresses. These include agricultural
extensification, agricultural intensification and livelihood diversification (Ellis 2000; Ellis
and Freeman 2005; Paavola 2008). Agricultural extensification refers to taking new units of
land for low-input cultivation. Agricultural extensification can also increase productivity and
reduce financial risks. However, the opportunity for extensification diminishes when the
scarcity of land increases due to pressures of population growth (Boserup 1975: 15).
Therefore, agricultural intensification can be a possible strategy for rural agricultural
households to cope with stresses in developing countries. Agricultural intensification, as it
was originally conceptualized by Boserup (1975: 28), involves the application of more labour
to a unit of land in order to achieve greater productivity (because of population growth and a
surplus of labour). However, agricultural intensification is placed at risk by market and
climate variability. Ellis (2000: 60) states that rural livelihoods in developing countries are
highly correlated with risks (market, climate variability, floods, and drought). Specialization
in the agricultural sector makes it more vulnerable to droughts and floods (Cutter, Boruff and
Shirley 2003). If there is a flood or drought in a particular locality, most farm income streams
are adversely affected or disrupted.
Ellis (2000: 15) defines livelihood diversification as “the process by which
households construct an increasingly diverse portfolio of livelihood activities and assets in
8
order to survive or improve living standards”. This means that livelihood diversification is the
creation of a livelihood portfolio comprising of farm, off-farm and non-farm income that is
less reliant on agriculture. Non-farm income, such as remittances, may provide more
advantages than farm income if adverse natural events disrupt farm income streams. Ellis
(2000: 11) defines different types of income sources as follows:
Farm incomes as income generated from own-account farming, whether on
owner-occupied land, or on land accessed cash or share tenancy, off-farm
income as wage or exchange labour on [the land of] other farmers, and non-
farm as “non-agriculture income sources such as remittances”.
A diversity of livelihood activities provides vital assets for buffering the effects of
extreme hazards. The greater diversity of income is, the greater the resilience of livelihoods
to disruption from particular sources (Adger 1999: 254). Livelihood diversity is a risk-
spreading strategy used by farmers in Samoa to cope with annual cyclones (Colding,
Elmqvist and Olsson 2003). There is more than one reason for this strategy. Firstly,
diversification of farming activities often faces a high risk of market failure in developing
countries. Secondly, agricultural sectors are very sensitive to climate variations, so it is not
appropriate to diversify on-farm activities (Adger et al. 2003). Therefore, livelihood diversity
from on-farm to off-farm and non-farm activities are important for achieving livelihood
resilience (Ellis and Freeman 2005; Paavola 2008). Evidence shows that households with
more income sources are less likely to be affected by floods in rural Bangladesh and by
climate change in rural coastal northern provinces of Vietnam (Adger and Kelly 1999;
Brouwer et al. 2007). Eriksen et al. (2005) found that remittances from rural-urban migration
can help to reduce the level of vulnerability in drought-affected households in Kenya.
However, it is argued that the poor diversify their livelihoods for survival, while the better-off
are more likely to diversify for wealth accumulation (Carswell 2000).
Although livelihood diversification can be a promising strategy to reduce both market
and climatic risks and alleviate poverty, the effect of diversification on household income is
still debatable. It has been shown that engaging in a large number of activities may not be as
economical as more intensive types of livelihood activities (Eriksen et al. 2005).
Additionally, Anderson and Deshingkar (2005) argue that diversification of income sources
does not necessarily increase a household’s income due to the cost of diversification. An
example is when a household in rural India changed from one to two income sources – their
total income reduced by 15% because of the increase in the cost of diversification. It can be
argued that specialization or intensification of livelihood activities is more important than
diversity of income sources (Anderson and Deshingkar 2005; Eriksen et al. 2005). The
average wage of a contract labourer is 25% higher than that of a casual farm labourer, while
industrial wages are 90% higher than that of casual work. However, Anderson and
Deshingkar (2005) did not take the issue of climate change into account. Eriksen (2005)
argues that intensity of one income source (brick making) is more important than diversity of
livelihood activities in coping with droughts in a rural context in Kenya. However, one of the
most critical reasons for livelihood diversification is to achieve a low-risk (market risk as
well as climate risk) income portfolio rather than an improvement in total income (Ellis
2000).
In the MRD rice is the main cash crop for most rural households so annual flooding
often disrupts rice farming during the flood months that do not have flood controls. The
question is “how can rural households maintain rural livelihoods during flood months without
any farming activities?” More particularly, “how can landless poor households live safely
without any income sources during the flood season?” Diversification of agricultural
9
activities on farms may allow rural households to improve their income, but they face market
risks. Recently, some households have attempted to diversify their rural on-farm income
using flood-based resources such as farming prawns, fish and vegetables in moderate and
low-flood-prone regions. Another way of diversifying is shifting from off-farm fishing (more
dependence on the flood season) to non-farm seasonal migration. Seasonal migration to Ho
Chi Minh City becomes an emerging livelihood strategy that allows poor households to
maintain their income during flood months.
2.3 Social Capital and Resilience to Environmental Hazards
In the relevant literature social capital plays an important role in economic
development, health outcomes, educational achievement, migration, coping with natural
hazards, disasters and climate change. The social capital theory first originated in the field of
sociology. Bourdieu (1986: 248-249) defines social capital as:
the aggregate of the actual or potential resources which are linked to
possession of a durable network of more or less institutionalized relationships
of mutual acquaintance and recognition – or in order words, to membership in
a group – which provides each of its members with the backing of the
collectivity-owned capital, a “credential” which entitles them to credit, in the
various senses of the word.
According to Bourdieu (1986) social capital can be actual or potential resources
(symbolic or material goods) for group members, meaning that participation in groups may
gain either symbolic or material resources. Social capital is formed by formal (institutional)
or informal (less institutional) relationships, which exist by exchanges of symbolic or
material goods to maintain network relationships. According to Bourdieu’s theory,
maintaining a social relationship is the key to developing social capital. Bourdieu (1986: 249)
shows that social capital “is not a natural given, or even a social given It is the product of
an endless effort at institution, of which institution rites – often wrongly described as rites of
passage – mark the essential moments and which is necessary in order to produce and
reproduce lasting, useful relationships that can secure material or symbolic profits”. Some
social networks are naturally created, such as kinship networks, but people have to invest in
most other social relationships. Bourdieu further claims that social capital is a collective asset
that is a product of group members as well as shared by group members. The amount of
social capital available to a person depends on the size of his or her networks or membership
of groups, or amount of capital (economic, cultural or symbolic) possessed by each of those
to whom he or she is related.
According to Lin (1999: 35) social capital can be defined as “resources embedded in a
social structure which are accessed and/or mobilized in purposive actions”. Lin (1999: 39)
argues that investment in social relations by individuals is the means through which they gain
access to embedded resources to enhance expected instrumental and expressive returns. For
Lin, benefits from social capital are an investment strategy. This is similar to Bourdieu’s
notion about the creation of social capital. Lin (1999: 36-41) demonstrates two types of
benefit from social capital: (1) returns to instrumental action (economic, social, political
returns); and (2) expressive return (e.g. physical and mental health and life satisfaction).
Social capital can be classified into different forms. Putnam (2000: 22) differentiates
between bridging and bonding social capital. Bonding social capital describes the cohesion
that exists between small groups of similar people such as family members (kinship), close
friends and colleagues, and perhaps the members of religious groups or neighbourhoods.
Bridging social capital describes the networks that link acquaintances (Meadowcroft and
10
Pennington 2008: 121). For Coleman (1988) social capital can be seen inside the social
structure such as the family (bonding social capital), or outside the family or community
(bridging social capital). Social capital can also be interpreted as vertical or horizontal (Grant
2001: 976). Horizontal social capital can be seen as bonding social capital that links members
of a community. Vertical social capital can be understood as bridging or linking social capital
that links communities with public institutions or governmental bodies.
While bonding social capital is good for understanding specific reciprocity and
mobilizing solidarity, bridging social capital is important for mobilizing to external resources
(Adger 2003; Mathbor 2007; Narayan 1999; Pelling 1998; Putnam 2000: 22). Narayan (1999)
argues that if there is strong bonding social capital, groups can help their members; however,
there will be a lack of bridging social capital due to the exclusion of external resources from
strangers. Bridging social capital between groups can create economic activities for less
powerful or excluded groups, such as the poor (Narayan 1999). Newman and Dale (2005)
argue that networks comprising a diversity of bridging, bonding, and linking social capital,
enhance a community’s ability to adapt to change; however, a network which comprises only
bonding social capital may reduce resilience. Pelling (1998) argues that bridging social
capital allows communities to access external resources from government and financial
institutions for coping with floods. Another typology of social capital is linking or
networking social capital, which is important to link bonding social capital and state or public
institutions in order to facilitate collective action to adapt to climate change (Adger 2003;
Mathbor 2007).
Whether social capital is classified into bonding, bridging, linking or vertical and
horizontal, it can be grouped into formal and informal social networks. The term social
network was mentioned in Bourdieu’s definition of social capital (Bourdieu 1986). Li et al.
(2005) grouped social capital into formal and informal social networks in studies of job
attainment in the UK in which social capital can be divided into three realms: neighbourhood
attachment, social network and participation in formal organizations. According to Li et al.
(2005) neighbourhood attachment refers to the degree to which people are attached to their
neighbourhood. Social network is the extent of people’s intimate interaction with those
beyond the immediate family or supportive networks (weak ties or bridging social network).
Informal social capital is defined as participation in civic organizations or linking social
capital.
Different forms of social capital are important at different times. Family members in
Kenya sent remittances back to households during drought years that helped to reduce
vulnerability (Eriksen et al. 2005; Smith et al. 2001). Hawkins and Maurer (2009) found that
close ties (bonding) were important for immediate support during disastrous events but that
bridging and linking social capital were vital for long-term survival and wider community
revitalization after a disaster. Airriess et al. (2008) found that co-ethnic social capital
(bonding) was very effective for evacuation, relocation and recovery both during and after
hurricane Katrina. Sanderson (2000) suggests that building social resources by enhancing
neighbourhood relationships can help to save lives at risk from floods. Pelling (1999)
suggests that social assets play a key role in shaping access to local, national and international
resources for coping with floods.
So far, most researchers have examined the effects of neighbourhood attachment on
health outcomes (Carpiano 2006; Caughy, Campo and Muntaner 2003; Veenstra et al. 2005;
Ziersch et al. 2005) and job attainment (Li et al. 2005). In the MRD neighbours are vital for
coping with and adapting to floods but little is known about the role of neighbours in living
with floods. Local people say “relatives who live far away are not as good as closer
11
neighbours”. Neighbours help to evacuate and they also lend food and money during floods
and share local knowledge to exploit the benefits of the flood season. Neighbours help to
repair houses and they share local knowledge to protect human life when fishing.
Relationships among neighbours are cultivated through cultural and religious activities such
as wedding parties and memorials to dead ancestors, and through recreational activities such
as sport, chess, and having coffee together in the early morning. If people have good relations
with their neighbours, they are more likely to mobilize resources when facing food, income
and housing insecurity during or after the flood season. Besides relationships with
neighbours, social supportive networks beyond the family such as friendships, religious
associates or other supportive networks, play an important role in accessing resources for
coping with floods. Flood-affected households are more likely to access relief or mutual
assistance if they have wider supportive networks. For example, farmers can access technical
knowledge for farming fish, neptunia prostrate (water mimosa), and prawns during the flood
season using friendship networks. Finally, participation in local groups and associations can
help rural households to access technical information on farming skills and relief resources
for adapting to floods.
Additionally, while most natural hazard studies explore the effects of bonding and
bridging social networks in coping with disasters and adapting to climate change in
qualitative terms, little is known about the quantitative effects of neighbourhood attachment
on household social supportive networks, participation in groups and associations and social
capital.
The analytical framework shows the complex relationship between household
resilience and social capital, livelihood adaptation, and the socio-economic conditions of
households (Figure 4). Firstly, household resilience can be determined by attributes such as
demographic characteristics, income status, housing characteristics and the location of
households within the flood-prone regions. It is clear that poor households are less likely to
cope with flooding because they worry about loss of income, food shortages, and their home
collapsing during the flood season. The regional flood factor can be a determinant that affects
household resilience to floods. Livelihood diversification can help rural households reduce
risk from natural hazards, but livelihood diversity is often determined by the economic status
of households and household location and access to land, financial resources and social
assets. In particular, social capital via good relations with neighbours helps rural households
to share local knowledge and technical information about livelihood strategies (Schwarze and
Zeller 2005; Smith et al. 2001). Through social networks of friends or members of various
local groups and associations, households may gain information about adapting to new ways
of living with floods or how to receive emergency support, such as rice or money to survive
during the flood season. Social capital may directly affect household resilience to floods by
accessing material or non-material goods from their networks to cope with each flood season.
However, different forms of household social capital are determined by the socio-economic
conditions of households (Li et al. 2005).
12
Figure 4. Analytical framework for examining the relationship between social capital, livelihood adaptation
and household resilience to floods in the MRD
3.0 METHODOLOGY
3.1 Selection of Study Sites
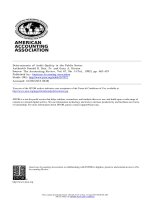
Three communes were selected to represent different flood regions of the MRD. The
first research site, Phú Đức commune in Tam Nông district, Đồng Tháp province, is located
in the most flood-prone region. The second study site, Thạnh Mỹ Tây commune in Châu Phú
district, An Giang province, is located in a moderately flood-prone area. The third study site,
Trung An commune in Cờ Đỏ district, CầnThơ City, is situated in the region with the lowest
risk of flooding (Figure 5). The socio-economic conditions and livelihood activities of the
three locations are represented in Table 3.
Informal social capital
Neighbourhood
attachment
Social networks
Formal social capital
Participation in
formal
organizations
Household characteristics
Household income
Household size
Gender of the respondent
Age of the respondent
Housing attributes (type and
location)
Regional flood characteristics
(low, moderate, and high flood-
prone regions)
Household
resilience to
floods
Livelihood choices
Diversification
Specialization
13
Table 3. Socio-economic conditions and livelihood activities of the three study sites
Socio-economic,
demographic and
flood conditions
Selected sub-districts
Site 1: Phú Đức
commune – Tam
Nông district –
Đồng Tháp
province
Site 2: Thạnh Mỹ
Tây commune –
Châu Phú district –
An Giang province
Site 3: Trung An
commune – Cờ Đỏ
district, CầnThơ
City
Population (people)
6,940
25,100
13,606
Population density
(people per sq km)
212
637
194
Households
1,586
5,141
2,362
Land area (ha)
5,170
3,656
1,197
Poverty (%)
11.4
11.5
12.0
Flood depth
>2.5 m (over 5
months)
1.5-2.5 m (4-5
months)
<1.5 m (<3 months)
Source: Thạnh Mỹ Tây People’s Committee (2009), Phú Đức, People’s Committee (2009), and Trung An
People’s Committee (2009)
Figure 5: Location of the Mekong River Delta and the study sites
3.2 Data Collection
The study employed both qualitative and quantitative research approaches to
investigate the relationship between social capital and household resilience to the floods in
the MRD. The three key qualitative data collection approaches for this study included field
observations, in-depth interviews with key informants and focus group discussions (FGDs),
and field observation. Four FGDs were carried out in each commune, each covering a range
of social classes and gender. Some 10 in-depth interviews were conducted with key
Sai Gon River
D
o
n
g
N
a
i
R
i
v
e
r
H
a
u
R
i
v
e
r
b
b
b
b
b
Tan Chau
Gauging
Station
Chau Doc
Gauging
Station
Tri Ton
Gauging
Station
Hung Th anh
Gauging
Station
Moc H oa
Gauging
Station
CAMBODIA
T
i
e
n
R
i
v
e
r
b
Gauging
Station
Name
Legend
b
Ta Lai
Gauging Station
Alarm Level 3 = 113 .0 m
Ca Mau
Dong Nai
Long An
Kien Giang
An Giang
Can Tho
Soc Trang
Dong Thap
Bac Lieu
Ben Tre
Tra Vinh
Tien Giang
Ho Chi Minh
Vinh Long
Ba Ria Vung Tau
None
Low
Moderate
High
Provincal Flood Condition
N
EW
S
2
1
3
14
informants at the three study sites. Information from the qualitative research was used for
designing the structured questionnaires for the household survey, which was conducted in
August 2010. The questionnaire had nine sections. Section one comprised general
information about the respondents. Section two collected demographic information about
each household member. Section three explored respondents’ perceptions of the natural
characteristics of floods and of flood impacts on communities and household livelihood
activities and assets. Section four was concerned with information about household income
and income sources in the previous 12 months. Section five asked respondents to rate their
level of agreement about neighbourhood attachment using five-point Likert scales. In
addition, section five also asked questions related to social networks and about participation
in groups and associations. Section six obtained information about expected levels of well-
being that reflect household capacity to learn from, cope with, and adapt to floods. Both
attitudinal and behavioural questions were used to ask about household resilience capacity
using a five-point Likert scale. A face-to-face interview was conducted with the head of each
household (husband or wife). The members of the faculty of Agricultural and Natural
Resources of An Giang University were trained to conduct these interviews. The interviews
were conducted during the flood months in order to encourage respondents to talk about their
experience of living with floods. These were conducted at the farmers’ homes, at a suitable
time, in order to maximize the willingness of respondents to participate.
3.3 Sampling Procedures
The stratified sampling approach was used to divide the total population of the delta
into sub-populations of “three communes”, based on the existing socio-economic and natural
flood characteristics of the delta. Within each stratum, five hamlets were randomly chosen
and 30 households were randomly selected from the wealth ranking of households in each
hamlet. The local classification of well-being was obtained from participatory research using
focus group discussions and in-depth interviews with key informants. The samples were
chosen on the basic of social class: poor, medium-income and better-off (Table 4). This
approach has been widely used in rural development and natural hazard studies in developing
countries (Phóng Trần et al. 2008; Smith et al. 2001). Through focus group discussions with
respondents in the three study sites, the level of well-being was determined using the
following criteria; access to natural resources (ownership of agricultural land); housing
quality; level of income and primary occupation: income sources or primary livelihood
activity. For example, a poor household was defined as one that was: (1) landless or has
ownership of very little land (less than 0.5 ha); (2) average income per capita of each adult in
the household is less than VND
3
250 thousand per month (12 USD per month); (3) income
source is mainly from daily off-farm agricultural labouring; and (4) owning a simple house.
Medium-income households often own agricultural land (more or less 1 ha, but less than 2
ha), derive an income from a mixture of farm and off-farm labouring activities, and have
semi-permanent houses. Better-off households often own more agricultural land (more than 2
ha), receive income from specialization in rice farming, are less likely to engage in off-farm
labouring, and often have a good quality home. The total sample size in each case study was
150, as illustrated in Table 4. The exception was Thạnh Mỹ Tây commune, where there were
159 samples.
3
One USD (in September 2011) is roughly equivalent to Vietnamese Dong (VND) 20,830.00.
15
Table 4. Distribution of types of households across the three study sites
Name of
commune
Type of household
Total
Poor
Medium
Better-off
Phú Đức commune
N
69
40
41
150
Thạnh Mỹ Tây commune
N
56
50
53
159
Trung An commune
N
56
42
52
150
Total
N
181
132
146
459
3.4 Characteristics of the Respondents
Respondent (household) characteristics are presented in Table 5. The average age of
respondents was 52 years old. The youngest respondent was 25 years old, whereas the oldest
was 96. The proportion of male respondents was higher than that of female respondents
(85.40% of respondents were male). Most male respondents were married (89.8%) and were
the head of the household. Some 8.5% of the respondents were widowed and very few
respondents were single or separated.
The education level of respondents was generally low. The majority of the
respondents completed only primary education (53.60%), while 23.30% completed secondary
education. The proportion of illiterate respondents was relatively higher, and very few
respondents had completed a vocational education, or attended college or university. The
sample illustrates that the education level of family members was relatively low. Some 10%
of family members did not know how to read and write. Some 43.0% of family members
completed primary school while only 29.0% of family members finished secondary school
and 12.0% completed high school. A small proportion of family members completed
vocational training (2.0%) and 10% of family members did not know how to read and write.
The average household size was 4.7. The maximum household size in the sample was
eight, while the minimum size was one. The average number of children aged less than 15 in
the household was 0.9 (1-4) while the average number of adults was 3.2 (1-7), and the
average number of people aged more than 60 was 0.5 (1-3). The gender rate of households
was equally distributed. The average number of females in a household was 2.3, and 2.3 for
male members. Most respondents follow the Hòa Hảo Buddhism religion (61.40%), and
Buddhism (31.20%), while very few respondents belong to the Cao Đài religion (3.5%) or are
Catholic (2.0%).
Poor households account for 39.4% of the sample, followed by well-off households
(31.8%) and medium-income households (28.8%). Nearly half of the respondents reported
that they are landless
4
(45.32%), 14.6% of respondents own less than 1 ha of rice land and
28.32% of respondents own from 1 ha to less than 3 ha. Some 12.2% of the respondents own
more than 3 ha of rice land. Average household income was VND 60.8 million (USD
2,918.86) per year. However, the average income of poor households was 15.9 million VND
(USD 765.94) per year. For medium-income households it was VND 53.18 million (USD
2,553.04) per year, while better-off households had an average income of VND 123.1 million
(USD 5,909.74) per year. The per capita income of each person was an average of VND 12.5
million (USD 600.09) per year. Per capita income in poor households was VND 3.5 million
(USD 168.02) per year. In medium-income households per capita income was VND 12.0
million (USD 576.09), and it was VND 24.2 million (USD 1,161.78) in better-off
households.
4
Landless in this context means people who reported that they do not have agricultural land only. The
ownership of residential land was not included in the local definition of landless.
16
Table 5. Respondent (household) characteristics
Respondent (household) characteristics
Value
Total respondents
459
Respondent average age (median value)
52 (51)
Minimum age
25.00
Maximum age
96.00
Percentage of male respondents in the sample
85.40
Marital status of respondents (%)
Single
1.50
Married
89.80
Widowed
8.50
Separated
0.20
Literacy rate respondents (%)
Never attend school (illiterate)
13.90
Primary education
53.60
Secondary education
23.30
High school
8.10
College
0.90
Undergraduate and above
0.20
Religion (%)
Hòa Hảo Buddhism
61.40
Cao Đài
3.50
Buddhism
31.20
Catholic
2.00
No religion
2.00
Household level of reported well-being (%)
Poor households
39.40
Medium-income households
28.80
Better-off households
31.80
Land area (%)
Landless
45.32
Less than 1 ha
14.16
From 1 to less than 3 ha
28.32
More than 3 ha
12.20
Average household size (min-max)
4.73 (1-8)
Gender distribution in the household
Percentage of females in the household (%)
49.00
Percentage of males in the household (%)
50.00
Educational level of household members
Percentage of illiterate people in the household (%)
10.00
Percentage of people completing primary education in the
household (%)
43.00
Percentage of people completing secondary education in the
household (%)
29.00
Percentage of people completing high school in the household
12.00
Percentage of people completing vocational education in the
household (%)
2.00
Percentage of people completing a college degree in the
household (%)
1.00
Percentage of people completing a university degree in the
household (%)
2.00