Glycoprotein methods protocols - biotechnology 048-9-463-470.pdf
Bạn đang xem bản rút gọn của tài liệu. Xem và tải ngay bản đầy đủ của tài liệu tại đây (107.74 KB, 8 trang )
Assay for MHC-Unretricted MUC1-Specific CTL 463
463
38
Analysis of the Frequency of MHC-Unrestricted
MUC1-Specific Cytotoxic T-Cells in Peripheral Blood
by Limiting Dilution Assay
John R. McKolanis and Olivera J. Finn
1. Introduction
Mucins are highly glycosylated proteins present on the lumenal side of ductal epi-
thelial cells. MUC1 is the only mucin with a transmembrane region anchoring it to the
cell surface. The extracellular domain of MUC1 is composed of numerous tandem
repeats of a 20-amino acid sequence (1). Normal cells produce a highly glycosylated
and sialylated form of MUC1. The O-linked carbohydrate side chains of MUC1 on
tumor cells are shorter and less abundant, exposing previously unrecognized antigenic
sites on the polypeptide core of the molecule (2). This underglycosylated MUC1 mol-
ecule on tumor cells can be recognized as a tumor-specific antigen by T-cells. The
major cytotoxic T-lymphocyte (CTL) response to tumor-specific MUC1 is T-cell
receptor (TCR) mediated but major histocompatibility complex (MHC)-unrestricted.
Owing to the high density of repeating antigenic epitopes extending along each MUC1
molecule, it is postulated that a large number of TCRs can be triggered simultaneously
to activate the CTLs to kill tumor cells or proliferate (3–5). Antibodies specific for the
TCR, or for the defined MUC1 epitope recognized by the TCR, inhibit CTL recogni-
tion. Antibodies against MHC molecules have no effect.
In addition to the MHC-unrestricted CTLs, some MUC1-specific MHC-restricted
CTLs have also been identified. Patients who are HLA-A11 and HLA-A3 have CTLs
that recognize a nine amino acid peptide from the tandem repeat region bound to these
alleles (6). Another peptide has been reported that binds HLA-A2.1 allele (7).
Although it is not yet clear whether these CTLs, MHC unrestricted or MHC restricted,
have a therapeutic function, it has been considered important to measure their fre-
quency pre- and post vaccination with MUC1-based immunogens used in various clini-
cal trials (7–9) in order to be able to correlate this specific component of the antitumor
response with the outcome of the trial.
From:
Methods in Molecular Biology, Vol. 125: Glycoprotein Methods and Protocols: The Mucins
Edited by: A. Corfield © Humana Press Inc., Totowa, NJ
464 McKolanis and Finn
We have established a limiting dilution assay (LDA) to evaluate the frequency of
MHC-unrestricted MUC1-specific CTL. This assay is convenient because the same
conditions and reagents can be applied to all patients regardless of their HLA type. We
believe that these CTLs will be an important corollary of a tumor-specific immune
response because they recognize an epitope that is expressed only on tumor cells and
not on normal epithelial cells. The same assay may be used to determine the frequency
of MHC-restricted CTL. However, the assay must be custom tailored to each patient,
or at least to several specific HLA alleles.
2. Materials
1. RPMI-1640 tissue culture medium supplemented with 10% fetal calf serum (FCS) or
human AB serum, 2 mM L-glutamine, 100 Units/mL penicillin, 100 µg/mL streptomycin.
2. Human male AB serum purchased from Gemini Bio Products, Calabasas, CA.
3. FCS purchased from Life Technologies, Grand Island, NY.
4. Glutamine, purchased as 100X stock from Life Technologies, Grand Island, NY.
5. Penicillin-streptomycin, purchased as 100x stock from Life Technologies.
6. Hepes buffer, purchased as 100X stock from Life Technologies.
7. Recombinant interleukin-2 (rIL-2), obtained from several sources.
8. Phytohemagglutinin (PHA-P), purchased from Sigma, St. Louis, MO.
9. Trypan blue, 0.4% stock solution, purchased from Life Technologies.
10. Phosphate buffered physiologic saline (1.9 mM NaH
2
PO
4
, 8.1 mM NaHPO
4
, 154 mM
NaCl, pH 7.2); may also be purchased as a 10X stock solution.
11.
51
Sodium chromate and
3
H thymidine, purchased from Amersham, Arlington Heights, IL.
12. Ficoll density gradient, purchased as LSM from Organon Technica Corp, Durham, NC.
13. DNAase, purchased from Calbiochem, La Jolla, CA. Filter-sterilized stock solution at
10 mg/mL in RPMI-1640 containing HEPES buffer should be kept frozen at –80°C.
14. Dimethyl sulfoxide (DMSO) purchased from Sigma.
15. Tumor cells that express MUC1 can be obtained from American Type Culture Collection
(ATCC), Rockville, MD, or as gifts from various investigators. Epstein-Barr virus (EBV)
immortalized B-lymphoblastoid cell lines or other cells transfected with the MUC1 gene
can be obtained from various investigators. Natural killer and lymphokine-activated killer
(LAK) cell target K562 can be purchased from ATCC.
16. Styrofoam boxes for slow freezing of cells, purchased from Sarstadt, Newton, NC.
17. 96-well, U-bottomed microtiter plates, purchased from Becton Dickinson, Franklin Lakes, NJ.
18. Cytotoxicity assay harvesting materials, purchased from Scatron Instruments, Sterling, VA.
3. Methods
3.1. Isolation of Mononuclear Cells from Peripheral Blood
Blood samples are obtained from patients at specific time intervals, depending on
the goals of the study. Peripheral blood mononuclear cells are separated from the rest
of the blood using cenrifugation through Ficoll density gradient (LSM). This involves
layering 10 mL of blood diluted 1:2 in RPMI medium without serum, over 3 mL of
LSM in a 15-mL conical centrifuge tube. Following centrifugation at 400g for 20 min,
mononuclear cells can be removed from the interface between the two layers. The
cells are washed three times in phosphate-buffered saline (PBS) to remove contami-
nating LSM. From 1 mL of blood we obtain 1–2 × 10
6
cells.
Assay for MHC-Unretricted MUC1-Specific CTL 465
3.2. Cryopreservation of Cells
Mononuclear cells are frozen in 90% FCS and 10% DMSO at a concentration of
5–10 × 10
6
cells/mL. The cells are first resuspended in cold FCS at one-half of the
final volume. The remaining volume of cold FCS with 20% DMSO is then added
dropwise while swirling the tube. A controlled rate of freezing can be simulated by
simply placing the vials in a styrofoam box in a –80°C freezer overnight. The vials are
then transferred to liquid nitrogen for long-term storage.
At the time of the assay, the vials are thawed rapidly in a 37°C water bath. The
contents are transferred to 10 mL of RPMI-1640 containing 30 µg/mL of DNAase.
Following a 30-min incubation at 37°C, the cells are washed three times in PBS. Viable
cells are counted by diluting the sample 1:2 in trypan blue and counting in a hemocy-
tometer the cells that have not taken up the color blue.
3.3. Setting up the LDA Cultures
In the LDA culture assay, hundreds of peripheral blood lymphocyte microcultures
are stimulated once in vitro with the appropriate antigen. The cells are grown in 96-well
U bottomed plates.
1. At each dilution, seed peripheral blood lymphocytes in a 100-µL volume into 24 wells of
a round-bottomed 96-well microtiter plate (see Fig. 1). We routinely use twofold dilu-
tions of cells starting with 2 × 10
5
cells/well and ending with 6.25 × 10
3
cells/well. (see
Note 1). Culture medium is RPMI-1640 supplemented with 10% human AB serum, peni-
cillin, and streptomycin.
2. Add irradiated (6000 RADS) stimulator cells expressing MUC-1 in a 50-µL volume at a
concentration of 2 × 10
4
/well.
3. Use irradiated (3000 rad) autologous peripheral blood lymphocytes (PBLs) as “feeder”
cells, and add at a concentration of 2 × 10
4
/well in a 50-µL volume. Suspend the “feeder”
cells in culture medium containing one half of the optimal concentration of IL-2 (see
Notes 1–4).
4. Following 7 d, in culture, remove 100 µL of culture medium from each well and replace
with fresh medium containing IL-2. Perform the CTL assay on d 10.
3.4. Setting up the CTL Assay
1. If adherent, trypsinize target cells and wash 1 × 10
6
cells three times in PBS. After the last
wash, carefully aspirate the supernatant so that the smallest possible volume remains.
2. Resuspend the cell pellet in 100 µL of fresh
51
Cr, specific activity 1 mCi/mL, and incu-
bate at 37°C for 1–2 h. Shake the tube periodically to keep the cells in suspension.
3. Following three washes, place 1 × 10
3
cells in a gamma counter to determine the uptake
of radioactivity and thus ensure proper labeling. If less than 500 counts are obtained with
tumor cells or 300 counts with EBV-transformed B-cells, a new batch of targets should be
prepared. The new targets should be labeled for a longer period of time or newer chro-
mium should be used.
4. While the targets are being prepared, the rest of the assay can be set up. Each well of the
original plates should be carefully mixed with a micropipettor and transferred into two
wells of a 96-well microtiter V-bottomed plate (“split-well” assay). Thus, row A of the
original 96-well plate becomes rows A and B of the assay plate (see Fig. 1). Each new
well contains 100 µL of the original 200-µL cell cuture.
466 McKolanis and Finn
5. To each new well, add 2.5 × 10
4
unlabeled LAK target cells in a volume of 50 µL. For
CTL assays with tumor cells as labeled target cells, we use unlabeled K562 cells. When
MUC1 transfected EBV B-cells are used as targets, we use unlabeled parental EBV cells
to compete out the LAK lysis.
6. At each dilution, add 1 × 10
3
of the labeled specific targets to one of the split wells and to
the other well 1 × 10
3
labeled control targets, in 50-µL volumes. Include several wells
containing only target cells for spontaneous and maximal release values
7. Centrifuge the plates at 150g for 5 min and incubate at 37°C for 4 h.
8. Harvest supernatant from the wells and count the radioactive chromium released from
lysed cells. Obtain maximal release values following lysis of the cells in designated wells
with acid or hypertonic saline.
9. Calculate specific release using the following formula: 100 × (sample release – spontane-
ous release/maximal release – spontaneous release).
10. Calculate percentage of specific release for each well containing the specific target and
compare this with the corresponding well containing the control target. Wells are scored
positive if specific target cell lysis is 15% greater than the control (see Note 7).
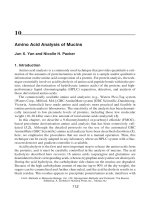
Fig. 1. An example of an experiment utilizing limiting dilution culture, showing the process
of setting up the original culture plates and the final assay plates. In the culture plates, each cell
concentration is represented by two rows (24 wells). Each culture well is split into two assay
wells. The black wells in the assay plates were scored positive for CTL activity. Rows A con-
tain the MUC1
+
target, and rows B contain the negative control target.
Assay for MHC-Unretricted MUC1-Specific CTL 467
3.5. Calculation of the CTL Frequency
Inasmuch as positive wells may contain more than one responding T-cell, the fre-
quency of antigen-specific cells is determined by the number of negative wells in each
dilution. The number of negative wells is divided by the total number of wells at each
dilution. This fraction is converted to its base 10 log and is plotted on a log scale against
the number of cells added to each well. The Maximal Likelihood method is one of the
best statistical estimators used to find the best fitting straight line going through the
origin (10). Linear regression can also be utilized. It is assumed in these assays that all
parameters for T-cell growth are optimal and that any well containing antigen-specific
cells will be positive in the assay. The single hit model of Poisson distribution predicts
that when 37% of the test cultures are negative, there is an average of one precursor cell
per well (11). Several statistical computer programs are available to simply evaluate the
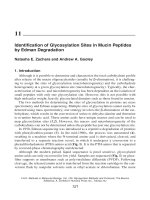
data. Figure 2 shows graphic data from the assay represented by Fig. 1 on an individual
with slightly elevated frequency of MUC1-specific cells.
3.6. LDA Special Considerations
3.6.1. Time of Assay
LDA assays can be used to quantitate specific CTL precursors that need in vitro reactiva-
tion, or recently activated specific effector CTL. Precursor CTL are determined following 10
or 11 d in culture with antigen. Activated CTL could be assayed after 3–5 d of culture.
Fig. 2. MUC1-specific CTL frequency derived from the results depicted in Fig. 1. The solid
line represents CTL frequency derived in the absence, and the broken line represents CTL
frequency derived in the presence of anti-HLA class I antibody W632, illustrating the MHC-
unrestricted nature of the CTL. The log of the fraction of negative cultures is plotted on a log
scale against the number of cells per well. Linear regression analysis was used to calculate the
slope. The wells containing 200,000 cells had no negative wells; thus, the value is 0 and is not
plotted. A frequency of 1/65,949 for untreated cultures and 1/57,542 for antibody-treated cul-
tures is determined when 37% of the cultures are negative. This is shown at the intersection of
the two plotted lines with the horizontal dashed line.