FM11 Ch 13 Analysis of Financial Statements
Bạn đang xem bản rút gọn của tài liệu. Xem và tải ngay bản đầy đủ của tài liệu tại đây (112.22 KB, 46 trang )
13 - 1
Ratio analysis
Du Pont system
Effects of improving ratios
Limitations of ratio analysis
Qualitative factors
CHAPTER 13
Analysis of Financial Statements
13 - 2
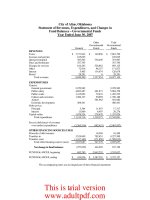
Income Statement
2004 2005E
Sales 5,834,400 7,035,600
COGS 4,980,000 5,800,000
Other expenses 720,000 612,960
Deprec. 116,960 120,000
Tot. op. costs 5,816,960 6,532,960
EBIT 17,440 502,640
Int. expense 176,000 80,000
EBT (158,560) 422,640
Taxes (40%) (63,424) 169,056
Net income (95,136) 253,584
13 - 3
Balance Sheets: Assets
2004 2005E
Cash 7,282 14,000
S-T invest. 20,000 71,632
AR 632,160 878,000
Inventories 1,287,360 1,716,480
Total CA 1,946,802 2,680,112
Net FA 939,790 836,840
Total assets 2,886,592 3,516,952
13 - 4
Balance Sheets: Liabilities & Equity
2004 2005E
Accts. payable 324,000 359,800
Notes payable 720,000 300,000
Accruals 284,960 380,000
Total CL 1,328,960 1,039,800
Long-term debt 1,000,000 500,000
Common stock 460,000 1,680,936
Ret. earnings 97,632 296,216
Total equity 557,632 1,977,152
Total L&E 2,886,592 3,516,952
13 - 5
Other Data
2004 2005E
Stock price $6.00 $12.17
# of shares 100,000 250,000
EPS -$0.95 $1.01
DPS $0.11 $0.22
Book val. per share $5.58 $7.91
Lease payments 40,000 40,000
Tax rate 0.4 0.4
13 - 6
Standardize numbers; facilitate
comparisons
Used to highlight weaknesses and
strengths
Why are ratios useful?
13 - 7
Liquidity: Can we make required
payments as they fall due?
Asset management: Do we have the right
amount of assets for the level of sales?
What are the five major categories of
ratios, and what questions do they
answer?
(More…)
13 - 8
Debt management: Do we have the
right mix of debt and equity?
Profitability: Do sales prices exceed
unit costs, and are sales high
enough as reflected in PM, ROE, and
ROA?
Market value: Do investors like what
they see as reflected in P/E and M/B
ratios?
13 - 9
Calculate the firm’s forecasted current
and quick ratios for 2005.
CR
05
= = = 2.58x.
QR
05
=
= = 0.93x.
CA
CL
$2,680
$1,040
$2,680 - $1,716
$1,040
CA - Inv.
CL
13 - 10
Expected to improve but still below
the industry average.
Liquidity position is weak.
Comments on CR and QR
2005E 2004 2003 Ind.
CR 2.58x 1.46x 2.3x 2.7x
QR 0.93x 0.5x 0.8x 1.0x
13 - 11
What is the inventory turnover ratio as
compared to the industry average?
Inv. turnover =
= = 4.10x.
Sales
Inventories
$7,036
$1,716
2005E 2004 2003 Ind.
Inv. T. 4.1x 4.5x 4.8x 6.1x
13 - 12
Inventory turnover is below
industry average.
Firm might have old inventory, or
its control might be poor.
No improvement is currently
forecasted.
Comments on Inventory Turnover
13 - 13
Receivables
Average sales per day
DSO is the average number of days
after making a sale before receiving
cash.
DSO =
= =
= 45.5 days.
Receivables
Sales/365
$878
$7,036/365
13 - 14
Appraisal of DSO
■
Firm collects too slowly, and
situation is getting worse.
■
Poor credit policy.
2005 2004 2003 Ind.
DSO 45.5 39.5 37.4 32.0
13 - 15
Fixed Assets and Total Assets
Turnover Ratios
Fixed assets
turnover
Sales
Net fixed assets
=
= = 8.41x.
$7,036
$837
Total assets
turnover
Sales
Total assets
=
= = 2.00x.
$7,036
$3,517
(More…)
13 - 16
FA turnover is expected to exceed
industry average. Good.
TA turnover not up to industry
average. Caused by excessive
current assets (A/R and inventory).
2005E 2004 2003 Ind.
FA TO 8.4x 6.2x 10.0x 7.0x
TA TO 2.0x 2.0x 2.3x 2.5x
13 - 17
Total liabilities
Total assets
Debt ratio =
= = 43.8%.
$1,040 + $500
$3,517
EBIT
Int. expense
TIE =
= = 6.3x.
$502.6
$80
Calculate the debt, TIE, and EBITDA
coverage ratios.
(More…)
13 - 18
All three ratios reflect use of debt, but
focus on different aspects.
EBITDA
coverage
= EC
= =
5.5x.
EBIT + Depr. & Amort. + Lease payments
Interest Lease
expense pmt.
+ + Loan pmt.
$502.6 + $120 + $40
$80 + $40 + $0
13 - 19
Recapitalization improved situation,
but lease payments drag down EC.
How do the debt management ratios
compare with industry averages?
2005E 2004 2003 Ind.
D/A 43.8% 80.7% 54.8% 50.0%
TIE 6.3x 0.1x 3.3x 6.2x
EC 5.5x 0.8x 2.6x 8.0x
13 - 20
Very bad in 2004, but projected to
meet industry average in 2005.
Looking good.
Profit Margin (PM)
2005E 2004 2003 Ind.
PM 3.6% -1.6% 2.6% 3.6%
PM = = = 3.6%.
NI
Sales
$253.6
$7,036
13 - 21
BEP =
= = 14.3%.
Basic Earning Power (BEP)
EBIT
Total assets
$502.6
$3,517
(More…)
13 - 22
BEP removes effect of taxes and
financial leverage. Useful for
comparison.
Projected to be below average.
Room for improvement.
2005E 2004 2003 Ind.
BEP 14.3% 0.6% 14.2% 17.8%
13 - 23
Return on Assets (ROA)
and Return on Equity (ROE)
ROA =
= = 7.2%.
Net income
Total assets
$253.6
$3,517
(More…)
13 - 24
ROE =
= = 12.8%.
Net income
Common equity
$253.6
$1,977
2005E 2004 2003 Ind.
ROA 7.2% -3.3% 6.0% 9.0%
ROE 12.8% -17.1% 13.3% 18.0%
Both below average but improving.
13 - 25
ROA is lowered by debt interest
expense lowers net income, which
also lowers ROA.
However, the use of debt lowers
equity, and if equity is lowered more
than net income, ROE would increase.
Effects of Debt on ROA and ROE