vogel - financial market; bubbles and crashes (2010)
Bạn đang xem bản rút gọn của tài liệu. Xem và tải ngay bản đầy đủ của tài liệu tại đây (2.23 MB, 386 trang )
Financial Market Bubbles and Crashes
One would think that economists would by now have already developed a solid
grip on how financial bubbles form and how to measure and compare them. This
is not the case. Despite the thousands of articles in the professional literature
and the millions of times that the word “bubble” has been used in the business
press, there still does not appear to be a cohesive theory or persuasive empirical
approach with which to study bubble and crash conditions.
This book presents what is meant to be a plausible and accessible descriptive
theory and empirical approachto the analysis of such financial market conditions.
It advances this framework through application of standard econometric methods
to its central idea, which is that financial bubbles reflect urgent short side –
rationed demand. From this basic idea, an elasticity of variance concept is
developed. The notion that easy credit provides fuel for bubbles is supported. It
is further shown that a behavioral risk premium can probably be measured and
related to the standard equity risk–premium models in a way that is consistent
with conventional theory.
Harold L. Vogel was ranked as top entertainment industry analyst for ten years
by Institutional Investor magazine and was the senior entertainment industry
analyst at Merrill Lynch for seventeen years.
He is a chartered financial analyst (C.F.A.) and served on the New York State
Governor’s Motion Picture and Television Advisory Board and as an adjunct
professor at Columbia University’s Graduate School of Business. He also taught
at the University of Southern California’s MFA (Peter Stark) film program and
at the Cass Business School in London. He earned his Ph.D. in economics from
the University of London and currently heads an independent investment and
consulting firm in New York City.
Mr. Vogel is the author of the seven editions of Entertainment Industry Eco-
nomics (eighth forthcoming) and Travel Industry Economics, all published by
Cambridge University Press.
Reprinted with permission from Kevin KAL Kallaugher, www.Kaltoons.com
Financial
Market
Bubbles
and
Crashes
Harold L. Vogel
CAMBRIDGE UNIVERSITY PRESS
Cambridge, New York, Melbourne, Madrid, Cape Town, Singapore,
S
˜
ao Paulo, Delhi, Dubai, Tokyo
Cambridge University Press
32 Avenue of the Americas, New York, NY 10013-2473, USA
www.cambridge.org
Information on this title: www.cambridge.org/9780521199674
© Harold L. Vogel 2010
This publication is in copyright. Subject to statutory exception
and to the provisions of relevant collective licensing agreements,
no reproduction of any part may take place without the written
permission of Cambridge University Press.
First published 2010
Printed in the United States of America
A catalog record for this publication is available from the British Library.
Library of Congress Cataloging in Publication data
Vogel, Harold L., 1946–
Financial market bubbles and crashes / Harold L. Vogel.
p. cm.
Includes bibliographical references and index.
ISBN 978-0-521-19967-4 (hardback)
1. Capital market. 2. Financial crises. 3. Commercial crimes. I. Title.
HG4523.V64 2010
338.5
42–dc22 2009038062
ISBN 978-0-521-19967-4 Hardback
Cambridge University Press has no responsibility for the persistence or
accuracy of URLs for external or third-party Internet Web sites referred to in
this publication and does not guarantee that any content on such Web sites is,
or will remain, accurate or appropriate.
TO MY DEAR PARENTS
–
WHO WOULD HAVE GREATLY ENJOYED SEEING THIS
Contents
Prologue page xiii
Preface xvii
Part I: Background for analysis 1
Chapter 1 Introduction 3
1.1 Overview 3
1.2 On the nature of humans and bubbles 7
Macro aspects 7
Social and utility theory aspects 11
Psychology and money 13
Equilibrium aspects 14
1.3 Central features 14
1.4 On defining bubbles 15
vii
viii Contents
Chapter 2 Bubble stories 27
2.1 Tulips 27
2.2 England and France, 1700s 29
South Sea Bubble 29
Mississippi Bubble 30
2.3 The Roaring Twenties 32
2.4 Japan 1989 34
2.5 Tech/Internet Stocks, 1987 and 2000 38
2.6 Housing, credit, and commodities, 2002–8 42
Housing and credit 42
Commodities 46
2.7 Conclusions 48
Chapter 3 Random walks 60
3.1 The efficient market hypothesis 61
3.2 Capital Asset Pricing Models 62
3.3 Volatility aspects 65
Volatility and modern portfolio theory 65
Volatility implications 66
3.4 Conclusions 69
Chapter 4 Bubble theories 77
4.1 Rational expectations 77
4.2 Behavioral features 79
Behavioral finance I 79
Behavioral finance II 81
Herding and anomalies 84
4.3 Asset bubble and crash analyses 86
Rational bubbles and crashes 88
Other studies 91
Testing methods 95
Flow of funds factors 96
Crashes 98
4.4 Power laws and chaos concepts 99
Power laws 99
Chaos concepts 103
4.5 Conclusions 104
Chapter 5 Framework for investigation 120
5.1 What’s a bubble? 121
5.2 Credit, debt, and other commonalities 123
5.3 Entropy and information 127
Contents ix
5.4 Toward a new theory 130
Characterizational issues 130
Geary’s test 131
Length and number of runs 132
Launch zone conditions 133
Peak zone conditions 133
Real runs analysis 134
Transactions volume aspects 139
5.5 Conclusions 140
Part II: Empirical features and results 151
Chapter 6 Bubble basics 153
6.1 Equity risk premiums 154
Overview 154
Estimation problems 154
6.2 Preliminaries 161
Procedural approach 163
Searching for launch zones 165
6.3 Persistence measures 166
6.4 Equilibrium concepts 168
Equilibrium concepts I – quasi-equilibrium 169
Equilibrium concepts II – Walras, B
´
enassy,
and Malinvaud 170
6.5 Trading volume and variance 172
6.6 Conclusions 173
Chapter 7 Bubble dynamics 183
7.1 Setting up 183
7.2 Path-length, elasticity, and exponentiality 184
Path-lengths 185
Elasticity 187
Absolute quasi-equilibrium 189
Exponentiality 191
Finding bubbles 194
Bubble strength indicator 197
7.3 Reality checks 200
First interpretations 200
Market metrics 201
Coincidental history 202
7.4 Conclusions 205
x Contents
Chapter 8 Money and credit features 215
8.1 Historical perspectives 215
Theories 215
Realities 217
8.2 Liquidity issues 218
8.3 Role of central banks 222
8.4 Conclusions 223
Chapter 9 Behavioral risk features 229
9.1 Behavioral risk premium 229
9.2 High anxiety 230
9.3 Crooked smiles 230
9.4 Transactions per unit time 233
9.5 Conclusions 237
Chapter 10 Crashes, panics, and chaos 242
10.1 Crashes and panics 242
Crashes 242
Panics and collapses 243
Business cycle aspects 246
Crash strength indicator 248
An empirical application 250
Liquidity effects 253
10.2 Thresholds and velocities 256
10.3 Chaos concepts applied 257
Overview 257
Lyapunov exponents 258
10.4 Conclusions 259
Chapter 11 Financial asset bubble theory 269
11.1 Research results 272
11.2 Predictability and forecasting 275
Predictability 275
In reality 275
Forecasting 275
11.3 Knowns, unknowns, and conjectures 276
Facts 277
Unknowns 277
Conjectures 277
11.4 Further research directions 278
Contents xi
APPENDICES 283
A. Methodological details for finding bubbles 285
B. Observation lookup table 287
C. Damodaran annual statistics 291
Glossary 293
References 301
Index 339
Prologue
Bubbles are wonders to behold. They take your breath away and make your
pulse race. They make fortunes and – just as fast or faster, in the inevitable
stomach-churning crash aftermath – destroy them too. But more broadly,
bubbles create important distortions in the wealth (e.g., pensions), psychol-
ogy, aspirations, policies, and strategies of society as a whole. Bubbles, in
other words, have significant social effects and aftereffects.
One would think, given the importance of the subject, that economists
would by now have already developed a solid grip on how bubbles form
and how to measure and compare them. No way! Despite the thousands of
articles in the professional literature and the millions of times that the word
“bubble” has been used in the business press, there still does not appear to
be a cohesive theory or persuasive empirical approach with which to study
bubble and crash conditions.
This book, adapted from my recent Ph.D. dissertation at the University
of London, presents what is meant to be a plausible and accessible descrip-
tive theory and empirical approach to the analysis of such financial market
conditions. It surely will not be the last word on the subject of bubble
xiii
xiv Prologue
characteristics and theory, but it is offered as an early step forward in a new
direction.
Development in this new direction, however, requires an approach that
appreciates the thinking behind the standard efficient market, random walk,
and Capital Asset Pricing Models, but that also recognizes the total useless-
ness of these concepts when describing the extreme behavior seen in the
events that are loosely referred to as bubbles or crashes. The body of work
that is known as behavioral finance, it seems, ends up being much closer
to what is needed. And along these lines, the notion of a behavioral risk
premium is introduced.
Yet none of this gets to the heart of the matter: When it comes to asset price
bubbles and crashes, the most visibly striking and mathematically important
feature is their exponentiality – a term that describes the idea that growth
accelerates over time.
However, although exponentiality is the essence of any and all bubbles,
it is merely a manifestation of short-rationed quantities. In plain English,
this means that people make trading decisions based mainly on the amount
that, for whatever reasons – fundamental, psychological, or emotional – they
need to buy or sell now. Considerations of current prices thus begin to take
a backseat to considerations of quantities: In bubbles you can never own
enough of the relevant asset classes, and in crashes you cannot own too little
of them.
The problem is, though, that all this flies in the face of the neoclassical
economist’s empirically unproven approach in which the market participant
is always a “rational,” calculating automaton tuned into a world with perfect,
symmetrically available, instantly digested, and analyzable information that
causes the market to quickly arrive at neoclassical Walrasian “equilibrium.”
As will, it is hoped, be convincingly shown, the market is never at, nor will
ever reach, this stage, because if it did, it would cease to exist; it would
disappear, as there would be no further need for it.
In extreme market events, as ever more investors stop denying and fighting
the tide and join the herd, the rising urgency to adjust quantities is reflected by
visible acceleration of trading volume and price changes noticeably biased to
one side or the other. And this is where the magical constant e, which equals
2.718, enters as a way to describe the exponential price change trajectory
that distinguishes bubbles (and crashes).
What a number this e is. It suggests steady growth upon growth, which
leads to acceleration. Keep the pedal to the metal in your car or rocket ship
and you go faster and faster with each additional moment of elapsed time.
It is the mechanism of compound interest. In the calculus, it is its own
derivative – no other function has this characteristic. And, best of all, even a
nonmathematician such as I can figure it out using only basic arithmetic.
A brief example suffices to demonstrate the power of compounding (i.e.,
geometric progression). I sometimes ask MBA students in finance, whom
I occasionally have the privilege of addressing, “Quick, if I give you one
Prologue xv
penny today and double the resulting amount every day for the next 30
days after, what will the total then be? Remember, we’re talking here about
only one single penny, one measly little hundredth of a dollar, and only a
months’ time. Most guesses of even these bright students, helpless without
their pocket calculators and laptop computers, are, as most of ours would
be, far off the mark. The correct answer is $10,737,417. That’s – starting
from a penny – nearly $11 million in a short month! And that’s the ultimate
bubble.
This work should first of all be of interest to financial economists of all
stripes. Yet the potential audience ought to extend also to MBA- and Ph.D
level students; central, commercial, and investment bank researchers; and
investors and speculators. In this pursuit I have aimed for comprehensibility
and comprehensiveness to appeal to as many types of readers as possible.
Although not structured as a breezy popular book, with all academic and
technical references tucked neatly out of the way in footnotes, this work for
the most part requires for assimilation only a background that might include
college-level finance and economics courses. A brief glossary of terms has
also been appended to ease the journey for general readers.
Some of the material, specifically on bubble histories and on the random
walk and related theories, has been around for a long time and has appeared
in much greater detail in many other books and articles. Fast-trackers might
thus prefer to skim over those sections and to scan the extensive literature
review in Chapter 4, the details of which are apt to be of greatest importance
only to serious researchers in this area. Also, readers initially unfamiliar with
technical aspects of the subject should not be turned off by the somewhat
challenging start of the Preface. Stick with it, as the ride should become
increasingly comfortable as you proceed through the text. Indeed, I anticipate
that at a minimum most people will greatly enjoy the opening chapters.
This project could never have been completed without the many great
works that came before and the many kind people who provided encourage-
ment, help, and good cheer during its production. The following works stand
out for particular relevancy, clarity of exposition, and stimulative effects:
Asset Pricing, rev. ed., by John H. Cochran; Quantitative Financial Eco-
nomics, 2nd ed., by Keith Cuthbertson and Dirk Nitzsche; Applied Econo-
metric Time Series, 2nd ed., by Walter Enders; Options, Futures, and Other
Derivatives, 5th ed., by John C. Hull; Behavioural Finance: Insights into
Irrational Minds and Markets, by James Montier; An Introduction to the
Mathematics of Financial Derivatives, 2nd ed., by Salih Neftci; and Chaos
Theory Tamed, by Garnett Williams.
I am fortunate to have met at Birkbeck, University of London, Profes-
sor Zacharias Psaradakis, who encouraged my enrollment; Professor John
Driffill, who supervised my academic endeavor there; Mr. Nigel Foster, who
provided timely clues in programming; and Mr. Stephen Wright, who helped
to focus my thinking. I’m also grateful to Professor Jerry Coakley of the Uni-
versity of Essex, who provided valuable advice in review of an early draft.
xvi Prologue
Many thanks too to Professor Richard A. Werner of Southampton Univer-
sity and Dr. Luca Deidda, Associate Professor in Economics at Universit
`
a
di Sassari and also with SOAS, University of London, who interrupted their
busy schedules to serve as examiners.
I wish to thank Scott Parris, editor at Cambridge University Press, who
has been greatly supportive through the processing of several editions of
my earlier works and who offered early confidence for this one. And much
appreciation is also owed the anonymous readers who vetted the text and
provided numerous suggestions that have made it far better than it would
have otherwise been. For any errors and deficiencies that may inadvertently
remain, the responsibility is, of course, mine alone.
Bubbles and crashes have long been of immense interest not only to
trained economists but also to the investing public at large. Great stories
of massive wins and losses pertaining to bubbles and crashes have been
published over many years, and these tales still fascinate us. It is my hope
and expectation that by the end of this book readers not only will have a
deeper understanding of such dramatic events, but will see them also from
an entirely new perspective.
Harold L. Vogel New York City
October 2009
Preface
Jonathan Swift, the Irish-born English author of Gulliver’s Travels,wrotea
poem in December 1720 that probably made the first reference to a “bub-
ble” as being a stock price that far exceeded its economic value.
1
Since
then asset price bubbles have been extensively reported and studied, with
many detailed accounts already extant on the presumed causes, settings, and
general characteristics of bubbles.
2
A review of the literature nevertheless indicates that, although economists
constantly talk about bubbles and have conducted numerous studies of them,
there has thus far been little progress toward a commonly accepted (or stan-
dardized) mathematical and statistical definition or method of categorization
and measurement that comes close to describing how investors actually
behave in the midst of such extreme episodes.
In fact, most studies outside of the behavioral finance literature take ratio-
nality as a starting point and a given, even though this axiomatic assump-
tion – itself an outgrowth of neoclassical economics – remains unproven and
debatable.
3
It is the intent of this study to conduct an exploration and analy-
sis that might eventually lead to a robust, unified general theory applicable
to all types and sizes of financial-market, and, more broadly, asset-price
xvii
xviii Preface
bubbles (and also crashes). At a minimum, a comprehensive theory of asset-
price bubbles would appear to require that the descriptive elements be con-
sistent with the ways in which people actually behave.
4
An understanding of bubbles is also enhanced through introduction of
fractal and exponential features. Many natural phenomena, such as galactic
spirals of stars and even snowflake patterns, are fractal (i.e., self-similar
across different time or distance scales). And these patterns are all intrinsi-
cally governed by power law (i.e., exponential) distributions that also appear
in the markets for securities.
5
These features were introduced into the stock market literature by Man-
delbrot (1964) and are discussed in greater detail in Chapter 4.
6
Mandelbrot
showed that stochastic processes describing financial time-series are much
better modeled by stable Paretian (also called L-stable, L
´
evy, or L
´
evy–
Mandelbrot) distributions than by the normal (i.e., bell-shaped or Gaussian)
distributions that had been used previously to describe asset price return prob-
abilities. Paretian distributions are of a discontinuous nature, contain a large
number of abrupt changes, and suggest, in the words of Fama (1965, p. 94),
“that such a market is inherently more risky than a Gaussian market and
the probability of large losses is greater.”
Aside from their discontinuous nature, however, the most striking feature
of all stable distributions is infinite variance, which contrasts with the finite
variance of the Gaussian. The infinite-variance aspect of stable distributions
is the one that best captures what happens to returns in the extreme events
that are informally known as bubbles and crashes. These are the events
that generate the fat-tailed (leptokurtic) distribution characteristics seen in
empirical data for most if not all financial markets. But stability – meaning
form-invariance under addition – is also important because it makes the
distribution self-similar (i.e., fractal).
7
This empirically well-established background then leads readily to the
idea that the theories of nonlinear dynamics (chaos) might also be applicable
to the study of bubbles and crashes. In nonlinear dynamics, a variable appears
to be attracted to a time path or trajectory that may often look like random
behavior but that is described by a deterministic equation. These types of
equations show how complex, chaotic behavior can arise from the simplest
of models, and also that there can be order behind disorder.
From visual inspection alone it would appear that all bubbles (and crashes)
are attracted to an exponential-like price-change trajectory.
8
If such an attrac-
tor is indeed describable by a power law distribution, then the need to look
to chaos-theoretical approaches in analyzing bubbles is inescapable, even
though it has not been established as yet that chaos theory has contributed
much to understanding of how markets work.
9
Chaos theory is also important for another reason: The basic marker
of nonlinear dynamic systems is what is known as sensitive dependence
on initial conditions (SDIC). The implication of SDIC is that it becomes
impossible to make long-range predictions. This notion, however, conflicts
Preface xix
with the extensive work that followed the Poterba and Summers (1988)
article suggesting that markets have a tendency to revert to the mean, that is,
markets are somewhat predictable over the long run.
10
These concepts will be tied together by the idea that in bubbles and crashes
the elasticity of stock price–change variance with respect to an equity risk
premium (ERP) measure tends to become infinite (as in a stable Paretian
distribution). The empirical objective will then be to develop a method that
finds instances in which this occurs. It is thus the elasticity – not the price-
change (or returns) sequence itself – that is statistically fit to an exponential
expression. Measurement of this elasticity of price variance with respect to
ERP, ε
vt
, has a conventional definition that allows the variance when the
ERP is 6% to be evaluated in the same way as when, say, the ERP is 2%.
Although the elasticity of variance (EOV) concept is the main innovation
and focus, it is supplemented (in Chapter 5) by the different perspective
offered t hrough analysis of runs – sequences of up and down price changes.
For instance, in extreme market events, it is proposed that high autoregres-
siveness (i.e., gains begetting more gains) causes the number of runs in a
sample period (positive price-change sequences in bubbles and negative in
crashes) to tend toward one and the variance of the length of a run to tend
toward zero. But although such runs analysis has the potential to provide a
new way to define bubbles and to understand their characteristics, it is ulti-
mately highly arbitrary and dependent on Gaussian distribution assumptions,
providing merely an interesting extension of the conventional approaches.
The factors that motivate investors and speculators to behave in the ways
that they do are also explored with reference to theories of behavioral finance
and of money and credit. Behavioral finance was developed early on by
Kahneman and Tversky (1979, 2000) and then extended in works such as
those by Camerer (1989), De Bondt (2003), and Thaler (1992, 2005). Based
on these, a new concept of a “behavioral risk premium” is introduced.
Changes in credit availability and interest rates might be expected, a priori,
to play a role in the development of bubbles and crashes. And this project
provides some evidence that this might be so. The theory posited here is
that extension of credit facilities beyond what can be absorbed readily by
the real economy tends to spill over into asset price speculations that, if
not early contained, restricted, or withdrawn, will inevitably evolve or meta-
stasize into full-blown “bubbles.”
11
Yet the whole subject is fraught with dif-
ficulties, beginning with frequent imprecision in usage of the term money –
an accepted medium of exchange (based on faith) and unit of account – and
the term credit, which is a transferable right to access money.
12
Stiglitz and Greenwald (2003, pp. 26–7) say, for example, that “[C]redit
can be created with almost no input of conventional factors, and can just as
easily be destroyed. There is no easy way to represent the supply function
for credit The reason for this is simple: credit is based on information.”
And because information is asymmetrically derived, imperfect, and costly
to gather, “[I]nterest rates are not like conventional prices and the capital
xx Preface
market is not like an auction market.” Hence, transactions-demand monetary
theory (p. 12) is “badly flawed.”
13
All of this suggests that creation or destruction of credit m ay be the
central component in the formation of bubble and crash processes and events
respectively and, moreover, that markets exist only because the prevalent
real-world state is one of asymmetric and imperfect information in which
arbitrage is often difficult and costly to implement. This theoretical line,
relating first to the works by Malinvaud (1985) and B
´
enassy (1986), in effect
proposes that considerations of current prices might often take a backseat
to those of desired quantities – an aspect of trading that appears to be
particularly and acutely evident in bubbles and crashes.
Although the present project contains both deductive and inductive ele-
ments, wherever possible, the inductive approach is given preference and
emphasis. This contrasts with the primarily deductivist neoclassical meth-
ods.
14
Indeed, the previously cited works by Mandelbrot, Fama, and many
others on the stable Paretian (and fractal) nature of the fat-tailed returns dis-
tributions of stocks – and thus of the direct mathematical ties to power laws
and exponentiality – provide not only the inspiration but also the inductive,
empirically determined starting point for the current project.
15
In financial economics, however, it is notable that the widely accepted
random walk, efficient market hypothesis (EMH), and capital asset pricing
models (CAPM) all follow only from the presumption (or axiom) that people
behave rationally when it comes to money and investments, and that their
utility functions are independent of each other. In the wake of an important
early Blanchard and Watson (1982) article, the resulting standard approach
has been to model bubbles as though they all intrinsically contained at
their core a rational valuation component, above which all else is bubble
froth.
The trouble is, though, that with asymmetric, imperfect information being
an essential operating feature of all market exchanges, it is difficult to know
even what such a rational valuation component is worth at any given point
in time. Notable too is that with EMH/CAPM models, markets are assumed
to be nearly always at or close to “equilibrium” and, therefore, bubbles and
crashes are not possible.
This project will instead attempt to show that such extreme events are
real manifestations of collective behaviors that do not at all conform to the
neoclassical Walrasian models of equilibrium – that is, models that start by
assuming a complete market system and no uncertainty, and are “concerned
with analyzing a dream world.”
16
Especially during extreme events, there is
no subtle matching of supply and demand of shares through a considered
Walrasian process of t
ˆ
attonnement.
17
That is because, in approaching the
extremes, price changes are often brutally discontinuous and liquidity –
which refers to a condition wherein assets are easily convertible into other
assets or consumption without loss of value – is at a premium as there is, in
such stages, so relatively little of it.
18
Preface xxi
0 10 20 30 40
% gains over 6 months
Variance based on LTM (%)
.0
.1
.2
.3
.4
.5
.6
.7
.8
.0
.1
.2
.3
.4
.5
.6
.7
.8
-35 -30 -25 -20 -15 -10 -5 0
% losses over 6 months
Variance based on LTM (%)
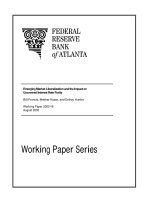
Figure P.1. Variance versus price change percentages: an example. Gains (left) and losses
in percent, S&P 500 Index, 1960:01–2005:12, monthly rolling index percentage change
measured over closing prices six months prior, with estimated variance in percent based on
rolling last twelve months data.
In thus recognizing that the key assumptions – independence of each indi-
vidual’s utility function, availability of perfect (symmetrical) and instantly
assimilated information, rationality at all times, and the presence of immedi-
ate arbitrage possibilities – are not realistic, the work ahead provides a clear
break with previous methods and models.
19
The theory presented here therefore does not at all depend on any such
assumptions. It is, instead, inductively derived through the simple and empiri-
cally demonstrable observation (Figure P.1) that the variance of price changes
will tend to rise along with the size of percentage changes in prices them-
selves. This is a pure function of the rules of arithmetic and of the statistical
definition of variance and has nothing to do with the rationality of human
behavior, the existence of equilibrium, or any other such idealized notions
and constructs.
Indeed, in the theory that evolves from this relational aspect of variance
and returns, it will later be seen that bubbles and crashes are formed by a
process in which time becomes of the essence, urgency becomes the driver,
and quantity held (instead of price paid or received) becomes the primary
concern.
20
The goals are thus to establish a viable definition of a financial asset
“bubble,” to devise a method that allows consistent and convenient com-
parisons of bubbles in the same or different asset classes (including foreign
exchange), to understand why bubbles begin to inflate (and then often later
collapse into crashes), and to present and test a theoretical approach that is in
harmony with the behavior of investors and with the basic time discounting
and risk-adjustment principles of financial economics.
In pursuit of these objectives, the four most important new theoretical
notions to be introduced here for the first time are an elasticity-of-variance
definition of bubbles, a concept of fractal microbubbles, derivation of behav-
ioral risk premiums from transactions volume data, and development of
xxii Preface
bubble and crash strength indicators. Characteristics of price-change runs
sequences in extreme market events are also explored. And the underlying
theoretical basis for why bubbles emerge (credit creation is in excess of what
is needed to finance non-GDP transactions) and why crashes occur (available
cash is insufficient to service debt obligations) is explained.
All of this is developed from a viewpoint that is consonant with the notions
of behavioral finance and nonlinearity and non-normal return distributions,
and with the idea that bubbles and crashes are likely to be generated through
changes in money and credit conditions. Although the role of money and
credit in the fostering and support of bubbles is certainly not a new idea, it
is one that is here extended and explored in a nontraditional way.
But, in addition, the basis for this whole approach is that – especially while
they are caught up in extreme market events such as bubbles and crashes –
behavior by both individuals and institutions is often not rational in the usual
sense of the word; emotions and mass psychology (i.e., zeitgeist) instead
become important concomitant factors.
21
We humans, it seems from recent research in the emerging field of neuro-
finance, are apparently not wired to do otherwise, that is, to be rational at all
times. For one, we tend to have a powerful and difficult-to-overcome urge
to join crowds and emulate whatever the crowd is doing. As famed investor
Warren Buffett has recently said, “the markets have not gotten more rational
over the years when people panic, when fear takes over, or when greed
takes over, people react just as irrationally as they have in the past.”
22
Related to this, also, is the basic flaw in the underlying and almost univer-
sally accepted assumption that supply and demand in the financial markets
can be modeled in the same way as in the markets for goods and services.
If, for example, the price of beef or steel or gasoline or haircuts rises, we
consumers tend to seek substitutes and demand fewer units of the affected
products or services.
But if stocks or commodities or real estate prices rise, just the opposite
usually seems to occur, as we are drawn to invest in such financial asset
vehicles and tend to demand more rather than less of them. For whatever
deep-seated reasons, we respond differently to price changes in financial
markets than to price changes in goods and services markets. If so, and as a
result, the traditional financial economics approaches to modeling bubbles
and crashes are inevitably destined to fail.
The relevance of this research extends far beyond the usual intramural
debates of academia or the direct interests of speculators and investors who
would gain advantage if they were able to identify bubbles in their earliest
stages – that is, the points at which the risk of missing the impending upswing
or of experiencing a crash are the least.
23
Keynes (1936, [1964], Ch. 12, VI), for example, has written that
“[S]peculators may do no harm as bubbles on a steady stream of enterprise. But the position
is serious when enterprise becomes the bubble on a whirlpool of speculation. When the
Preface xxiii
capital development of a country becomes a by-product of the activities of a casino, the job
is likely to be ill-done.”
24
And Shiller (2000 [2005]) says,
“If we exaggerate the present and future value of the stock market, then as a society we
may invest too much in business startups and expansions, and too little in infrastructure,
education, and other forms of human capital. If we think the market is worth more than
it really is, we may become complacent in funding our pension plans, in maintaining our
savings rate and in providing other forms of social insurance” (p. xii)
“The valuation of the stock market is an important national – indeed international – issue.
All of our plans for the future, as individuals and as a society, hinge on our perceived
wealth The tendency for speculative bubbles to grow and then contract can make for
very uneven distribution of wealth.” (p. 204)
Still, notwithstanding such views, while they are inflating, bubbles are often
seen by investors – both individual and institutional – as relatively benign
and favorable events. What’s not to like? Shares rise easily and participants
do not have to be especially skilled and selective when the tide tends to lift
almost all boats, often even those of the lowest quality and with the flimsiest
of finances.
Both Wall Street (bankers, lawyers, accountants, analysts, corporate man-
agements, etc.) and Main Street (car dealers, travel agents, brokers, jour-
nalists, broadcast and cable networks, airlines, hotels, caterers, restaurants,
retailers, limo drivers, dry cleaners, barbers, etc.) are beneficiaries. And
sometimes, as perhaps in the 1990s (but not as for housing in the early
2000s), the bubble makes it much cheaper and easier for new companies
developing and promoting important productivity-enhancing technologies
to grow and prosper. For the numerous constituencies served well by a bub-
ble’s inflation – for instance, investment bankers and tech entrepreneurs in
the 1990s and homebuilders, construction workers, mortgage servicers and
packagers, and owners in the early 2000s – the attitude will always be (and
has always been) dance while the music plays.
25
“Laissez les bon temps
rouler!” (Let the good times roll!)
26
Moreover, how can anyone in the government agencies and branches
strenuously object? Unless the bubble is immediately accompanied by high
inflation on goods and services, which normally happens only in the later
stages, central banks do not have to focus too much on uncomfortable issues
such as unemployment, falling exchange rates, capital account deficits, and
market freeze-ups and bailouts of failing firms. Treasury coffers are filled
from higher capital gains tax realizations and employee payroll tax col-
lections, whereas budget deficits, including those of states and municipali-
ties, shrink. And politicians everywhere will always welcome having more
income to spend and having a richer platform on which to run for reelection.
It is therefore likely that, at least in the beginning and into the middle
phases, there is usually a broad coalition in the body politic that has nothing