THE ROLE OF PYRUVATE DEHYDROGENASE KINASE IN GLUCOSE AND KETONE BODY METABOLISM
Bạn đang xem bản rút gọn của tài liệu. Xem và tải ngay bản đầy đủ của tài liệu tại đây (1.05 MB, 124 trang )
THE ROLE OF PYRUVATE DEHYDROGENASE KINASE IN
GLUCOSE AND KETONE BODY METABOLISM
Yasmeen Rahimi
Submitted to the faculty of the University Graduate School
in partial fulfillment of the requirements
for the degree
Doctor of Philosophy
in the Department of Biochemistry and Molecular Biology
Indiana University
July 2012
ii
Accepted by the Faculty of Indiana University, in partial
fulfillment of the requirements for the degree of Doctor of Philosophy.
_____________________________________
Robert A. Harris, Ph.D., Chair
_____________________________________
Robert V. Considine, Ph.D.
Doctoral Committee
_____________________________________
Peter J. Roach, Ph.D.
May 17, 2012
_____________________________________
Ronald C. Wek, Ph.D.
iii
DEDICATION
I dedicate my thesis to my inspirational mother, Mariam Rahimi, and loving
brother, Haroon Rahimi. The support and love of my family has provided me with the
drive to become a scientist.
iv
ACKNOWLEDGEMENTS
I am extremely grateful for the guidance and support of many people. I will
forever be thankful for all of them. Specially, my amazing mentor, Dr. Robert A. Harris
who has supported me, given me complete freedom to pursue my project in any direction,
and taught me that dedication, creativity, and hard work in science are the primary
sources of success. Additionally, I am grateful for my committee members, Dr. Robert
V. Considine, Dr. Peter J. Roach, and Dr. Ronald C. Wek. Dr. Considine’s expertise in
adipogenesis greatly contributed to exploring pathways to acquire a deeper understanding
of the physiology of my project. Dr. Roach’s insight on glucose and glycogen
metabolism and Dr. Wek’s knowledge in protein metabolism provided great insight to
my project. Furthermore, without the NIH T32 Award provided by Dr. Roach and
without Dr. Wek’s advise of maintaining focus, I would not been able to successfully
complete my work. Also, I like to thank my wonderful current and past lab members,
especially Dr. Nam Jeoung for generating the knockout mice, Dr. Pengfei Wu, Dr.
Byounghoon Hwang, Dr. Martha Kuntz, Will Davis, and Oun Kheav.
v
ABSTRACT
Yasmeen Rahimi
THE ROLE OF PYRUVATE DEHYDROGENASE KINASE IN GLUCOSE AND
KETONE BODY METABOLISM
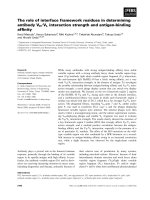
The expression of pyruvate dehydrogenase kinase (PDK) 2 and 4 are increased in
the fasted state to inactivate the pyruvate dehydrogenase complex (PDC) by
phosphorylation to conserve substrates for glucose production. To assess the importance
of PDK2 and PDK4 in regulation of the PDC to maintain glucose homeostasis, PDK2
knockout (KO), PDK4 KO, and PDK2/PDK4 double knockout (DKO) mice were
generated. PDK2 deficiency caused higher PDC activity and lower blood glucose levels
in the fed state while PDK4 deficiency caused similar effects in the fasting state. DKO
intensified these effects in both states. PDK2 deficiency had no effect on glucose
tolerance, PDK4 deficiency produced a modest effect, but DKO caused a marked
improvement, lowered insulin levels, and increased insulin sensitivity. However, the
DKO mice were more sensitive than wild-type mice to long term fasting, succumbing to
hypoglycemia, ketoacidosis, and hypothermia. Stable isotope flux analysis indicated that
hypoglycemia was due to a reduced rate of gluconeogenesis. We hypothesized that
hyperglycemia would be prevented in DKO mice fed a high saturated fat diet for 30
weeks. As expected, DKO mice fed a high fat diet had improved glucose tolerance,
decreased adiposity, and were euglycemic due to reduction in the rate of
gluconeogenesis. Like chow fed DKO mice, high fat fed DKO mice were unusually
sensitive to fasting because of ketoacidosis and hypothermia. PDK deficiency resulted in
vi
greater PDC activity which limited the availability of pyruvate for oxaloacetate synthesis.
Low oxaloacetate resulted in overproduction of ketone bodies by the liver and inhibition
of ketone body and fatty acid oxidation by peripheral tissues, culminating in ketoacidosis
and hypothermia. Furthermore, when fed a ketogenic diet consisting of low carbohydrate
and high fat, DKO mice also exhibited hypothermia, ketoacidosis, and hypoglycemia.
The findings establish that PDK2 is more important in the fed state, PDK4 is more
important in the fasted state, survival during long term fasting depends upon regulation of
the PDC by both PDK2 and PDK4, and that the PDKs are important for the regulation of
glucose and ketone body metabolism.
Robert A. Harris, Ph.D., Chair
vii
TABLE OF CONTENTS
LIST OF TABLES xii
LIST OF FIGURES xiii
INTRODUCTION 1
1. Mechanism for regulation of blood glucose levels 1
1.1. Regulation of blood glucose levels in the fed state 2
1.2. Regulation of blood glucose levels in the fasted state 2
1.3. Regulation of blood glucose by counter-regulatory hormones 5
1.4. Importance of anaplerosis and cataplerosis in regulation of blood glucose levels 6
1.5. Role of the PDC in maintaining blood glucose levels 6
2. Mechanism responsible for regulation of pyruvate dehydrogenase complex 8
2.1. Regulation of pyruvate dehydrogenase complex 8
2.2. Regulation of pyruvate dehydrogenase kinase expression and activity 10
2.3. Metabolic effect of inhibiting PDKs by dichloroacetate 11
2.4. Metabolic effect of knocking out PDK4 12
3. Mechanisms responsible for regulation of ketone body levels 13
3.1. Regulation of ketone body production 13
3.2. Regulation of ketone body utilization 16
3.3. Metabolic acidosis due to increased ketone bodies 17
3.4. Conditions leading to increased ketoacidosis 17
4. Use of stable isotope tracers to study glucose and ketone body metabolism 18
5. Specific Aims of this study 22
viii
CHAPTER I: FASTING INDUCES KETOACIDOSIS AND HYPOTHERMIA
IN PDK2/PDK4 DOUBLE KNOCKOUT MICE 24
1. Overview 24
2. Introduction 24
3. Materials and Methods 26
3.1. Animal protocol 26
3.2. Generation of PDK2/PDK4 DKO mice 26
3.3. Glucose and insulin tolerance test 27
3.4. Measurements of metabolite concentrations in blood and liver 27
3.5. Metabolic flux analysis in the fasting condition 28
3.6. Mass isotopomer analysis using GC/MS 28
3.7. Measurement of enzyme activities 30
3.8. Western blot analysis 31
3.9. Statistical analysis 32
4. Results 32
4.1. Fed and fasting blood glucose levels in PDK2, PDK4, and DKO mice 32
4.2. Effect of knocking out PDK2 and PDK4 on PDC activity 36
4.3. Blood concentrations of gluconeogenic precursors and ketone bodies are
greatly altered in DKO mice 40
4.4. Fed and fasting liver glycogen levels in PDK2, PDK4, DKO mice, and
wild-type mice 41
4.5. Pyruvate tolerance and clearance are enhanced in DKO mice 42
4.6. Activity of key gluconeogenic enzymes are not altered in the liver of
ix
DKO mice 44
4.7. Rate of glucose production is decreased in DKO mice 45
4.8. Contributions of acetyl-CoA produced by PDH complex to ketone body
production in DKO mice 45
4.9. Fasting induces ketoacidosis and hypothermia in the DKO mice 47
4.10. Expression of PDK4 does not compensate for lack of PDK2 in PDK2 KO
mice and vice versa 51
4.11. Expression of PDK1 and PDK3 does not compensate for the lack of
PDK2 and PDK4 in DKO mice 52
5. Discussion 52
CHAPTER II: PDK2/PDK4 DOUBLE KNOCKOUT MICE FED A HIGH FAT
DIET REMAIN EUGLYCEMIC BUT ARE PRONE TO KETOACIDOSIS 58
1. Overview 58
2. Introduction 59
3. Materials and Methods 60
3.1. Animals 60
3.2. Exercise Protocol 61
3.3. Measurement of body fat 61
3.4. Glucose and insulin tolerance test 62
3.5. Measurements of metabolite concentrations in blood, skeletal muscle,
and liver 62
3.6. Glucose and ketone body utilization by isolated diaphragms 63
3.7. Metabolic flux analysis in the fasting conditions 64
x
3.8. Oxygen consumption, energy expenditure, and fatty acid oxidation 64
3.9. Determination of nucleotides in the liver and skeletal muscle 65
3.10. Histochemistry of the livers 66
3.11. Statistical analysis 66
4. Results 67
4.1. Body weight gain, body fat and liver fat accumulation are attenuated in
DKO mice fed a HSF diet 67
4.2. Hyperglycemia is attenuated in DKO mice fed the HSD 70
4.3. DKO mice have improved glucose tolerance 70
4.4. DKO mice have lower blood concentrations of gluconeogenic substrates
and higher levels of ketone bodies 72
4.5. DKO mice suffer from fasting induced hypothermia 73
4.6. Plasma essential amino acids and key gluconeogenic amino acids are
reduced while citrulline is elevated in DKO mice 73
4.7. DKO mice exhibit reduced capacity to sustain exercise under fasting
conditions 75
4.8. DKO mice exhibit hypothermia and ketoacidosis when fed a
ketogenic diet 77
4.9. Rate of glucose production is reduced in DKO mice 79
4.10. DKO mice synthesize more but oxidize less ketone bodies 80
4.11. DKO mice oxidize less fatty acids 84
4.12. Citric acid cycle intermediates are suppressed in the liver of DKO mice 87
4.13. OAA levels are reduced in the skeletal muscle of DKO mice 89
xi
4.14. OAA levels are reduced in the liver of DKO mice fed the ketogenic diet 90
5. Discussion 91
GLOBAL DISCUSSION 96
REFERENCES 98
CURRICULUM VITAE
xii
LIST OF TABLES
1. Blood glucose levels in WT, PDK2 KO, PDK4 KO, and DKO mice in the fed
and fasted states 33
2. PDC activity in tissues of WT, PDK2 KO, PDK4 KO, and DKO mice in the
fed state 37
3. PDC activity in tissues of WT, PDK2 KO, PDK4 KO, and DKO mice in the
fasted state 38
4. Blood metabolic parameters of wild-type (WT) and DKO mice 40
5. Blood metabolic parameters of wild-type (WT) and DKO mice fed a HSF diet
for 30 weeks 72
6. Plasma amino acid levels in wild-type (WT) and DKO mice fed a HSF diet
for 30 weeks 74
7. Liver metabolic parameters of wild-type (WT) and DKO mice 88
8. Muscle metabolic parameters of wild-type (WT) and DKO mice 89
9. Liver metabolites of wild-type (WT) and DKO mice fed a high saturated fat diet
(HFD) and a ketogenic diet (KGD) 90
xiii
LIST OF FIGURES
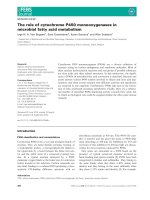
1. Insulin-stimulated signaling pathways leads to GLUT4 translocation 1
2. Regulation of pyruvate dehydrogenase complex by phosphorylation and
allosteric effectors 9
3. Key enzymes and reactions in ketogenesis 15
4. Utilization of [U-
13
C
6
] glucose to determine the rate of glucose production 19
5. Improved glucose tolerance and increased insulin sensitivity in DKO mice
but not PDK2 KO mice 37
6. Decreased phosphorylation of the PDC E1α subunit in the skeletal muscle
of PDK KO mice 39
7. Glycogen levels are reduced in the liver of DKO mice 42
8. Pyruvate clearance is increased in DKO mice 43
9. Rate of glucose production is reduced in DKO mice 45
10. The conversion of glucose into ketone bodies is increased in DKO mice 46
11. Blood ketone bodies are increased in DKO mice 48
12. Fasting induces acidosis in DKO mice 49
13. Deficiency of PDK2, PDK4, and both PDK2 and PDK4 does not increase
expression of the other PDK isoforms in the heart, liver, and skeletal muscle 51
14. Body weight gain is attenuated in DKO mice fed a HSF diet 67
15. Fasting induced hepatic steatosis is reduced in DKO mice fed a HSF diet 68
16. Improved glucose tolerance without improved insulin tolerance in DKO mice
fed a HSF diet 71
17. Effect of exercise on wild-type and DKO mice fed a HSF diet 75
xiv
18. Ketogenic diet induces hypoglycemia, hypothermia, and ketoacidosis
in DKO mice 77
19. Rate of glucose production is reduced and rate of β-hydroxybutyrate is
increased in DKO mice fed a HSF diet 79
20. Expression of key gluconeogenic enzyme is not altered in the liver of
DKO mice 80
21. Rate of β-hydroxybutyrate production is increased in DKO mice fed a HSF
diet 81
22. Ketone body oxidation is reduced in the diaphragm obtained from DKO mice 82
23. Glucose oxidation is not altered in the diaphragm obtained from DKO mice 83
24. Rate of oxygen consumption, carbon dioxide production, energy expenditure,
and fatty acid oxidation are reduced in HSF diet fed DKO mice in the fasted state 85
25. Expression of uncoupling (UCP1) and morphology of brown adipose
tissue (BAT) are unchanged in DKO mice 86
1
INTRODUCTION
1. Mechanisms for regulation of blood glucose levels
1.1. Regulation of blood glucose levels in the fed state
Glucose is an important nutrient for the body by serving as a major energy source
for many cells. Maintaining blood glucose levels are crucial for different
nutritional states. During the well fed state, blood glucose levels rise when a meal is
digested and the glucose is absorbed. To reduce blood glucose levels back to normal, the
beta cells of the pancreas secrete insulin. Insulin increases blood flow in the skeletal and
cardiac muscle by activating nitric oxide generation which dilates blood vessels [1-3].
Increased blood flow enhances glucose delivery in the muscle. The abundance of glucose
is removed from the circulation by the high affinity glucose transporter, GLUT4, which is
highly expressed in muscle and fat cells [4]. Insulin stimulates glucose transport by
GLUT4 across the cell membranes through a facilitative diffusion mechanism [5].
Insulin binds to the insulin receptor (IR) tyrosine kinase on the surface of muscle and
adipose cells (Figure1).
Plasma Membrane
IR
Insulin
P
IRS
P
PI3K
4,5P
2
3,4,5P
3
PDK1
AKT
AS160
P
GTP-
Rab
GLUT4
GLUT4
Figure 1. Insulin-stimulated signaling pathway leads to GLUT4 translocation.
2
This binding induces a conformational change in the receptor leading to tyrosine
phosphorylation of insulin receptor substrate proteins (IRS) which in turn recruit an
effector molecule, PI 3-kinase (PI3K) (Figure 1). PI3K converts phosphatidylinositol
(4,5) P
2
to phosphatidylinositol (3,4,5) P
3
known as PIP
3
which stimulates the kinase
activity of Akt through the interaction of phosphatidylinositol-dependent kinase-1
(PDK1) [6]. The active Akt phosphorylates the Akt 160 kDa substrate (AS160), which
inhibits the GTPase-activating domain associated with AS160 and promotes Rab proteins
to exchange from its GDP to GTP bound state. Increasing the active GTP bound state
stimulates the recruitment of intracellular GLUT4 storage vesicle to the plasma
membrane [4]. At the cell surface, GLUT4 facilitates the diffusion of glucose down its
concentration gradient within the muscle and fat cells.
Insulin also promotes the storage of glucose as glycogen in liver and muscle cells
[7]. Insulin activates glycogen synthase (GS), the enzyme that converts glucose to
glycogen, by inhibiting glycogen synthase kinase 3 (GSK3) [8, 9] and stimulating protein
phosphatase 1 (PPA1) [10, 11]. Dephosphorylated GS is active and catalyzes the
formation of glycogen from glucose. Insulin stimulated glycogen synthesis and glucose
uptake by GLUT4 removes glucose from the circulation and reduces blood glucose
levels to normal.
1.2. Regulation of blood glucose levels in the fasted state
When blood glucose levels fall below normal, insulin secretion by beta cells of
the pancreas is reduced while glucagon secretion is increased by alpha cells of the
pancreas. Glucagon, a counter regulatory hormone to insulin, accelerates glycogenolysis,
3
the process by which liver glycogen is broken down into glucose [11, 12]. Glucagon
binds to the glucagon receptor on liver cells and induces a conformational change which
leads to the activation of G coupled proteins [13]. These G coupled proteins stimulate
adenylate cyclase which in turn increases the level of cAMP. This second messenger
activates protein kinase A (PKA). Subsequently, PKA phosphorylates and activates
glycogen phosphorylase kinase which in turn phosphorylates glycogen phosphorylase,
leading to its activation. Glycogen phosphorylase is the key regulatory enzyme in
glycogen degradation. When glycogen is broken down, glucose is made available for
cells to maintain blood glucose levels from falling lower. The second mechanism by
which blood glucose levels are replenished in the fasted state is gluconeogenesis, the
process by which cells synthesize glucose from metabolic precursors [14].
Gluconeogenesis occurs primarily in the liver and to a lesser extent in the kidney during
periods of fasting and starvation. Since the brain and red blood cells are dependent on
glucose, it is essential to synthesize glucose from precursors such as lactate, alanine,
pyruvate, and glycerol. Although gluconeogenensis consists of eleven enzyme-catalyzed
reactions, phosphoenolpyruvate carboxylase (PEPCK) has long been considered the most
important regulatory enzyme [15]. Glucagon regulates the transcription of PEPCK by
increasing cAMP which activates protein kinase A (PKA) that phosphorylates CREB
[16]. Phospho-CREB binds to cAMP response element (CRE) and recruits the
coactivators CBP and p300 which attract additional coactivators to initiate PEPCK gene
transcription [17].
Another key enzyme in gluconeogenesis is the mitochondrial enzyme, pyruvate
carboxylase (PC). This enzyme is highly expressed in liver and kidney but it is also
4
present in adipose tissue, pancreas and brain, showing that PC is involved in other
metabolic pathways [18]. In the liver and kidney, PC synthesizes oxaloacetate from
pyruvate for gluconeogenesis. In adipose tissue, PC provides oxaloacetate for
condensation with acetyl-CoA for formation of citrate for de novo fatty acid synthesis
[19]. In the pancreas, PC enhances glucose-stimulated insulin release [20, 21]. In brain,
PC is responsible for producing oxaloacetate to replenish α-ketoglutarate for the synthesis
of glutamate, the precursor for γ-aminobutyric acid (GABA) [22, 23]. The highest
activity of PC is found in the fasted state primarily in gluconeogenic tissues, indicating
that pyruvate carboxylase is essential for supplying oxaloacetate for PEPCK for the
production of glucose. Similar to PEPCK, transcription of PC is increased by glucagon.
Dissimilar to PEPCK, PC is subject to allosteric regulation [24]. It has been shown that
PC is positively regulated by acetyl-CoA, enhancing the production of oxaloacetate.
Regulating expression of PC and PEPCK is an essential mechanism for controlling
gluconeogenesis in the fasted state to prevent blood glucose levels from falling to low
levels.
It has also been shown that glucose production in the liver is controlled by
substrate supply of gluconeogenic precursors (also denoted as 3 carbon compounds),
lactate, pyruvate, and alanine. Metabolic flux studies in isolated hepatocytes [25] and in
dogs [26] have shown that limiting the supply of 3 carbon compounds reduces the rate of
gluconeogenesis. In summary, regulation of gluconeogenesis as well as glycogenolysis
by various mechanisms is essential in the fasted state to maintain glucose homeostasis.
5
1.3. Regulation of blood glucose levels by counter-regulatory hormones
When glucose levels fall during fasting, blood levels of counter-regulatory
hormones, glucagon, epinephrine, growth hormone, and cortisol, increase. Epinephrine
binds to β-adrenergic receptors and causes a conformational change, leading to activation
of adenylate cyclase which activates cAMP. Similar to glucagon, epinephrine stimulates
glycogen breakdown. Furthermore, activated PKA phosphorylates the bifunctional
enzyme 6-phosphofructo-2-kinase/fructose-2,6-biaphosphatase (PFK-2/FBPase),
subsequently the kinase is inactivated and the biphosphatase is activated [27, 28]. Active
FBPase catalyzes the dephosphorylation of fructose-2,6-biaphosphate to fructose-6-
phosphate, resulting in lower concentrations of fructose-2,6-biaphosphatase, the positive
allosteric regulator of phosphofructokinase and negative allosteric regulator of fructose-
1,6-biaphosphatase. Reduction in fructose-2,6-biaphosphate stimulates fructose-1,6-
biaphosphatase activity and thus, promotes glucose production by the liver. The
induction of glycogenolysis and gluconeogenesis by epinephrine helps to restore blood
glucose levels to normal.
Growth hormone, another counter-regulatory hormone, decreases glucose
oxidation and muscle glucose uptake, although the mechanism by which growth hormone
mediates these effects remain unknown [29]. Nevertheless, increased secretion of growth
hormone is needed for sustaining glucose homeostasis in the fasted state. Glucocorticoid
is an additional counter-regulatory hormone. It restores blood glucose levels by
promoting glucose production through transcriptional activation of key gluconeogenic
enzymes, PEPCK and PC [15, 30]. Glucocorticoids bind to a glucocorticoid receptor
(GR) which dimerizes to form a homodimer. The GR complex enters the nucleus and
6
binds to the glucocorticoid response element (GRE) of the PEPCK and PC gene and
induces PEPCK and PC transcription to promote glucose production [30].
1.4. Importance of anaplerosis and cataplerosis in regulation of blood glucose levels
Glucose production is mediated by key gluconeogenic enzymes, PEPCK and PC,
which in turn catalyze cataplerotic and anaplerotic reactions. Anaplerosis is the process
by which metabolic intermediates of the TCA cycle are replenished [31, 32]. Normally,
the pool of TCA cycle intermediates is sufficient to sustain the carbon flux over a wide
range, so that concentrations of TCA cycle intermediates remain constant. However,
many biosynthetic pathways utilize the TCA cycle intermediates as substrates. One of
these pathways is gluconeogenesis which uses oxaloacetate, the recycling TCA cycle
intermediate, to produce glucose. The process by which TCA cycle intermediates are
disposed is termed cataplerosis. While the major anaplerotic enzyme, pyruvate
carboxylase, sustains the pool of oxaloacetate for the TCA cycle, the cataplerotic
enzyme, PEPCK, utilizes oxaloacetate as substrate in gluconeogenesis [31]. Therefore,
anaplerosis is coupled with cataplerosis to sustain the supply of oxaloacetate for glucose
production in the liver.
1.5. Role of PDC in maintaining blood glucose levels
The mechanisms regulating hepatic glucose production are not solely ascribed to
changes in key gluconeogenic enzymes but also by the availability of substrates that can
be converted to glucose. Regulation of substrate availability is determined by many
factors including the pyruvate dehydrogenase complex (PDC). PDC is a mitochondrial
7
enzyme that catalyzes the irreversible oxidative decarboxylation of pyruvate to form
acetyl-CoA, CO
2
, and NADH. In the well fed state, PDC is active and promotes glucose
oxidation and the disposal of three carbon compounds (lactate, pyruvate, and alanine). In
contrast to fed conditions, PDC is turned off in the fasted state. As a result of an
inactivated PDC, pyruvate oxidation is inhibited and three carbon compounds are
conserved. Preserving these compounds is indispensable for sustaining gluconeogenesis.
If the complex remains totally active in the starved state, pyruvate oxidation would
deplete the three carbon compounds needed for gluconeogenesis.
Switching between an active and inactive PDC is not only important in glucose
production but also in transition of glucose oxidation to fatty acid oxidation as proposed
by the Randle cycle [33]. A series of experiments in cardiac and skeletal muscle
conducted by Randle and colleagues showed that increased fatty acid oxidation increases
the ratio of [acetylCoA]/[CoA] and [NADH]/[NAD
+
], both of which inhibit PDC
activity. Accumulation of acetyl-CoA in the mitochondria results in increased citrate
formation which in turn inhibits 6 phosphofructo-1-kinase (PFK-1), leading to increased
levels of glucose-6-phosphate [34]. Glucose-6-phosphate inhibits hexokinase, leading to
reduced glucose oxidation. This mechanism by which fatty acid oxidation inhibits
glucose oxidation through PDC inactivation is known as the Randle cycle. Earlier the
Randle cycle was proposed as a mechanism to explain insulin resistance in type 2
diabetes since the hallmark of this disease is increased fatty acid oxidation and reduced
glucose oxidation [33]. However, human and rodent studies of type 2 diabetes suggest
high concentrations of fatty acids cause insulin resistance by decreasing glucose uptake
rather than reducing glucose oxidation [35, 36]. Increased levels of fatty acids promote
8
the synthesis of diacylglycerol (DAG) and ceramide. DAG activates protein kinase C
(PKC) which phosphorylates and inhibits tyrosine kinase activation of the insulin
receptor and tyrosine phosphorylation of insulin receptor substrate (IRS-1) [37-40].
Ceramide, a sphingolipid derivative of palmitate, on the other hand, inhibits Akt/protein
kinase B [41]. Both of these lipid derivatives turn off the insulin signaling cascade and
prevent insulin stimulated glucose uptake, resulting in less glucose disposal and greater
insulin resistance. Although the current knowledge of insulin signaling producing insulin
resistance interferences with the Randle’s cycle as possible explanation, this cycle is
needed to explain the transition of glucose oxidation to fatty acid oxidation which is
highly dependent on the activity of PDC.
2. Mechanisms responsible for regulation of pyruvate dehydrogenase complex
2.1. Regulation of pyruvate dehydrogenase complex
The PDC is inactivated by phosphorylation by pyruvate dehyrogenase kinases
(PDKs) and activated by deposphorylation by pruvate dehyrogenase phosphatases (PDPs)
[42, 43]. There are four isoforms of the PDKs and two isoforms of PDPs. The multiple
isoforms of the PDKs and the PDPs are distinguished by differences in tissue distribution,
specific activities toward the phosphorylation sites, kinetic properties, and sensitivity to
regulatory molecules [44, 45]. Phosphorylation of serine residues of the E1α subunit by
the PDKs inactivates the PDC. Activation of the complex, on the other hand, is
associated with a dephosphorylated state. Beyond these regulations, the PDC activity is
sensitive to allosteric regulations (Figure 2).
9
OH
CO
2
Acetyl-CoA
NADH
CoASH
Pyruvate
NAD
+
(-)
(-)
(-)
(-)
(-)
(-)
(-)
(-)
PDC
ADP
ATP
OP
PDC
(+)(+)
Pi
H
2
O
Pi
H
2
O
Inactivate
Active
PDH
Kinases
1,2,3,4
PDH
P’ase 1
PDH
P’ase 2
Figure 2. Regulation of pyruvate dehydrogenase complex by phosphorylation and
allosteric effectors [46].
The products of the PDC reaction, acetyl-CoA and NADH, indirectly inhibit the
activity of the complex by activating the PDKs. A high NADH to NAD
+
ratio reduces
the lipoyl moieties of E2 while a high acetyl-CoA to CoA ratio favors the acetylations of
the reduced lipoyl moieties of E2. The reduced and acetylated lipoyl moieties of E2
subunit attract the binding of the PDKs and ensure maximum kinase activity, resulting in
a greater phosphorylation state and less PDC activity [47, 48]. The sensitivity to
allosteric regulation by acetyl-CoA and NADH has the order of
PDK2>PDK1>PDK4>PDK3 [44]. Meanwhile, pyruvate inhibits PDK activity by
binding to PDK [47]. In addition, an activated state of PDC is induced by the substrates
(pyruvate, NAD
+
, and CoA) of the reaction [48]. These positive allosteric molecules
inhibit the PDKs, resulting in activation of PDC by the PDPs.
10
2.2. Regulation of pyruvate dehydrogenase kinases expression and activity
Allosteric mechanisms account for short term regulation of the PDKs, while long
term regulation is achieved by altered expression of the levels of PDKs, which occurs in a
tissue specific manner in starvation, diabetes, and cancer. Starvation and diabetes induce
the expression of PDK2 in liver and kidney [49] and the expression of PDK4 in heart [49-
51], skeletal muscle [52, 53], kidney [49], and liver [44, 49, 53]. Starvation and diabetes
are marked by high levels of glucocorticoids and free fatty acids and low levels of
insulin. Glucocorticoids activate the glucocorticoid receptor (GR), which cooperates
with the transcriptional factors Fork head members of the O class (FOXO) to recruit the
co-activators p300/CBP that catalyze histone acetylation to induce PDK4 gene expression
[54]. Free fatty acids stimulate peroxisome proliferator-activated receptor α (PPARα)
which in turn activates PDK4 expression [55, 56]. While fasting conditions induce the
expression of PDK2 and PDK4 in various of tissues, the fed state suppresses this
induction. Insulin inhibits PDK4 transcription by activating the protein kinase B which
phosphorylates FOXO [46, 54, 55, 57]. Phospho-FOXO leaves the nucleus and can no
longer bind to p300/CBP which in turn can not foster acetylation of histones, resulting in
suppression of PDK4 transcription [58]. Insulin has also been shown to repress the
induction of PDK2 in hepatoma cells [55].
PDK1 expression is induced in some tumors [59, 60]. Cancer cells rely on
aerobic glycolysis to generate energy, known as the Warburg effect [61]. Survival of
tumor cells in a low oxygen environment requires hypoxic-induced factor (HIF) signaling
[62]. HIF induces the transcription of PDK1 in tumor cells to decrease flux through the
PDC and promote conversion of pyruvate to lactate. Among the four pyruvate
11
dehydrogenase kinases, PDK3 has a limited tissue distribution. PDK3 is expressed in
testes, kidney, and brain [44] and is not subject to long term regulation in starvation and
diabetes. HIF-1 induces the expression of PDK3 in some solid tumors [63].
2.3. Metabolic effect of inhibiting PDKs by dichloroacetate
The expression of PDK2 and PDK4 are induced in diabetes while PDK1 and
PDK3 are induced in cancer. Since the PDKs are important in prevalent diseases, it is
reasonable to target PDK inhibition as a therapeutic target for diabetes and cancer. A
well-studied PDK inhibitor is dichloroactate (DCA) which was initially proposed as a
treatment for lactic acidosis [64, 65]. It was anticipated that DCA lowers lactic
production by increasing PDC activity through PDK inhibition to divert pyruvate into the
TCA cycle instead of the synthesis of lactate. A controlled clinical trial of DCA showed
a marginal reduction in blood lactate levels without diminishing acidosis [66].
Nevertheless, DCA treatment lowers the blood levels of lactate, pyruvate, and alanine in
rats [67]. The reduction of these gluconeogenic precursors limits the rate of glucose
production in the liver, resulting in lower blood glucose levels [64, 68]. Even though
DCA has glucose lowering effects, DCA has been excluded for treatment of type 2
diabetes due to conversion of DCA to toxic metabolites, glyoxylate and oxalate [69] and
causing peripheral neuropathy [64]. Additional PDK inhibitors, 3-chloroproprionate [70]
and AZD7545 [71-73], lowered blood glucose levels but are not being pursued clinically.