Báo cáo y học: "ArrayPlex: distributed, interactive and programmatic access to genome sequence, annotation, ontology, and analytical toolsets" docx
Bạn đang xem bản rút gọn của tài liệu. Xem và tải ngay bản đầy đủ của tài liệu tại đây (4.82 MB, 17 trang )
Genome Biology 2008, 9:R159
Open Access
2008Killion and IyerVolume 9, Issue 11, Article R159
Software
ArrayPlex: distributed, interactive and programmatic access to
genome sequence, annotation, ontology, and analytical toolsets
Patrick J Killion and Vishwanath R Iyer
Address: Center for Systems and Synthetic Biology, Institute for Cellular and Molecular Biology, Section of Molecular Genetics and
Microbiology, University of Texas at Austin, 1 University Station A4800, Austin, Texas 78712, USA.
Correspondence: Vishwanath R Iyer. Email:
© 2008 Killion and Iyer; licensee BioMed Central Ltd.
This is an open access article distributed under the terms of the Creative Commons Attribution License ( which
permits unrestricted use, distribution, and reproduction in any medium, provided the original work is properly cited.
ArrayPlex<p>ArrayPlex is a software package that centrally provides a large number of flexible toolsets useful for functional genomics.</p>
Abstract
ArrayPlex is a software package that centrally provides a large number of flexible toolsets useful
for functional genomics, including microarray data storage, quality assessments, data visualization,
gene annotation retrieval, statistical tests, genomic sequence retrieval and motif analysis. It uses a
client-server architecture based on open source components, provides graphical, command-line,
and programmatic access to all needed resources, and is extensible by virtue of a documented
application programming interface. ArrayPlex is available at />arrayplex/.
Rationale
Although centralized storage of microarray data is provided
by a number of databases, such as ArrayExpress, Gene
Expression Omnibus, Stanford Microarray Database/Long-
horn Array Database, Bioarray Software Environment, and
TM4 [1-6], many common downstream analysis procedures
remain challenging, especially when reference to large-scale
data in external databases is required. Data analysis typically
involves association of gene names with systematic and cus-
tom annotations, gene ontology information, and genomic
DNA sequence, followed by a battery of analyses such as
enrichment of functional annotations in gene sets, statistical
tests for significance, analysis of cis-regulatory motifs and
regulator-target relationships. Resources for these tasks are
difficult to manually assemble while ensuring they remain
error free. Amplifying the challenge is the fact that such anal-
yses are not executed just once, but usually consist of a series
of iterations with changing parameters. In order to reduce
inefficiency and minimize errors, new algorithms for newly
devised data analyses must ideally interface with pre-existing
code and algorithms that already satisfactorily address other
domains of data analysis.
In an attempt to address this pervasive set of challenges in
functional genomics analysis, we developed ArrayPlex, a net-
work-centric software environment chartered with the goal of
streamlining the acquisition and up-to-date maintenance of
these resources and the ease by which they can be associated
with primary microarray data. We illustrate the functionality
of ArrayPlex by marshalling systematic annotations and com-
plete genomic sequence information for three organisms:
Homo sapiens, Mus musculus, and Saccharomyces cerevi-
siae. In addition, we have assembled access to a suite of com-
monly utilized DNA sequence analysis toolsets. ArrayPlex
interfaces with all of these bundled resources to provide
microarray quality assessments, data visualization, gene
annotation retrieval, statistical tests, genomic sequence
retrieval and motif analysis. Complete lists of managed
resources and toolsets are provided in Tables 1 and 2, respec-
tively.
Published: 12 November 2008
Genome Biology 2008, 9:R159 (doi:10.1186/gb-2008-9-11-r159)
Received: 22 September 2008
Revised: 22 September 2008
Accepted: 12 November 2008
The electronic version of this article is the complete one and can be
found online at /> Genome Biology 2008, Volume 9, Issue 11, Article R159 Killion and Iyer R159.2
Genome Biology 2008, 9:R159
Our goal was to develop an open-source, robust, and easy to
maintain network-centric system that enables the construc-
tion of reusable pipelines of complex data analysis proce-
dures. We designed the system to communicate on three
levels of interaction: a graphical user interface for interactive
data manipulation, a set of command-line analytical modules
for script-driven analysis, and a documented Java-based pro-
grammatic application programming interface (API). Below
we describe the systematic architecture of the ArrayPlex envi-
ronment and the genomic resources included within it. Addi-
tionally, we demonstrate how ArrayPlex has been
indispensable in the large-scale analysis of a transcriptional
regulatory network.
System architecture
Core technology, design, network operation
ArrayPlex was implemented with exclusively open-source
technologies. Components were selected to enable creation of
an encapsulated system; virtually all of the open source dis-
tributable software components required for function are
bundled within the installation package.
The ArrayPlex server is designed to operate on either the
Linux operating system or Mac OS X (Figure 1) [7]. ArrayPlex
includes Apache Tomcat [8] as the embedded application
server, which awaits connections and responds to client data
requests. The ArrayPlex server stores the majority of its man-
aged data in the PostgreSQL relational database system [9].
The ArrayPlex client is a graphical user interface that contains
dozens of data management, analysis, and visualization fea-
tures. It is compatible with Mac OS X, Windows XP, Windows
Vista and most distributions of Linux operating systems. It
communicates by standard network protocols with the Array-
Plex server and, thus, can operate on any computer with net-
work connectivity to the ArrayPlex server. Because it
communicates with the ArrayPlex server using the same pro-
tocol a web browser utilizes, the ArrayPlex client requires no
special changes to client firewall configurations or network
settings for operation. The ArrayPlex client requires no local
installation. The application resides on the ArrayPlex server
and is remotely retrieved and launched through use of Java
Web Start [10]. This ensures that with each execution the
end-user is using the latest version of the ArrayPlex client.
This design and implementation allows a large user group to
share a customizable and expanding graphical user interface
without the constant need for distributed upgrades or rein-
stallations with each cycle of improvement. In addition to the
graphical user interface, ArrayPlex has a set of command-line
executed client-side modules packaged in the form of stand-
ard Java Archive format (JAR) files [11]. These modules con-
tain documented analytical routines that communicate with
the ArrayPlex server exactly like the ArrayPlex client. This
feature allows the distributed network design of ArrayPlex to
Table 1
Managed resources
Resource name Source Related organism
Gene Ontology Descriptors GO Consortium Hs, Mm, Sc
Genome sequence UCSC Hs, Mm
Hs Gene Ontology assignments EBI Hs
Mm Gene Ontology assignments EBI Mm
Sc annotations SGD Sc
Sc genome sequence SGD Sc
Sc Gene Ontology assignments SGD Sc
Genomic resources downloaded by the ArrayPlex installation program. Each of these resources is kept up-to-date and is accessible by the ArrayPlex
client, command-line modules, and programmatic API. EBI, European Bioinformatics Institute; SGD, Stanford Genome Database; UCSC, University of
California, Santa Cruz. Hs, Homo sapiens; Mm, Mus musculus; Sc, Saccharomyces cerevisiae.
Table 2
Integrated toolsets
Tool name Purpose Download Reference
AlignAce Sequence discovery Acquire [15]
Avid Sequence alignment Acquire [13]
BLAST Genomic sequence matching Bundle [17]
ClustalW Sequence alignment Bundle [16]
cluster Hierarchical clustering Acquire [18]
MDSCAN Sequence discovery Bundle [20]
MEME Sequence discovery Bundle [19]
fastacmd Sequence retrieval Bundle [17]
rVista Sequence alignment Acquire [14]
The toolsets integrated into the ArrayPlex server environment. The
download code of 'Bundle' indicates that the ArrayPlex installation
program is capable of downloading the source-code and building the
tool during the installation process with no further interaction needed.
Alternatively, a code of 'Acquire' indicates that a license agreement is
required for download and, thus, the installer of the ArrayPlex server
must manually download a file and place it in the proper place on the
ArrayPlex server. Documentation is provided for how to acquire and
install all toolsets with this requirement.
Genome Biology 2008, Volume 9, Issue 11, Article R159 Killion and Iyer R159.3
Genome Biology 2008, 9:R159
be used by command-line application and script-driven anal-
ysis just as easily as the graphical interface.
Bundled genomic resources
The complete ArrayPlex server meta-environment is com-
posed of the ArrayPlex application server and many bundled
genomic resources and analytical toolsets (Figure 2, Tables 1
and 2). The process of ArrayPlex server installation acquires
each of the genomic resources (Table 1) from its officially
hosted location. This includes generic Gene Ontology (GO)
descriptors, organism-specific GO assignments, and organ-
ism-specific gene annotations.
All resources are processed from their heterogeneous down-
loaded forms to a structured query language (SQL) format
that is loaded into the ArrayPlex relational database schema.
The transformation removes all of the organism-specific
nature of the data and allows the ArrayPlex programmatic
API to be designed such that reusable code modules can be
implemented independent of the original source of the anno-
tations. A functional example of this would be GO assign-
ments. This information is species-specific and details the
mapping of universal GO terms to specific genes in a given
organism. The downloaded forms of these assignments for
human and mouse differ from yeast in format and content,
because these assignments are curated and managed by inde-
pendent research institutions: European Bioinformatics
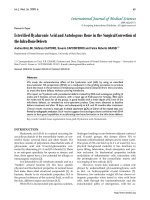
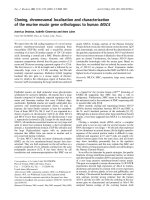
Core technology, high-level overviewFigure 1
Core technology, high-level overview. The ArrayPlex server is a nearly encapsulated system composed of an embedded Java Runtime Environment and
Apache Tomcat application server. The ArrayPlex server requires one external resource, a PostgreSQL relational database server. The ArrayPlex server
and PostgreSQL database need not operate on the same computer. The ArrayPlex server operates within the Linux operating system and communicates
with the PostgreSQL server by the standard JDBC protocol. The ArrayPlex client can be operated on any Mac OS X, Windows, or Linux computer. The
ArrayPlex client is not installed but rather launched through use of Java Web Start, ensuring that the client is always up-to-date when used on any
computer. The ArrayPlex client communicates with the ArrayPlex server by HTTP.
ArrayPlex Server
ArrayPlex Client
network
JDBC
Linux Server
Apache Tomcat
Application Server
PostgreSQL
Database
Java Web Start
Genome Biology 2008, Volume 9, Issue 11, Article R159 Killion and Iyer R159.4
Genome Biology 2008, 9:R159
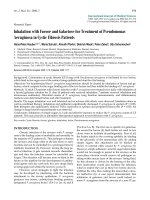
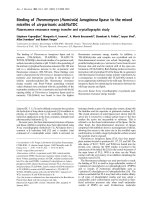
Architecture, resources, network-centric communicationFigure 2
Architecture, resources, network-centric communication. The complete ArrayPlex environment is composed of the combination of the ArrayPlex
application server and the many genomic resources and analytical toolsets that it installs, manages, and provides. The ArrayPlex server installs genomic
annotations, ontological assignments, and genome sequence for supported organisms. Additionally, toolsets providing genomic sequence extraction,
BLAST, sequence search, sequence discovery, and multi-sequence alignment are provided. Both the ArrayPlex client and command-line modules network-
access these genome resources and analytical toolsets through the documented ArrayPlex API.
raw data, expression, DNA binding, sequence, quality analysis
data import, export,
transformation
genomic
annotation,
ontology, and
sequence
ArrayPlex Client
primary
microarray
data
command-line
batch analysis
integrated
analytical toolsets
network
PostgreSQL
Database
ArrayPlex Client
ArrayPlex cAPI
ArrayPlex Server
ArrayPlex sAPI
user datasets
primary data
annotations
sequence
toolsets
Genome Biology 2008, Volume 9, Issue 11, Article R159 Killion and Iyer R159.5
Genome Biology 2008, 9:R159
Institute for human and mouse, Stanford Genome Database
for yeast. The transformation of this information to a single
format and storage in a relational schema enabled a single set
of ArrayPlex database source-code to be written to retrieve
and use this information. This allows programmers using the
ArrayPlex programmatic API to write data retrieval and anal-
ysis routines that are independent of the organism-specific
caveats and institution-specific file formats. File format
changes will be handled through alteration of the ArrayPlex
parsing routines and released upgrades. These internal adap-
tations will be transparent to programmers using the API,
thus shielding them from future file format evolution.
In addition to GO and gene annotations, complete genome
sequence is downloaded for each of the supported model
organisms. This genome sequence is in FASTA format but is
converted to National Center for Biotechnology Information
(NCBI) BLAST-database format by the ArrayPlex installation
program using NCBI-provided utilities [12]. This transforma-
tion provides two advantages. First, it allows the ArrayPlex
programmatic API to include complete BLAST functionality
as a part of its catalogue of analytical operations. Second, and
more importantly, it allows the ArrayPlex environment to
take advantage of all the pre-existing NCBI-bundled toolsets
for genome sequence retrieval.
Genome resources are most valuable when synchronized with
the most recent versions available. Frequent modifications
and additions occur to GO and other gene annotation assign-
ments as they are continually curated and updated. In order
to keep analysis routines and the resulting biological inter-
pretations up to date, ArrayPlex is designed to not only down-
load and store annotations upon system installation, but also
to check for updated information, retrieve it, and update the
resources managed within the relational schema. This func-
tionality is provided and documented in the format of a
standard system scheduler that is a part of the server operat-
ing system.
Integrated open-source sequence analysis toolsets
In addition to the many genome resources hosted on the
ArrayPlex server, a large number of open-source analytical
toolsets are integrated into the environment (Table 2). This
set of tools includes NCBI BLAST, cluster, CLUSTALW,
AVID/rVista, and several sequence motif discovery applica-
tions: AlignAce, MDSCAN, and MEME [13-20]. As detailed in
Table 2, the majority of these applications are downloaded,
compiled from source-code, and installed by the ArrayPlex
installation program. Licensing restrictions prevented this
for a few of the integrated toolsets. Complete documentation
is included with the ArrayPlex installation on how to retrieve
and install these additional utilities. The inclusion of these
toolsets transformed ArrayPlex from solely an information
warehouse to a server capable of extended analytical capacity.
All of these analytical features are accessible by way of the
graphical ArrayPlex client application, the command-line
modules, and the programmatic API. Such access facilitates
centralized and coordinated high-throughput data and
sequence operations such as sequence retrieval, data manip-
ulation and transformation, multi-genome BLAST, sequence
motif search and discovery, hierarchical clustering, and
sequence alignment. For example, it is possible to retrieve
genomic sequence upstream of a set of genes of interest and
carry out sequence motif discovery, all based on a few user-
defined parameters. All of these utilities are executed on the
ArrayPlex server, with only the results being transmitted
immediately to the client computer. Thus, client computers
that might not be able to compile or run these large-scale
functional analysis programs can still access all their power in
real time, and programmatically if so desired.
Analytical accessibility and customization
In addition to the many genome resources and toolsets
hosted by the ArrayPlex environment, Figure 2 depicts the
overall interactivity and relationship of the subcomponent
elements. Both the ArrayPlex client and the command-line
modules communicate over a network connection with the
ArrayPlex server using the hypertext transfer protocol
(HTTP). Many individual clients and/or command-line mod-
ules can simultaneously interact with a single server. On sev-
eral occasions we have executed more than a dozen
command-line modules simultaneously interacting with a
single ArrayPlex server for annotation, ontology, and genome
sequence, as well as analytical toolset executions. The Array-
Plex server was easily able to manage these parallel requests,
some of which took days to weeks to complete.
Some client-side utilities such as sequence motif analysis are
replicated between the graphical ArrayPlex client program
and the command line modules. The former is useful for
interactive and visual analysis while the latter facilitates flex-
ible, programmatic execution. The ArrayPlex programmatic
API mediates communication between both the client and the
command-line module with the server (Figure 3). Each of
these components interacts with the API by way of the
[net.sourceforge.arrayplex.client] package of
routines. These client routines are designed to marshal the
input parameters, data, and named operations being sent to
them in such a way that the ArrayPlex server can decode this
information and respond. The objects exchanged between the
client and server are an extensive and specialized set that is
part of the [net.sourceforge.arrayplex.serial]
package of resources. The [net.sourceforge.array
plex.servlet] package receives requests and decodes both
what part of the client API made the request and what specific
information is being sent to facilitate its execution. The serv-
let API then calls a mirror server API, packaged as
[net.sourceforge.arrayplex.server], where actual
functional operations occur. This package contains dozens of
classes that interact with the ArrayPlex server operating sys-
tem to execute analytical tasks or with the ArrayPlex rela-
tional database API [net.sourceforge.arrayplex.db]
Genome Biology 2008, Volume 9, Issue 11, Article R159 Killion and Iyer R159.6
Genome Biology 2008, 9:R159
to retrieve either user datasets or genomic annotations. When
an analytical process completes or when information is
retrieved, the process begins to fold back upon itself. Infor-
mation is again loaded into API-based objects that are
returned across the network to the original client operation.
This design and capacity is notable in two ways. First, the user
invoking the client API routines needs no actual knowledge
that the programmatic request will be fulfilled over a network
on a remote server. The API is designed such that the compli-
cation of network implementation is hidden from the user.
For example, the operation executeBlastAll (organism,
evalue, sequence), which is part of the SequenceResources
client API, does not reveal to the programmatic user that,
during its execution, the parameters organism, evalue, and
sequence are encoded into an object and sent across the net-
work to the ArrayPlex server where the NCBI-BLAST utility
blastall is actually executed. The result of that blastall execu-
tion is then formatted into a programmatic object on the
server, and returned across the network to the client compu-
ter. To the programmatic user of the client API no network
operation is evident; the BlastResult object is the result of the
operation and their programmatic routines move to the next
step just as if everything executed and completed on their
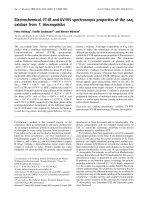
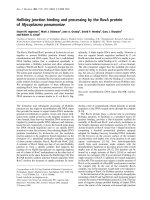
Matching graphical client and command-line utilities use the same API for communication with the serverFigure 3
Matching graphical client and command-line utilities use the same API for communication with the server. The ArrayPlex client and command-line modules
use the network capabilities of the ArrayPlex API to send requests and retrieve results.
net.sourceforge.arrayplex.db
net.sourceforge.arrayplex.client
net.sourceforge.arrayplex.servlet
net.sourceforge.arrayplex.server
transparent network
communication
[ n.s.a.serial ]
ArrayPlex Client
ArrayPlex cAPI
ArrayPlex Server
ArrayPlex sAPI
user datasets
primary data
annotations
sequence
toolsets
Genome Biology 2008, Volume 9, Issue 11, Article R159 Killion and Iyer R159.7
Genome Biology 2008, 9:R159
local computer. Second, the information that is exchanged
with the ArrayPlex server is in the form of documented API
objects. This increases the efficiency by which a program-
matic user can utilize the ArrayPlex API compared to other
methods that launch processes remotely and retrieve results
locally. Most methods of remote task invocation require the
user to parse a stream of resulting information that is
returned from the server. The task of parsing this information
and determining actual results is error-prone. The ArrayPlex
APIs are designed to communicate in terms of API docu-
mented objects. In the example above, the BlastResult object
that is returned from the ArrayPlex server is a programmatic
object just like any other in the application environment.
Referring to the provided documentation the programmatic
user can find out that the BlastResult object is composed of a
set of BlastHit objects, each of which has parameters describ-
ing the genomic loci where BLAST found matching
sequences.
The entire ArrayPlex environment is designed to allow cus-
tomization. The ArrayPlex client can incorporate internation-
alization and localization of language elements through
modification of a single resource bundle containing nearly all
labels that appear throughout its interactive graphical inter-
face. Sections of the ArrayPlex client can be removed; newly
designed sections can be accommodated.
Documentation and guidance
The analytical routines available in both the graphical client
and command-line modules are documented. Execution of
any of the command-line modules without arguments dis-
plays usage documentation. Similarly, the ArrayPlex client
has hypertext-formatted help content for each of the interac-
tive sections of the application. This content describes the
analytical effect of chosen options and the meaning of results
that are displayed (Figure 4). The programmatic API is simi-
larly documented, detailing the parameters required by each
API and the format and meaning of returned objects.
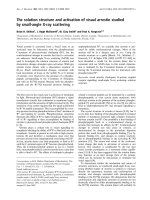
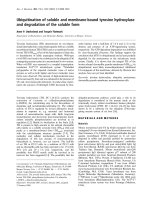
Multi-source documentationFigure 4
Multi-source documentation. All execution contexts within the ArrayPlex environment are documented. In this example, Go Ontology Analysis is
documented from within the context of the ArrayPlex client (top). The bottom panel shows JavaDoc documentation of the API.
Genome Biology 2008, Volume 9, Issue 11, Article R159 Killion and Iyer R159.8
Genome Biology 2008, 9:R159
Results and discussion
Analytical proving ground
We have tested the entire ArrayPlex system - server
resources, client, and all command-line modules - over the
course of more than a year in a real-world research context.
We recently described the reconstruction of a genome-wide
transcriptional regulatory network based on integrating data
from more than 600 individual microarray experiments cov-
ering more than 260 transcription factors [21]. ArrayPlex was
the central hub of all computational activities for this project
throughout each phase of data transformation and analysis.
We systematically screened hundreds of independent micro-
array experiments for channel-specific signal bias. We used a
sophisticated error model implementation to identify statisti-
cally significant target genes based on replicate microarray
data. With target genes identified for each of the 260 tran-
scription factors profiled, we carried out regulatory epistasis
analysis, expansive GO enrichment analysis, characterized
sequence motif search, and novel sequence motif discovery.
Additionally, ArrayPlex format-conversion capabilities were
used to elucidate significant novel transcription factor-to-fac-
tor regulatory insights.
The ArrayPlex command-line modules ErrorModel.jar,
InteractionGraph.jar, and TargetAnalysis.jar (Table 3) were
developed concomitant to ArrayPlex and were employed for
all the operations that led to the resulting biological conclu-
sions. These modules are included as part of the ArrayPlex set
of command-line functions as their capacity is useful for most
gene expression analysis. Additionally, the command-line
modules AnnotationResources.jar, DatasetOperations.jar,
and SequenceAnalysis.jar provide application-neutral imple-
mentation methods to expose the genomic resources and
open-source toolsets hosted by the ArrayPlex server to the
command-line module user.
High-throughput microarray data quality analysis
One important step in most DNA microarray analysis is that
of data quality evaluation. For example, it is important to
check for any signal intensity bias and understand the effect
of data normalization on individual and entire batches of
microarray experiments. Secondarily, the selection of signifi-
cant microarray values for an individual or set of experiments
involves the filtering of candidate spots based on a variety of
spot metrics. Measurements such as signal to noise ratios,
spot consistency regression correlations, and background
subtracted single-channel intensity values are typical metrics
that are used to separate statistically meaningful spot values
from those of dubious quality.
To address these issues we developed an entire section of the
ArrayPlex client dedicated to processing, statistical analysis,
and visualization of large batches of input data. The GenePix
Results File Operations section of the ArrayPlex client has the
capacity to batch-process a large number of GenePix Results
(GPR) files for quality control evaluation. First, the GenePix
Results File Charting section can read sets of GPR files into a
batch queue for graphical analysis, such as generating MA
plots (spot fluorescent intensity A to log-ratio M), which can
detect a bias in the relationship of absolute signal intensity to
ratio of spots [22]. In addition to MA plots, histograms and
scatter-plots can be mass-produced for any of the dozens of
GPR spot metrics, enabling detection of biased signal-to-ratio
relationships, non-normal log-ratio distributions, and sub-
standard signal to noise distributions with the selection of
just a few parameters and the browsing of automatically
saved images.
Each of the more than 600 individual microarray experi-
ments were screened for channel-specific signal bias and a
variety of other possible data irregularities using the high-
throughput batch functions provided by the GenePix Results
File Charting section of the ArrayPlex client (Figure 5). MA
Table 3
Command-line modules
Module name Purpose Class
AnnotationResources.jar Genome annotation and ontology retrieval Generic
DatasetOperations.jar User dataset retrieval, transformation, and manipulation Generic
SequenceAnalysis.jar Genome sequence extraction, search, discovery, manipulation Generic
ErrorModel.jar Example routines in replicate combination Regulation
InteractionGraph.jar Example routines in network modelling Regulation
TargetAnalysis.jar Example routines in ontological and sequence analysis Regulation
The six command-line modules built by and provided with the ArrayPlex installation. The first three modules, classified as 'Generic', are most useful
for command-line access to any of the resources hosted on the ArrayPlex server. This includes all genome sequence, annotation, ontology, and user
dataset information. The SequenceAnalysis.jar module additionally contains all of the genome sequence operations featured in the ArrayPlex client,
including organism-specific sequence extraction, BLAST, known-motif search, de novo motif discovery, and multi-sequence alignment. The modules
classified as 'Regulation' are useful for analysis of regulator-target relationships as illustrated in our recent reconstruction of a functional
transcriptional regulatory network [21]. They provide reusable analytical operations and illustrate how the ArrayPlex programmatic API can be used
for constructing novel analysis routines.
Genome Biology 2008, Volume 9, Issue 11, Article R159 Killion and Iyer R159.9
Genome Biology 2008, 9:R159
plots were generated en masse and used to screen for inten-
sity-dependent spot-ratio biases while log-ratio histograms
provided the ability to visually detect unexpected ratio distri-
butions. Individual experiments with obvious bias were elim-
inated from the process of replicate combination and
significant target determination.
The GenePix Results File Normalization section of the Array-
Plex client has the capacity to read, normalize, and save proc-
essed results in GenePix Results File (GPR) format through
the implementation of three selectable algorithms: positive
control, negative control, and global mean distribution
adjustment. The functions of this section of the ArrayPlex cli-
ent provide a novel capacity not present in any software pack-
age or microarray database. Determination of normalization
coefficients and subsequent data adjustment is based upon
interactive and controllable selection of positive and negative
control microarray spots as well as user-selectable spot-qual-
ity metrics. A researcher is not limited to the blind dictation
of parameters by which normalization coefficients will be
imposed on primary data, but rather has the capacity to inter-
actively explore the effects of these parameters and then
decide which values are appropriate (Figure 6). Once filtering
metrics have been determined, the process of normalization
and results export remains in the native GPR format of the
original input data. The ArrayPlex client thus serves as a nor-
malization intermediary without interfering in the process of
storing final results in one of many possible microarray data-
bases that supports the GPR file-format.
Interactive exploration of filter-mediated spot-exclusion and
tabular data export across grouped primary datasets is a pow-
erful feature found in the GenePix Results File Group Analy-
sis section of the ArrayPlex client not present in open-source
or commercial software counterparts. Primary datasets in the
form of an unrestricted number of GPR files are aggregated,
named, and permanently stored in the ArrayPlex server-man-
aged relational database as a GenePix Results File Group. The
file group, once stored, is available for dynamic loading into
the ArrayPlex client at any time (Figure 7). The loading of a
file group is the first step in filtered tabular export of a chosen
GenePix spot-metric across all experiments contained within
the group. The impact of statistical filtering as it relates to
spot exclusion is interactively adjustable through a set of
user-controlled and logically configurable primary data fil-
ters. A researcher has the capacity to define and combine fil-
ters and receive immediate feedback regarding what
proportion of each dataset within the file-group the chosen
filter thresholds would exclude. Thresholds can thus be care-
fully studied and chosen in a way that provides unprece-
dented transparency to the process of primary data filtering.
After appropriate filters and thresholds have been deter-
mined and applied, the resulting data matrix is exported in a
standard tabular PCL (pre-clustering) file-format.
The feature-set provided by the GenePix Results File Group
Analysis section of the ArrayPlex client was invaluable in the
earliest stages of transcription factor knock-out primary data
aggregation and processing. Implementation of the error
model required the systematic construction of several sepa-
rate primary data matrices for the hundreds of individual
microarray experiments that were the input to this stage of
data processing. These included channel-specific foreground
intensity, background intensity, and signal-to-noise matrices
as well as spot-quality metrics such as regression correlation.
ArrayPlex allowed us to explore and aggregate hundreds of
individual microarray experiments as a single unit through
importation as a single file group. Once the file group was cre-
ated we were able to study the dataset-specific effects of vari-
ous spot-metric thresholds on matrix construction and filter-
mediated spot exclusion. These features impacted our under-
standing of both individual experiments as well as sets of
microarray hybridizations performed together as batch
groups. For each of the candidate statistical thresholds that
were under consideration, we were able to understand the
proportion of spots that would be excluded from individual
experiments as well as gain visibility as to which batch groups
were the most susceptible to filter-induced data exclusion.
Filter toggling allowed us to clearly understand which indi-
vidual filters in a logical group were having the most impact
on spot exclusion. Once we arrived at a set of thresholds we
deemed functionally appropriate, we then exported internally
consistent data-matrices for each of the spot-metrics required
by the error model. This section of the ArrayPlex client was so
effective for these operations that it replaced our microarray
database (Longhorn Array Database) for all data aggregation,
filtering, and filtered dataset extraction portions of this
research initiative.
Ontological enrichment and connectivity
A successful component of the reconstruction of the func-
tional regulatory network was the mining of GO assignments
among the target genes of a given transcription factor for sta-
tistically significant GO term enrichment [21]. This function-
ality is built into both the ArrayPlex client and the command-
line module TargetAnalysis.jar. The command-line module
AnnotationResources.jar has the supplemental capacity to
return a normalized single-format set of both ontology term
declarations and organism-specific term assignments for
each of the supported organisms.
The high-throughput capacity of the GO term enrichment
toolsets provided by the command-line module TargetAnal-
ysis.jar allowed us to calculate statistical enrichment for reg-
ulated target sets of each of the hundreds of transcription
factors characterized. The process was simplified and easily
repeatable through the module-provided ability to process
input as a single file for all transcription factor target sets.
Execution time was significantly reduced through parallel
multi-threaded processing functionality provided as a user-
selectable option. Configurable ArrayPlex server-mediated
Genome Biology 2008, Volume 9, Issue 11, Article R159 Killion and Iyer R159.10
Genome Biology 2008, 9:R159
Result file batch quality visualizationFigure 5
Result file batch quality visualization. The GenePix Results File Charting section of the ArrayPlex client contains extensive resources for the statistical and
visual processing of GenePix Results files (GPR). Batch production of quantitative visualizations such as MA plots, scatter-plots, and spot-metric histograms
are possible. All graphs can be exported as JPG-formatted images in batch mode to a given folder and browsed using the standard thumbnail capability of
the client operating system. This provides the capacity to screen for a number of data quality attributes in large sets of DNA microarray experiments.
Genome Biology 2008, Volume 9, Issue 11, Article R159 Killion and Iyer R159.11
Genome Biology 2008, 9:R159
maintenance of GO terms and assignments ensured that up-
to-date information was provided for each repetition of the
analytical workflow.
The GO term enrichment toolsets contained the novel capac-
ity to evaluate both individual (RAW) and network-aggregate
(COMPOSITE) terms for statistical enrichment. The capacity
for GO term enrichment calculations to evaluate both individ-
ual and aggregate terms ensured that ontology terms that
were proximally co-located in the GO hierarchy were mined
for statistical significance. Individual terms that might have
missed statistical thresholds for significance were evaluated
for the ability to network-aggregate up to significant higher-
order terms.
The ArrayPlex client processing the set of primary regulated
targets for the transcription factor RPN4 is depicted in Figure
8. The cumulative hypergeometric probability was used to
evaluate both individual and network-aggregate terms for
statistical enrichment. As depicted, the set of RPN4 primary
targets were significantly enriched for many terms related to
the proteasome, ubiquitination, and catabolic protein degra-
dation. This characterization of RPN4 correlated well with its
previously established biological role in proteasome biogen-
esis and protein degradation [23]. In total, 156 of the more
than 200 transcription factors profiled showed statistical
enrichment for 213 GO terms at a Bonferroni-corrected P-
value threshold of 4.0 × 10
-5
[21].
Sequence analysis - discovery and search
We used ArrayPlex exclusively in the analysis of promoter
sequences of regulated targets for each profiled transcription
factor. We wished to determine whether sets of regulated tar-
gets had novel over-represented sequence motifs in their
respective promoter regions. Similarly, we used ArrayPlex to
characterize the statistical over-representation of previously
Result file normalizationFigure 6
Result file normalization. The GenePix Results File Normalization section of the ArrayPlex client provides varied resources for the normalization of GenePix
Results files (GPR). Positive control, negative control, and global median normalization options are available. Configurable statistical filters provide the
capacity to threshold spot quality in the selection of microarray spots used to determine normalization coefficients. Export of normalized datasets is in the
same format as that of the input data (GPR). This allows ArrayPlex to be part of a flexible pipeline of data analysis and processing.
Genome Biology 2008, Volume 9, Issue 11, Article R159 Killion and Iyer R159.12
Genome Biology 2008, 9:R159
characterized motifs within these regulatory regions. The
module TargetAnalysis.jar provides the transcription factor
target-specific implementations of these methods developed
during this study while more generic implementations of
these services are available in the module SequenceAnaly-
sis.jar.
Sequence sets for each regulated target pool were extracted
using ArrayPlex genome sequence retrieval services - availa-
ble through the ArrayPlex client, command-line modules, and
programmatic API. These sequence sets were then re-submit-
ted to the ArrayPlex server for de novo analysis using APIs
that invoked the bundled toolsets AlignACE, MEME, and
MDscan. Each of these programs is a motif-discovery applica-
tion designed to use a background sequence model to find
over-represented motifs within the set of sequences provided.
The background sequence model we utilized was a nucleotide
frequency matrix computed by extraction of all S. cerevisiae
intergenic regions. Each was permuted by a set of module-
accessible parameters, including the desired motif width and
the number of expected motifs. The output from this process
was converted by ArrayPlex from the native output of each of
the motif-discovery toolsets to a single universal format,
thereby significantly simplifying downstream analysis. Ulti-
mately, 105 transcription factor target sets produced 490 sta-
tistically significant and novel sequence motifs that passed
systematic evaluation over 400,000 candidates sequences for
properties such as nucleotide complexity and motif length
[21].
A motif search process was executed for each transcription
factor target set to scan promoter regions for the existence of
previously characterized cis-regulatory sequences. A set of
consensus sequences for each of the transcription factor dele-
Result file aggregation, filtering, and data extractionFigure 7
Result file aggregation, filtering, and data extraction. The GenePix Results File Group Analysis section of the ArrayPlex client allows for the aggregation of
individual microarray datasets (GenePix Results files) into named and dynamically loadable file groups. A loaded file group can be interactively filtered
through logical combination of spot-metric filters. Filter toggling can be used to dynamically determine the relative contribution of individual filters on the
sum total of spots excluded for each microarray experiment in a file group. Once appropriate filters have been determined, datasets are matrix-exportable
for any of the dozens of GenePix Result File spot metrics.
Genome Biology 2008, Volume 9, Issue 11, Article R159 Killion and Iyer R159.13
Genome Biology 2008, 9:R159
tions was aggregated from Stanford Genome Database, The
Promoter Database of Saccharomyces cerevisiae (SCPD),
and previous research [24-27]. Each of the consensus
sequences was used by ArrayPlex to synthesize a regular
expression that was evaluated for statistical enrichment rela-
tive to the previously described background model. Of the
more than 200 profiled, 102 transcription factor target-set
promoter regions showed enrichment for previously charac-
terized sequence motifs, thereby increasing confidence in
both the biological validity of the characterized motifs and the
target pools characterized by this study [21].
Each of these sequence analysis processes was made possible
and iteratively repeatable through the on-demand and up-to-
date genome sequence resources offered by the ArrayPlex
server, the parametric options available in its command-line
modules and programmatic API, and the bundled sequence
discovery and search toolsets.
Visualization - regulator on regulator analysis
The command-line module InteractionGraph.jar has the
capacity to cross-convert between many commonly used pri-
mary data formats, such as the PCL format common to many
DNA microarray analysis applications and the graph-markup
language format (GML) common to many network-visualiza-
tion packages such as Cytoscape [28]. In order to identify sub-
network relationships where transcription factors regulate
one another, we recently filtered the large-scale transcription
factor deletion data so as to include only gene targets that
were themselves transcription factors. In this manner, the fil-
GO ontological assignment enrichment, connectivityFigure 8
GO ontological assignment enrichment, connectivity. The ArrayPlex client performing GO term enrichment for the transcription factor RPN4. Specific
individual (RAW) and network-aggregate (COMPOSITE) GO terms relating to the characterized roles in proteasome biogenesis, ubiquitination, and
catabolic protein degradation are recovered and statistically enriched as evaluated by the cumulative hypergeometric probability.
Genome Biology 2008, Volume 9, Issue 11, Article R159 Killion and Iyer R159.14
Genome Biology 2008, 9:R159
tered datasets were limited to represent the inter-regulatory
interactions of transcription factors. We were interested in
whether certain transcription factors acted as network hubs,
concentrated points of in-bound or out-bound transcriptional
activation or repression. In order to visualize the filtered net-
work relationships, we converted the raw PCL to a GML for-
mat and used Cytoscape to render the resulting network
(Figure 9).
The transcription factors PHD1, STP4, MCM1, MBF1, and
HMS2 each have either a significant count of in-bound or out-
bound regulatory connections with the other transcription
factors that were profiled [21]. Specifically, MCM1 activates a
Regulator on regulator visualizationFigure 9
Regulator on regulator visualization. The command-line module InteractionGraph.jar has the capacity to convert to visualization-ready file formats that can
be read by Cytoscape for visualization [28]. The functional transcriptional regulatory network dataset was filtered to show regulatory interactions only
among transcription factors [21]. Red connections indicate activation while green are indicative of repression. The arrowhead points from the regulator to
the target that is being regulated. Certain transcription factors are predominantly regulators of other transcription factors or regulated by other
transcription factors.
Genome Biology 2008, Volume 9, Issue 11, Article R159 Killion and Iyer R159.15
Genome Biology 2008, 9:R159
large number of transcription factors while STP4 is con-
versely activated by a large number of transcription factors. It
is not surprising that MCM1 appears to be an activation hub
for many transcription factors in the larger regulatory net-
work. MCM1 has been shown to perform an active role in cell-
cycle regulation through regulation of DNA replication initia-
tion [29]. STP4 has little official annotation. GO term enrich-
ment analysis of its affected targets indicates statistically
significant roles in nucleotidyltransferase, polyamine trans-
porter, spermine transporter, and polyamine activities. These
activities are general to the many pathways of amino acid
metabolism and it is thus not surprising that STP4 would
then be activated by a wide variety of other transcription fac-
tors. Also of interest in the regulatory network, the transcrip-
tion factors MBF1, PHD1 and HMS2 are each repressed by
many factors. Both PHD1 and HMS2 have been shown to per-
form an active role in pseudohyphal growth adaptation [30-
32]. It is reasonable to believe that their transcriptional abun-
dance would be repressed by many transcription factors in
the many conditions in which their cellular role is not
required.
It would have been difficult to detect these nuanced relation-
ships without this rendering. The capacity for ArrayPlex to
interconvert file formats from primary data formats to visual-
ization-ready formats increases the efficiency and flexibility
of data exploration and analysis.
Comparison to similar software packages
While ArrayPlex provides features common to many com-
monly utilized microarray databases (Bioarray Software
Environment, Stanford Microarray Database, Longhorn
Array Database), the ArrayPlex environment is not intended
to operate as one. ArrayPlex was developed to fulfil the need
for interactive, command-line, and programmatic access to
up-to-date genomic resources and analytical toolsets in a net-
worked computational environment. Thus, while several
ArrayPlex client functions such as hierarchical clustering,
ontology analysis, and GenePix Result File Group Analysis
have the intrinsic capacity to store proprietary and tabular
microarray data, ArrayPlex was not designed to supplant
functionality nor provide this capacity in a manner that is
comparable to traditional microarray databases. Several
other research projects address some of these goals in a vari-
ety of ways, but none provide the combined suite of resources
that ArrayPlex does. EnsMart, Atlas, Mayday, SeqHound,
EMMA, GEPAS, and DAVID are all examples of bioinformatic
server environments that address many of the stated data
association and analytical goals [33-39]. SeqHound and Atlas
each house an extensive API-accessible list of resources yet
lack both an extensible user interface and pre-defined com-
mand-line modules. EnsMart, EMMA, and GEPAS each have
a web interface or command-shell environment but lack a cli-
ent-server enabled API. This feature was core to ArrayPlex's
design goal of enabling all computers in a research environ-
ment to be productive platforms on which data analysis can
be accomplished. Mayday and DAVID are toolsets focused
upon DNA microarray data analysis and GO analysis, respec-
tively. They each are feature-rich in these categories but lack
integration with the wide variety of genomic resources pro-
vided by the ArrayPlex environment.
The high-throughput quality evaluation capabilities of the
GenePix Results File Operations section of the ArrayPlex cli-
ent, command-line modules, and programmatic API surpass
existing commercial and open-source software offerings and
greatly reduce the time and error involved in screening large
microarray datasets for signal bias. Molecular Devices, the
original manufacturer of GenePix Scanners, provides similar
quality evaluation features in its GenePix Pro and Acuity soft-
ware packages. These features, however, are limited to graph-
ical user interface access and low-throughput single-
microarray analysis. Bioconductor is an open-source micro-
array data analysis environment that offers programmatic
API access to software routines capable of high-throughput
quality evaluation and plot generation similar to that of
ArrayPlex [40]. Use of Bioconductor, however, is not
extended to a graphical user interface or a simplified com-
mand-line module. In this manner, Bioconductor requires
specialized knowledge of both the R programming language
and shell environments, and is thus an option suited prima-
rily for experienced computational biologists and program-
mers. Finally, in addition to quality evaluation, the GenePix
Results File Normalization and GenePix Results File Group
Analysis modules of the ArrayPlex client provide varied nor-
malization, filter-based evaluation, and extraction features
only partially provided by commercial software packages.
Conclusion
The ArrayPlex environment is a robust platform for genomic
data analysis and visualization. Its ease of installation and
operation provide ready-to-use aggregated genome
resources, genome sequence, and analytical toolsets to users
of the graphical interactive ArrayPlex client, command-line
modules, and programmatic API. The ArrayPlex server keeps
managed genome resources up-to-date, thus providing infor-
mation and analytical results that are synchronized with
curated knowledge. The open-source programmatic API
allows all of the ArrayPlex functions, both client and server, to
be expanded. ArrayPlex has been tested and improved in the
course of a large-scale research project involving the utiliza-
tion of all of its genome resources, genome sequence, and
analytical toolsets.
Requirements and availability
ArrayPlex is available from its project site at sourceforge.net
[41]. The ArrayPlex server, client, and command-line mod-
ules are included in a single installation package. The Array-
Plex client and the command-line modules are prepared
during the process of ArrayPlex server installation such that
Genome Biology 2008, Volume 9, Issue 11, Article R159 Killion and Iyer R159.16
Genome Biology 2008, 9:R159
they are configured to communicate with the ArrayPlex
server being installed by the system administrator. Complete
source-code is provided for each of the operational compo-
nents.
ArrayPlex server requirements
The default server installation requires either an Intel-based
computer running the Linux operating system or any compu-
ter running Mac OS X. Linux servers running both the 2.4 and
2.6 generation of kernels have been tested. During its devel-
opment, ArrayPlex was operated on many distributions of
Linux [42-46]. Mac OS X has been tested with version 10.4
(Tiger), but we expect that most generations of this operating
system will be compatible. Additionally, an operational Post-
greSQL relational database system is required. The ArrayPlex
development and testing process has utilized PostgreSQL
server versions from 7.3 to 8.2. The database server does not
need to be installed on the same computer as the ArrayPlex
server, only reachable by TCP/IP network connectivity and
standard PostgreSQL client utilities. A sequestered ArrayPlex
schema instance is created within the PostgreSQL database
server such that ArrayPlex can co-exist with other database
instances. Neither the Java Runtime Environment (JRE) nor
Apache Tomcat needs to be separately installed by the user,
since each of these resources is bundled within the ArrayPlex
installation in order to create a more encapsulated and ready-
to-operate system. Alternative implementations of the JRE or
Apache Tomcat can be substituted through simple sub-folder
replacement within the installed ArrayPlex server. This proc-
ess is documented in the ArrayPlex Server Installation
Guide.
The ArrayPlex distribution, as downloaded from the Source-
Forge.net project site, is 350 MB in size. The ArrayPlex server,
however, downloads a large quantity of genomic annotation
and sequence during the installation process. The genomic
sequence files are transformed into NCBI BLAST-compatible
databases that allow for rapid sequence retrieval. This results
in the consumption of significant drive space such that an
operational ArrayPlex server requires at least 14 GB for com-
plete installation.
ArrayPlex client requirements
The ArrayPlex client is not installed but rather launched from
the ArrayPlex server by clicking a link within any web
browser. The client is supported on Mac OS X, Windows XP,
Windows Vista, and most distributions of the Linux operating
system. Each of these client operating systems must have a
JRE installed [47]. The default Microsoft-provided Java
installation on any version of Windows is not supported. A
JRE should be downloaded and installed from Sun Microsys-
tems. The JRE that is bundled with Mac OS X (10.2 Jaguar to
10.5 Leopard) has been tested.
Command-line module requirements
The requirements for use of the command-line modules
match those of the ArrayPlex client. They are built by the
ArrayPlex server installation process and downloaded by a
web-browser to any supported client computer.
Abbreviations
API: application programming interface; GML: graph-
markup language; GO: Gene Ontology; GPR: GenePix
Results; HTTP: hypertext transfer protocol; JRE: Java Runt-
ime Environment; NCBI: National Center for Biotechnology
Information; PCL: pre-clustering file format.
Authors' contributions
PJK designed, implemented, and documented all compo-
nents of the ArrayPlex environment. PJK and VRI wrote the
manuscript. VRI provided overall supervision and funding of
the project.
Acknowledgements
We would like to thank the authors, creators, and maintainers of all the ref-
erenced and included data resources and toolsets for both the initial crea-
tion and continued support of these materials. We thank all members of the
Iyer Lab for use and testing of initial ArrayPlex prototypes. This work was
supported by grants from the US National Institutes of Health (NIH) and
the US National Science Foundation (VRI), by a training grant from the US
National Institute on Alcohol Abuse and Alcoholism and by a University of
Texas Continuing Fellowship (PJK).
References
1. Sherlock G, Hernandez-Boussard T, Kasarskis A, Binkley G, Matese J,
Dwight S, Kaloper M, Weng S, Jin H, Ball C, Eisen M, Spellman P,
Brown P, Botstein D, Cherry J: The Stanford Microarray Data-
base. Nucleic Acids Res 2001, 29:152-155.
2. Sarkans U, Parkinson H, Lara G, Oezcimen A, Sharma A, Abeyguna-
wardena N, Contrino S, Holloway E, Rocca-Serra P, Mukherjee G,
Shojatalab M, Kapushesky M, Sansone S, Farne A, Rayner T, Brazma
A: The ArrayExpress gene expression database: a software
engineering and implementation perspective. Bioinformatics
2005, 21:1495-1501.
3. Saeed A, Sharov V, White J, Li J, Liang W, Bhagabati N, Braisted J,
Klapa M, Currier T, Thiagarajan M, Sturn A, Snuffin M, Rezantsev A,
Popov D, Ryltsov A, Kostukovich E, Borisovsky I, Liu Z, Vinsavich A,
Trush V, Quackenbush J: TM4: a free, open-source system for
microarray data management and analysis. BioTechniques
2003, 34:374-378.
4. Saal L, Troein C, Vallon-Christersson J, Gruvberger S, Borg A, Peter-
son C: BioArray Software Environment (BASE): a platform
for comprehensive management and analysis of microarray
data. Genome Biol 2002, 3:SOFTWARE0003.
5. Killion PJ, Sherlock G, Iyer VR: The Longhorn Array Database
(LAD): an open-source, MIAME compliant implementation
of the Stanford Microarray Database (SMD). BMC Bioinformat-
ics 2003, 4:32.
6. Ball C, Awad I, Demeter J, Gollub J, Hebert J, Hernandez-Boussard T,
Jin H, Matese J, Nitzberg M, Wymore F, Zachariah Z, Brown P, Sher-
lock G: The Stanford Microarray Database accommodates
additional microarray platforms and data formats. Nucleic
Acids Res 2005, 33:D580-582.
7. Linux [ />8. Apache Tomcat [ />9. PostgreSQL [ />10. Sun Java Web Start - JWS [ />webstart/]
Genome Biology 2008, Volume 9, Issue 11, Article R159 Killion and Iyer R159.17
Genome Biology 2008, 9:R159
11. Sun Java Archive Format - JAR [ />docs/technotes/guides/jar/jar.html]
12. FASTA Format [ />13. Bray N, Dubchak I, Pachter L: AVID: A global alignment pro-
gram. Genome Res 2003, 13:97-102.
14. Loots GG, Ovcharenko I, Pachter L, Dubchak I, Rubin EM: rVista for
comparative sequence-based discovery of functional tran-
scription factor binding sites. Genome Res 2002, 12:832-839.
15. Hughes J, Estep P, Tavazoie S, Church G: Computational identifi-
cation of cis-regulatory elements associated with groups of
functionally related genes in Saccharomyces cerevisiae. J Mol
Biol 2000, 296:1205-1214.
16. Thompson JD, Higgins DG, Gibson TJ: CLUSTAL W: improving
the sensitivity of progressive multiple sequence alignment
through sequence weighting, position-specific gap penalties
and weight matrix choice. Nucleic Acids Res 1994, 22:4673-4680.
17. Altschul SF, Gish W, Miller W, Myers EW, Lipman DJ: Basic local
alignment search tool. J Mol Biol 1990, 215:403-410.
18. Sherlock G: Cluster. [ />load/].
19. MEME [ />20. MDSCAN [ />21. Hu Z, Killion PJ, Iyer VR: Genetic reconstruction of a functional
transcriptional regulatory network. Nat Genet 2007,
39:683-687.
22. Smyth G, Speed T: Normalization of cDNA microarray data.
Methods 2003, 31:265-273.
23. Hahn JS, Hu Z, Thiele DJ, Iyer VR: Genome-wide analysis of the
biology of stress responses through heat shock transcription
factor. Mol Cell Biol 2004, 24:5249-5256.
24. Chiang DY, Moses AM, Kellis M, Lander ES, Eisen MB: Phylogenet-
ically and spatially conserved word pairs associated with
gene-expression changes in yeasts. Genome Biol 2003, 4:R43.
25. Harbison CT, Gordon DB, Lee TI, Rinaldi NJ, MacIsaac KD, Danford
TW, Hannett NM, Tagne JB, Reynolds DB, Yoo J, Jennings EG, Zei-
tlinger J, Pokholok DK, Kellis M, Rolfe PA, Takusagawa KT, Lander ES,
Gifford DK, Fraenkel E, Young RA: Transcriptional regulatory
code of a eukaryotic genome. Nature 2004, 431:99-104.
26. Kellis M, Patterson N, Endrizzi M, Birren B, Lander ES: Sequencing
and comparison of yeast species to identify genes and regu-
latory elements. Nature 2003, 423:241-254.
27. Zhu J, Zhang MQ: SCPD: a promoter database of the yeast Sac-
charomyces cerevisiae. Bioinformatics 1999, 15:607-611.
28. Shannon P, Markiel A, Ozier O, Baliga N, Wang J, Ramage D, Amin N,
Schwikowski B, Ideker T: Cytoscape: a software environment
for integrated models of biomolecular interaction networks.
Genome Res 2003, 13:2498-2504.
29. Lydall D, Ammerer G, Nasmyth K: A new role for MCM1 in yeast:
cell cycle regulation of SW15 transcription. Genes Dev 1991,
5:2405-2419.
30. Gimeno C, Fink G: Induction of pseudohyphal growth by over-
expression of PHD1, a Saccharomyces cerevisiae gene related
to transcriptional regulators of fungal development. Mol Cell
Biol 1994, 14:2100-2112.
31. Lorenz M, Heitman J: Regulators of pseudohyphal differentia-
tion in Saccharomyces cerevisiae identified through multicopy
suppressor analysis in ammonium permease mutant strains.
Genetics 1998, 150:1443-1457.
32. Pan X, Heitman J: Sok2 regulates yeast pseudohyphal differen-
tiation via a transcription factor cascade that regulates cell-
cell adhesion. Mol Cell Biol 2000, 20:8364-8372.
33. Dietzsch J, Gehlenborg N, Nieselt K: Mayday - a microarray data
analysis workbench. Bioinformatics 2006, 22:1010-1012.
34. Dondrup M, Goesmann A, Bartels D, Kalinowski J, Krause L, Linke B,
Rupp O, Sczyrba A, Puhler A, Meyer F: EMMA: a platform for con-
sistent storage and efficient analysis of microarray data. J Bio-
technol 2003, 106:135-146.
35. Huang da W, Sherman BT, Tan Q, Collins JR, Alvord WG, Roayaei J,
Stephens R, Baseler MW, Lane HC, Lempicki RA: The DAVID
Gene Functional Classification Tool: a novel biological mod-
ule-centric algorithm to functionally analyze large gene lists.
Genome Biol 2007, 8:R183.
36. Kasprzyk A, Keefe D, Smedley D, London D, Spooner W, Melsopp C,
Hammond M, Rocca-Serra P, Cox T, Birney E: EnsMart: a generic
system for fast and flexible access to biological data. Genome
Res 2004, 14:160-169.
37. Michalickova K, Bader GD, Dumontier M, Lieu H, Betel D, Isserlin R,
Hogue CW: SeqHound: Biological Sequence and Structure
Database as a Platform for Bioinformatics Research. BMC
Bioinformatics 2002, 3:32.
38. Montaner D, Tarraga J, Huerta-Cepas J, Burguet J, Vaquerizas JM,
Conde L, Minguez P, Vera J, Mukherjee S, Valls J, Pujana MA, Alloza E,
Herrero J, Al-Shahrour F, Dopazo J: Next station in microarray
data analysis: GEPAS. Nucleic Acids Res 2006, 34:W486-491.
39. Shah SP, Huang Y, Xu T, Yuen MM, Ling J, Ouellette BF: Atlas - a
Data Warehouse for Integrative Bioinformatics. BMC Bioinfor-
matics 2005, 6:34.
40. Gentleman R, Carey V, Bates D, Bolstad B, Dettling M, Dudoit S, Ellis
B, Gautier L, Ge Y, Gentry J, Hornik K, Hothorn T, Huber W, Iacus
S, Irizarry R, Leisch F, Li C, Maechler M, Rossini A, Sawitzki G, Smith
C, Smyth G, Tierney L, Yang J, Zhang J: Bioconductor: open soft-
ware development for computational biology and bioinfor-
matics. Genome Biol 2004, 5:R80.
41. SourceForge.net ArrayPlex Project [ />projects/arrayplex/]
42. Mandriva Linux [ />43. Fedora Linux [ />44. Gentoo Linux [ />45. RedHat Linux [ />46. Ubuntu Linux []
47. Sun Java Runtime Environment - JRE
[]