Báo cáo y học: "nomic mapping of RNA polymerase II reveals sites of co-transcriptional regulation in human cells" pot
Bạn đang xem bản rút gọn của tài liệu. Xem và tải ngay bản đầy đủ của tài liệu tại đây (1.42 MB, 9 trang )
Genome Biology 2005, 6:R64
comment reviews reports deposited research refereed research interactions information
Open Access
2005Brodskyet al.Volume 6, Issue 8, Article R64
Research
Genomic mapping of RNA polymerase II reveals sites of
co-transcriptional regulation in human cells
Alexander S Brodsky
*
, Clifford A Meyer
†
, Ian A Swinburne
*
, Giles Hall
‡
,
Benjamin J Keenan
*
, Xiaole S Liu
†
, Edward A Fox
‡
and Pamela A Silver
*
Addresses:
*
Department of Systems Biology, Harvard Medical School and Department of Cancer Biology, Dana-Farber Cancer Institute, 44
Binney St, Boston, MA 02115, USA.
†
Department of Biostatistics and Computational Biology, Dana-Farber Cancer Institute and Harvard School
of Public Health, Boston, MA 02155, USA.
‡
Department of Medicine, Harvard Medical School and Department of Medical Oncology, Dana-
Farber Cancer Institute, Boston, MA 02115, USA.
Correspondence: Alexander S Brodsky. E-mail:
© 2005 Brodsky et al.; licensee BioMed Central Ltd.
This is an Open Access article distributed under the terms of the Creative Commons Attribution License (
which permits unrestricted use, distribution, and reproduction in any medium, provided the original work is properly cited.
Genomic mapping of RNA Polymerase II in human cells<p>Determination of the distribution on RNA Polymerase II within regions of the human genome identifies novel sites of transcription and suggests that a major factor of transcription elongation control in mammals is the coordination of transcription and pre-mRNA processing to define exons</p>
Abstract
Background: Transcription by RNA polymerase II is regulated at many steps including initiation,
promoter release, elongation and termination. Accumulation of RNA polymerase II at particular
locations across genes can be indicative of sites of regulation. RNA polymerase II is thought to
accumulate at the promoter and at sites of co-transcriptional alternative splicing where the rate of
RNA synthesis slows.
Results: To further understand transcriptional regulation at a global level, we determined the
distribution of RNA polymerase II within regions of the human genome designated by the
ENCODE project. Hypophosphorylated RNA polymerase II localizes almost exclusively to 5' ends
of genes. On the other hand, localization of total RNA polymerase II reveals a variety of distinct
landscapes across many genes with 74% of the observed enriched locations at exons. RNA
polymerase II accumulates at many annotated constitutively spliced exons, but is biased for
alternatively spliced exons. Finally, RNA polymerase II is also observed at locations not in gene
regions.
Conclusion: Localizing RNA polymerase II across many millions of base pairs in the human
genome identifies novel sites of transcription and provides insights into the regulation of
transcription elongation. These data indicate that RNA polymerase II accumulates most often at
exons during transcription. Thus, a major factor of transcription elongation control in mammalian
cells is the coordination of transcription and pre-mRNA processing to define exons.
Background
Transcriptional and post-transcriptional regulation of gene
expression intersect at RNA polymerase II. The rate of
polymerase II movement is altered by loading of transcription
factors at the promoter, chromatin structure, pre-mRNA
processing, elongation control and termination [1-3]. Thus,
polymerase II accumulates at promoters as well as at different
locations across a particular gene [4], but the general patterns
Published: 15 July 2005
Genome Biology 2005, 6:R64 (doi:10.1186/gb-2005-6-8-r64)
Received: 4 January 2005
Revised: 7 April 2005
Accepted: 17 June 2005
The electronic version of this article is the complete one and can be
found online at />R64.2 Genome Biology 2005, Volume 6, Issue 8, Article R64 Brodsky et al. />Genome Biology 2005, 6:R64
across many different genes have yet to be explored. Numer-
ous factors such as histones, post-translation modifying
enzymes, and RNA-binding proteins regulate these processes
[1,3]. One key determinant of transcription is the phosphor-
ylation state of the carboxy-terminal domain (CTD) of
polymerase II [5,6] which becomes hyperphosphorylated
during transcription elongation [4,6-9]. Much of our under-
standing of transcription elongation comes from work in
prokaryotes and yeast where most genes are intronless [1,3].
Transcription and pre-mRNA processing are coordinated, as
the two processes affect the efficiency of each other [2,10].
The spatial patterns of the different phosphorylation states of
polymerase II across genes remains poorly understood in
mammalian systems.
Results and discussion
To explore the range of locations where polymerase II accu-
mulates across the genome, we performed chromatin immu-
noprecipitation (ChIP) from HeLa S3 cells, and profiled the
purified DNA using an oligonucleotide-tiled microarray
interrogating the Encyclopedia of DNA Elements (ENCODE)
regions [11] covering 471 known genes. Two antibodies were
used, 8WG16 and 4H8, which recognize the hypophosphor-
ylated (PolIIa) or a phosphorylation-independent state of the
CTD of polymerase II (PolII), respectively. Thus, the 4H8
antibody is recognizing the total polymerase II population.
Isolated DNA was amplified using a multiple displacement
amplification (MDA) strategy (see Materials and methods)
[12].
To identify sites of enrichment, we used a non-parametric
approach generalizing the Wilcoxon signed-rank test [13].
Signals across 1,000 nucleotides were used to determine a p-
value for each probe. Probes were filtered for uniqueness
within the bandwidth. Probes with p-values below 10
-4
were
selected for further analysis because this threshold has a low
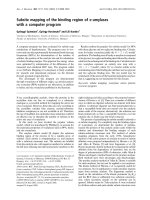
false-positive rate as determined by PCR analysis (Figure 1).
With these parameters, the hypophosphorylated-specific
anti-PolIIa antibody reveals 102 occupied sites, whereas the
phosphorylation-independent antibody shows 550 sites
(Table 1).
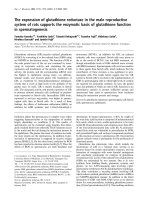
RNA polymerase II has distinct landscapes across each gene.
Figure 2 shows representative genes with polymerase enrich-
ments. PolIIa is highly enriched at transcription initiation
sites. On the other hand, PolII shows gene-specific land-
scapes with the strongest enrichments at exons within
actively transcribed loci. Active genes reveal lower p-values
across the gene compared with intergenic or inactive genes
Table 1
Summary of RNA polymerase II locations
Sites Pol IIa Pol II
Total sites 102 550
RefSeq total exons 70 289
RefSeq first exons 63 75
RefSeq terminal exons 2 91
RefSeq internal exons 5 123
RefSeq introns 4 120
knownGene exon 0 5
genscan exon 1 23
geneid or sgpGene 0 3
Active gene introns 2 57
Inactive introns 1 32
No RefSeq overlap 28 141
knownGene total exons 5 38
knownGene first exon 5 13
knownGene terminal exon 0 4
knownGene internal exon 0 21
No RefSeq or knownGene 23 90
genscan exons 7 43
geneid or sgpGene 2 6
The order indicates the flowchart of filtering through the different databases. Enrichment sites were first compared to the RefSeq database. Sites that
are not near exons were then divided into two categories: locations that are in RefSeq introns; and locations that are not in a RefSeq gene. The latter
are then compared with knownGene and predicted gene databases. For both RNA polymerase II phosphorylation states, the large majority of sites
are near an exon.
Genome Biology 2005, Volume 6, Issue 8, Article R64 Brodsky et al. R64.3
comment reviews reports refereed researchdeposited research interactions information
Genome Biology 2005, 6:R64
(compare Figure 2a and 2b), indicating a relative absence of
polymerase II from the nontranscribed regions. Some smaller
genes with high exon density, such as SF1, reveal significant
polymerase signal across almost the entire locus (Figure 2a).
Distinct accumulations are observed with significant p-values
around exons for both SF1 and KIAA1932. In the KIAA1932
gene, PolII is enriched at a subset of constitutively and alter-
natively spliced exons (Figure 2c). For some genes, RNA
polymerase II is enriched at relatively few locations within the
gene (Figure 2d).
An important question is to determine if the polymerase II
sites are indicative of active transcription. We addressed this
in multiple ways. First, microarray expression profiling of the
mRNA with Affymetrix U133 Plus 2 chips confirms that many
of the RNA polymerase II-associated genes are actively
expressed in HeLa cells, as seen in a plot of mRNA expression
level versus p-value in Figure 3. Genes with significant RNA
polymerase II enrichment are biased towards genes with
higher mRNA levels. Figure 3 also shows that some genes
have apparently high mRNA levels but no significant levels of
PolII or PolIIa. This could be due to very low transcription
levels but high mRNA stability. Second, we measured RNA
from the same HeLa cells on the ENCODE tiled arrays. We
observe that 34% of the PolII sites overlap with RNA signal
(compared to approximately 8% expected at random) and
50% of the PolII locations are within 1 kb of some RNA signal
(compared to 13% expected at random). Many sites where
small pieces of RNA are synthesized, such as small exons, may
be missed as a result of the spacing of the oligonucleotide
probes and the imperfect nature of the probes. Third, many of
the PolII and PolIIa sites overlap with annotated expressed
sequence tags (ESTs) and mRNAs. Eighty-seven percent of
the PolII-enriched and 88% of the PolIIa-enriched locations
overlap with EST regions, compared to 31% and 44%
expected at random, respectively. Lastly, reverse tran-
scriptase PCR checks of KIAA1932 and DKC1 indicate that
these genes are being expressed (data not shown). These data
suggest that RNA polymerase II sites are biased towards
regions of active transcription and that determining sites of
enrichment of RNA polymerase II is an indicator of
transcription.
Levels of RNA polymerase II enrichment at internal exons
can vary between genes. To examine whether these patterns
are influenced by expression levels, two categories were cre-
ated: genes with multiple PolII enrichments at internal
exons; and genes with PolII at one or zero internal exons.
When compared to the mRNA levels, there is no significant
difference between the two categories, suggesting that the
number of PolII sites across the gene does not vary signifi-
cantly with RNA levels. Genes with observable PolII enrich-
ment at internal exons are correlated with higher mRNA
levels on the expression array. This is consistent with reports
proposing the use of PolII ChIP to monitor gene expression
[14]. Therefore, the number of PolII sites at internal exons
may reflect different levels of transcription elongation control
and not just the sensitivity of the experiment.
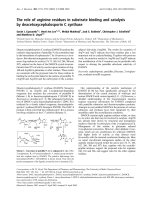
Distinct from the hypophosphorylation-specific antibody, the
phosphorylation-independent antibody reveals diverse
enrichment locations for PolII. In total, 74% of the identified
PolII locations are near an annotated knownGene, RefSeq, or
genscan exon as summarized in Table 1 (see Additional data
file 2 for a list of PolII genscan exon locations). Unlike PolIIa,
PolII sites are distributed between the 5' and 3' ends of genes,
with a slight bias towards terminal exons over initiating exons
(Figure 4). This is probably reflecting the stalling of PolII dur-
ing the coupled processes of transcription termination and 3'-
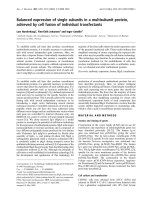
end processing [15]. For some genes, significant PolII signal
is observed more than 1 kb past the terminal exon, which
might indicate transcription of the longer pre-mRNA before
3'-end cleavage and polyadenylation [16]. Figure 5 shows two
representative genes with significant PolII enrichment past
the terminal exon.
Most of the hypophosphorylated PolIIa locations at internal
exons also overlap a transcription initiation site, as the inter-
nal exon in question is often the second exon in the gene. Only
two enrichment sites overlap with an internal exon without
also being near the first exon of a transcript. One of these is at
a CpG island in the MCF2L gene and the other may be an
alternative transcription initiation site as annotated in the
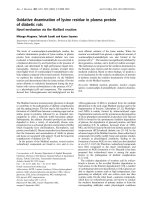
Enrichment of selected genomic regions in ChIPFigure 1
Enrichment of selected genomic regions in ChIP. (a) PolII ChIP; (b) PolIIa
ChIP. Real-time PCR relative enrichment ratios for selected regions are
found to be enriched more often with p-values below 10
-4
. These regions
include both intra- and intergenic locations as listed in Additional data file
8.
p > 10
−4
p < 10
−4
p > 10
−4
p < 10
−4
Log(relative enrichment)
Relative enrichment
18
1,000
Pol II
Pol IIa
100
10
1
0.1
16
14
12
10
8
6
4
2
0
(a) (b)
R64.4 Genome Biology 2005, Volume 6, Issue 8, Article R64 Brodsky et al. />Genome Biology 2005, 6:R64
HG17 assembly at the beginning of the ITGB4BP gene. To
classify the remaining sites within introns or in intergenic
regions, enrichment sites were compared to other gene data-
bases. As summarized in Table 1, four PolIIa sites are in
introns, but three of these are within resolution of annotated
or predicted exons, leaving only one location not overlapping
an exon of some kind. There are 28 hypophosphorylated
polymerase sites not in a RefSeq gene region. After following
a similar filtering approach, only 14 sites remain that are not
near a putative exon. Thus, only 14% of PolIIa-enriched loca-
tions do not overlap with a known exon or actively tran-
scribed region. Additional data file 2 lists PolIIa sites at
predicted exons that are probably newly identified transcrip-
tion initiation locations in HeLa cells. Figure 5 shows two
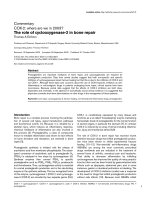
RNA polymerase II shows a variety of gene-specific enrichment patternsFigure 2
RNA polymerase II shows a variety of gene-specific enrichment patterns. Graphs plot 10log(p-value) mapped to chromosome position with the significant
p-values greater than 40 indicated by the rectangle blocks below the graph. Values are plotted at every probe location. Flat lines indicate weak p-values and
gaps indicate the absence of probes. The high density of probes across these genes suggest that the observed patterns are not due to probe bias. A scale
bar is shown for each panel to reflect the different gene lengths displayed. RefSeq genes and knownGenes are annotated in green and blue, respectively,
with thick bars representing exons and thin lines introns. Genes above the white bar are ordered 5' to 3', whereas those below the white bar are 3' to 5'.
(a) On the highly expressed SF1 gene, PolIIa localizes to the first exon only. PolII accumulates across the gene with a distinctive pattern. (b) No significant
signal is observed across the inactive NRXN2 locus which is near SF1 on chromosome 11. Graphs are plotted on the same scale as (a). (c) The moderately
expressed gene KIAA1932 also reveals distinct accumulations across the gene. The red box highlights alternatively spliced exons. At the 3' end of the gene,
some PolIIa signal is observed, probably indicative of the expression of a small gene antisense to KIAA1932. (d) Another commonly observed pattern is
exemplified by the EHD1 gene. Both anti-polymerase antibodies recognize the first exon, but no other significant signal is observed across the gene until
the 3' end.
(a) (b)
(c) (d)
Pol IIa
Pol II
Pol IIa
Pol II
refGene
Pol IIa
Pol II
knownGene
PYGM SF1
NRXN2 NRXN2
1.2 kb 5 kb
0.9 kb 1.6 kb
knownGene:
refGene
knownGene:
CDC42EDS
refGene:
KIAA1932
Pol IIa
Pol II
refGene
EHD1
knownGene:
refGene
knownGene:
Genome Biology 2005, Volume 6, Issue 8, Article R64 Brodsky et al. R64.5
comment reviews reports refereed researchdeposited research interactions information
Genome Biology 2005, 6:R64
examples of PolII and RNA signal at new sites of transcrip-
tion. From the pattern of enrichments it is probable that
many of these predicted exons are real and are transcription
initiation locations, given the observed strong bias of the
8WG16 antibody for transcription initiation locations in well
annotated genes.
To determine the generality of these observations, all RNA
polymerase II occupancy sites were compared with the
known genes and RefSeq databases, version HG16. PolIIa is
highly enriched for the first exons around transcription initi-
ation sites (Figure 4) representing 77 of 551 known genes in
HG16 on the array (see Additional data file 1 for the entire
lists).
Elongation control is a common transcriptional regulation
mechanism believed to affect a wide range of functional gene
classes [1]. In particular, RNA polymerase II pausing has
been proposed to be associated with alternative splicing, [2].
To determine if there is a bias for alternative exons, we
counted all the annotated alternatively spliced exons in the
knownGene database and determined the distribution of
PolII enrichment locations on them. PolII is enriched at 57%
of the annotated alternatively spliced exons of the active
genes compared to 37% of annotated actively transcribed
constitutively expressed exons. We also examined the distri-
bution of all PolII p-values on different types of exons. Each
exon was mapped to the smallest p-value ChIP-enriched site
that overlaps the exon. The cassette exons are found to be
more significantly associated with smaller p-values compared
to constitutively expressed exons according to the two-sam-
ple Kolmogorov-Smirnov test with a two sided p-value of less
than 0.0035.
One attractive hypothesis is that sites of exon enrichment
may reflect weaker splice sites where PolII stalls during splice
site recognition. Using two different empirical methods to
estimate splice site strength, no significant differences are
observed between the exons overlapping PolII and those that
do not [17,18]. Alternatively, some of the annotated constitu-
tively expressed exons may actually be subject to alternative
splicing decisions. Kampa et al. suggest that the levels of
alternative splicing are much higher than commonly believed
and annotated in the human genome from their examination
of expression on tiled arrays [19]. Consistent with these find-
ings, RNA polymerase II sites may be predicting which exons
are being co-transcriptionally alternatively spliced.
To determine if there is any pattern for the 120 PolII enrich-
ment sites that are in RefSeq introns, we compared these sites
to knownGene, genscan, geneid, and sgpGene databases and
find 31 within resolution of putative exons. Of the remaining
89, 57 are in genes with PolII enrichment sites that also
overlap exons, suggesting that they are actively transcribed
genes. No clear intronic positional bias is observed.
Different RNA polymerase states show distinct exon biasesFigure 3
Different RNA polymerase states show distinct exon biases. Pie charts
representing the percentage of exons in each category at RNA polymerase
enrichment locations. These include exons from enrichment locations that
include more than one exon. PolIIa is strongly biased towards
transcription initiation locations. Most of the internal exons are second
exons overlapping with first exons. The phosphorylation-independent
antibody recognizes PolII at both transcription initiation and termination
locations with a slight bias towards termination locations.
Pol II
11%
13%
76%
Pol IIa
6%
35%
59%
7%
31%
62%
Internal exons
5′ Exons
3′ Exons
14%
16%
70%
RefSeq knownGene
Low p-value PolII and PolIIa enrichments are biased towards higher mRNA levelsFigure 4
Low p-value PolII and PolIIa enrichments are biased towards higher mRNA
levels. The plot depicts the observed intensity from Affymetrix U133 Plus
2 chips compared with different p-values of PolII (white) and PolIIa (gray).
Some genes with no significant PolII enrichment show high levels of
observed intensity.
12
10
Observed log intensity (log(PM-MM))
8
6
p-value
4
2
10
−2
− 1
10
−2
− 1
10
−3
− 10
−2
10
−3
− 10
−2
10
−4
− 10
−3
10
−4
− 10
−3
<10
−
4
<10
−4
R64.6 Genome Biology 2005, Volume 6, Issue 8, Article R64 Brodsky et al. />Genome Biology 2005, 6:R64
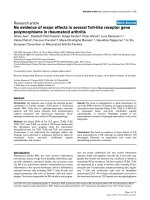
Figure 5 (see legend on next page)
PoI lIa
PoI lI
RNA
known genes
genscan
Multispecies
conservation
PoI lIa
PoI lI
RNA
known genes
genscan
Multispecies
conservation
PoI lIa
PoI lI
RNA
known genes
genscan
Multispecies
conservation
PoI lIa
Pol II
RNA
known genes
genscan
Multispecies
conservation
DSCR2
70 kb
58 kb
21 kb
15 kb
CAPZA2
TUFT1
(a)
(b)
(c)
(d)
Genome Biology 2005, Volume 6, Issue 8, Article R64 Brodsky et al. R64.7
comment reviews reports refereed researchdeposited research interactions information
Genome Biology 2005, 6:R64
In conclusion, we have identified new sites of RNA polymer-
ase II accumulation across hundreds of genes in mammalian
cells. The large majority of polymerase II-enriched locations
are at actively transcribed exons with a bias towards anno-
tated alternatively spliced exons. Many of the PolII sites at
annotated constitutively expressed exons may be sites of
alternative splicing. Whatever the eventual splicing decision,
these observations suggest that events around exons slow
transcription elongation. A recent study suggests that even
general splicing factors may slow elongation [20]. Stalling of
RNA polymerase II near exons may function to slow RNA
synthesis in order to wait for the competition of myriad
splicing signals to be resolved in order to define the exon
[21,22]. These ChIP data identify where these states of RNA
polymerase II are localizing across the ENCODE regions.
Across genes, these data are consistent with the hypothesis of
transcriptional pausing at particular locations. Alternatively,
it is possible that RNA polymerase II is rearranging during
transcription such that the epitope is only accessible around
exons. Thus, the conformation of polymerase II may be
changing and not the transcription rate. Nonetheless, it is
interesting that the majority of observable elongating
polymerase II accumulates around exons, suggesting that a
major feature of transcription elongation control is coupling
to pre-mRNA processing.
These observations differ from those observed in intronless
genes typically found in prokaryotes and yeast where a more
uniform PolII enrichment is observed across genes [16]. What
appears to be conserved is PolII accumulation in coding
regions compared to intronic regions. These data highlight
the complexity and gene-specific nature of transcription reg-
ulation not only at transcription initiation and termination
locations but at specific exons. Together, these observations
suggest that a major feature of transcription elongation
control in mammalian cells is exon definition. Thus, these
data provide new insights into the coordination of transcrip-
tion and pre-mRNA processing in mammalian cells.
Materials and methods
Chromatin immunoprecipitation and DNA
amplification
Chromatin immunoprecipitations (ChIP) were performed as
described with the following modifications [23]. HeLa S3
cells were first crosslinked with dimethyl adipimidate (DMA)
(Pierce) for 10 min, washed with PBS and then crosslinked
with formaldehyde for 10 min. Cells were collected, lysed, and
chromatin was sheared by sonication to an average length of
1 kb as determined after RNase treatment of the samples on
an agarose gel. Chromatin was prepared from four independ-
ently grown batches of cells and pooled to generate three rep-
licate immunoprecipitations (IP) and six input samples.
Briefly, 8WG16 (Covance) and 4H8 (AbCam) antibodies were
incubated with a 50:50 mix of Dynal protein A/G beads for
more than 16 h at 4°C in PBS with 5 mg/ml BSA. After wash-
ing in PBS, beads with bound antibody were incubated with
chromatin from approximately 2 × 10
7
cells for more than 16
h at 4°C. Beads were washed eight times with RIPA buffer (50
mM HEPES pH 7.6, 1 mM EDTA, 0.7% DOC, 1% IGEPAL, 0.5
M LiCl) before DNA was eluted at 65°C in TE/1% SDS.
Crosslinks were reversed by incubating at 65°C for more than
12 h followed by proteinase K treatment, phenol extraction
and RNase treatment. Isolated DNA was then amplified iso-
thermally using random nonamer primers and Klenow
polymerase (Invitrogen) for more than 4 h, yielding approxi-
mately 2 µg of DNA per IP. DNA was prepared and hybridized
on Affymetrix ENCODE oligonucleotide tiled arrays using the
fragmentation, hybridization, staining and scanning proce-
dure described by Kennedy et al. [24]. Affymetrix ENCODE
microarrays have interrogating 25mer oligonucleotide probes
tiled every 20 bp on average. A sample of chromatin was set
aside before IP and used to represent the input DNA.
Tiled array analysis
Quantile normalization was used to make the distribution of
probe intensities the same for all arrays [25]. In the case of the
Affymetrix GTRANS software quantile normalization is used
within treatment and control replicate sets. Non-parametric
methods based on ranks were used to identify ChIP-enriched
regions. These methods make mild assumptions about the
data distributions and are insensitive to outlying observa-
tions. A p-value was calculated for every assay probe on the
array. The set of probes used in the calculation of this p-value
was defined by a bandwidth parameter b. All probes centered
on the chromosome at positions less than b bases 5' or 3' of
the given probe position are included in this set.
The Wilcoxon rank sum test [26], also known as the Mann-
Whitney U test, is the basis of the p-value statistic computed
by the Affymetrix GTRANS software. The control and treat-
ment observation sets are, respectively, the sets of normalized
control and normalized treatment intensities from all repli-
PolII enrichment is not always within annotated gene boundariesFigure 5 (see previous page)
PolII enrichment is not always within annotated gene boundaries. Views are from the UCSC Genome Browser genome version HG16. PolIIa is in black and
PolII is in blue with four rows for each, representing the data at different p-values: p < 10
-5
, p < 10
-4
, p < 10
-3
, and p < 10
-2
from top to bottom. RNA signal
in red. (a, b) PolII extending beyond the 3' end of the annotated gene. (c, d) PolII signal in putative intergenic regions with observed RNA signal also
observed in the vicinity; (d) covers chromosome 11, positions 285,000-290,000. These regions are conserved and are also near predicted genscan exons.
These novel sites not in the gene regions were confirmed by PCR.
R64.8 Genome Biology 2005, Volume 6, Issue 8, Article R64 Brodsky et al. />Genome Biology 2005, 6:R64
cates and all probes within the bandwidth. The null hypothe-
sis is that the treatment set mean is no larger than that of the
control set.
To take into account probe-to-probe variability we used a
generalization of the Wilcoxon signed-rank test for blocked
data. All input and IP normalized, sign(PM-MM)max(1,|PM-
MM|) intensities (where PM are perfect match and MM are
mismatched probes) interrogating the same chromosomal
location were assigned to the same block. Aligned observa-
tions were derived by subtracting the median normalized
intensity for a given block from each observation in that
block. All aligned observations within the bandwidth were
ranked. A statistic W was defined as the sum of the ranks of
the aligned IP observations. A p-value was derived from W,
based on the joint null distribution of the aligned input and IP
ranks. The analyses depend on the assumption that probes
are independent. Probes were mapped to the genomic coordi-
nates to ensure that no probe mapped to more than one loca-
tion in any 1,000-bp window and that no two probes map to
the same genomic location.
RNA arrays
RNA samples were isolated from HeLa S3 cells and purified
with trizol (Invitrogen) and RNeasy (Qiagen). RNA was
amplified and hybridized to Affymetrix U133 Plus 2 arrays
using standard methods. Three biological replicates were
quantile normalized. Gene expression was indicated by the
median of PM-MM values over all probes. The hypothesis of
difference in gene expression between groups of genes, based
on median PM-MM, was tested using the Wilcoxon rank sum
statistic. For hybridization to the ENCODE tiled array, RNA
was similarly isolated and double-stranded cDNA was gener-
ated using Invitrogen Superscript cDNA synthesis kit. cDNA
(1-1.5 µg) was hybridized to the tiled array. Three biological
replicates were performed for each RNA array.
Genomic annotation
Sites were determined to be near a genomic annotation if they
were within the apparent 1,000 bp resolution. Sites shorter
than 1,000 bp were scaled in size to include 1,000 bp around
the center of the site. Sites that were longer than 1,000 bp
used the data-determined length for their resolution size.
Databases were downloaded from the University of California
at Santa Cruz (UCSC) Golden Path Genome Browser and
loaded into a local MySQL database. Exons were compared
and classified as one or more of the following: start, terminal,
alternatively spliced, constitutive or cassette. Because the
arrays were designed using the HG15 assembly, the data were
compared to this version of the human genome unless other-
wise noted. The active gene list was defined as those with
PolIIa at the first exon of the gene.
Real-time PCR
PCR primer pairs were designed to amplify 100-bp fragments
from selected genomic regions (see Additional data file 8).
Each real-time PCR reaction contained 50 nM primers,
approximately 1 ng DNA and 1 × ABI SYBR PCR reaction mix.
A fluorescence value proportional to the initial quantity of
target DNA was calculated by a log-linear regression analysis
for each quadruplicate amplification curve [27]. We normal-
ized this value to an input chromatin sample, then normalized
this ratio to a reference gene, PAPT, which is not expressed in
HeLa cells, to calculate a relative enrichment value for the tar-
get ((Target
IP
)/(Target
Inp
))/((PAPT
IP
)/(PAPT
Input
)).
Data availability
All data is present at Gene Expression Omnibus (GEO) at
accession number GSE2735.
Additional data files
The following additional data are available with the online
version of this paper. Additional data file 1 is a table listing
PolIIa annotated to refGene. Additional data file 2 is a table
listing PolIIa annotated to known genes. Additional data file
3 is a table listing PolIIa annotated to RefSeq. Additional data
file 4 is a table listing PolII annotated to known genes. Addi-
tional data file 5 is a table listing PolII annotated to genscan
exons. Additional data file 6 is a table listing knownGene and
RefSeq populations on the ENCODE array. Additional data
file 7 is a table listing the PolIIa-defined active gene list. Addi-
tional data file 8 is the PCR primer list and annotation.
Additional File 1A table listing PolIIa annotated to refGene.A table listing PolIIa annotated to refGene.Click here for fileAdditional File 2A table listing PolIIa annotated to known genes.A table listing PolIIa annotated to known genes.Click here for fileAdditional File 3A table listing PolIIa annotated to RefSeq.A table listing PolIIa annotated to RefSeq.Click here for fileAdditional File 4A table listing PolII annotated to known genes.A table listing PolII annotated to known genes.Click here for fileAdditional File 5A table listing PolII annotated to genscan exons.A table listing PolII annotated to genscan exons.Click here for fileAdditional File 6A table listing knownGene and RefSeq populations on the ENCODE array.A table listing knownGene and RefSeq populations on the ENCODE array.Click here for fileAdditional File 7A table listing the PolIIa-defined active gene list.A table listing the PolIIa-defined active gene list.Click here for fileAdditional File 8The PCR primer list and annotation.The PCR primer list and annotation.Click here for file
Acknowledgements
We thank Pamela Hollasch, Maura Berkeley and the DFCI Affymetrix core
for all their assistance, and Jason Carroll and Jessica Hurt for critical reading
of the manuscript. We thank Adnan Derti for trying some splice-site
strength analysis. This work was funded by a NHGRI K22 career award,
HG02488-01A1 (A.S.B.), and a DOD grant DAMD17-02-0364 (P.A.S.).
References
1. Arndt KM, Kane CM: Running with RNA polymerase: eukaryo-
tic transcript elongation. Trends Genet 2003, 19:543-550.
2. Kornblihtt AR, de la Mata M, Fededa JP, Munoz MJ, Nogues G: Mul-
tiple links between transcription and splicing. RNA 2004,
10:1489-1498.
3. Sims RJ 3rd, Belotserkovskaya R, Reinberg D: Elongation by RNA
polymerase II: the short and long of it. Genes Dev 2004,
18:2437-2468.
4. Cheng C, Sharp PA: RNA polymerase II accumulation in the
promoter-proximal region of the dihydrofolate reductase
and gamma-actin genes. Mol Cell Biol 2003, 23:1961-1967.
5. Dahmus ME: Reversible phosphorylation of the C-terminal
domain of RNA polymerase II. J Biol Chem 1996,
271:19009-19012.
6. Komarnitsky P, Cho EJ, Buratowski S: Different phosphorylated
forms of RNA polymerase II and associated mRNA process-
ing factors during transcription. Genes Dev 2000, 14:2452-2460.
7. Boehm AK, Saunders A, Werner J, Lis JT: Transcription factor and
polymerase recruitment, modification, and movement on
dhsp70 in vivo in the minutes following heat shock. Mol Cell Biol
2003, 23:7628-7637.
8. Kim M, Ahn SH, Krogan NJ, Greenblatt JF, Buratowski S: Transitions
in RNA polymerase II elongation complexes at the 3' ends of
genes. EMBO J 2004, 23:354-364.
9. Ahn SH, Kim M, Buratowski S: Phosphorylation of serine 2 within
the RNA polymerase II C-terminal domain couples tran-
scription and 3' end processing. Mol Cell 2004, 13:67-76.
Genome Biology 2005, Volume 6, Issue 8, Article R64 Brodsky et al. R64.9
comment reviews reports refereed researchdeposited research interactions information
Genome Biology 2005, 6:R64
10. Hirose Y, Tacke R, Manley JL: Phosphorylated RNA polymerase
II stimulates pre-mRNA splicing. Genes Dev 1999,
13:1234-1239.
11. The ENCODE (ENCyclopedia Of DNA Elements) Project.
Science 2004, 306:636-640.
12. Dean FB, Hosono S, Fang L, Wu X, Faruqi AF, Bray-Ward P, Sun Z,
Zong Q, Du Y, Du J, et al.: Comprehensive human genome
amplification using multiple displacement amplification. Proc
Natl Acad Sci USA 2002, 99:5261-5266.
13. Cawley S, Bekiranov S, Ng HH, Kapranov P, Sekinger EA, Kampa D,
Piccolboni A, Sementchenko V, Cheng J, Williams AJ, et al.: Unbiased
mapping of transcription factor binding sites along human
chromosomes 21 and 22 points to widespread regulation of
noncoding RNAs. Cell 2004, 116:499-509.
14. Sandoval J, Rodriguez JL, Tur G, Serviddio G, Pereda J, Boukaba A,
Sastre J, Torres L, Franco L, Lopez-Rodas G: RNAPol-ChIP: a
novel application of chromatin immunoprecipitation to the
analysis of real-time gene transcription. Nucleic Acids Res 2004,
32:e88.
15. Enriquez-Harris P, Levitt N, Briggs D, Proudfoot NJ: A pause site
for RNA polymerase II is associated with termination of
transcription. EMBO J 1991, 10:1833-1842.
16. Kim M, Krogan NJ, Vasiljeva L, Rando OJ, Nedea E, Greenblatt JF,
Buratowski S: The yeast Rat1 exonuclease promotes tran-
scription termination by RNA polymerase II. Nature 2004,
432:517-522.
17. Shapiro MB, Senapathy P: RNA splice junctions of different
classes of eukaryotes: sequence statistics and functional
implications in gene expression. Nucleic Acids Res 1987,
15:7155-7174.
18. Zhang MQ, Marr TG: A weight array method for splicing signal
analysis. Comput Appl Biosci 1993, 9:499-509.
19. Kampa D, Cheng J, Kapranov P, Yamanaka M, Brubaker S, Cawley S,
Drenkow J, Piccolboni A, Bekiranov S, Helt G, et al.: Novel RNAs
identified from an in-depth analysis of the transcriptome of
human chromosomes 21 and 22. Genome Res 2004, 14:331-342.
20. Ujvari A, Luse DS: Newly Initiated RNA encounters a factor
involved in splicing immediately upon emerging from within
RNA polymerase II. J Biol Chem 2004, 279:49773-49779.
21. Roberts GC, Gooding C, Mak HY, Proudfoot NJ, Smith CW: Co-
transcriptional commitment to alternative splice site
selection. Nucleic Acids Res 1998, 26:5568-5572.
22. Robson-Dixon ND, Garcia-Blanco MA: MAZ elements alter tran-
scription elongation and silencing of the fibroblast growth
factor receptor 2 exon IIIb. J Biol Chem 2004, 279:29075-29084.
23. Ren B, Cam H, Takahashi Y, Volkert T, Terragni J, Young RA,
Dynlacht BD: E2F integrates cell cycle progression with DNA
repair, replication, and G(2)/M checkpoints. Genes Dev 2002,
16:245-256.
24. Kennedy GC, Matsuzaki H, Dong S, Liu WM, Huang J, Liu G, Su X,
Cao M, Chen W, Zhang J, et al.: Large-scale genotyping of com-
plex DNA. Nat Biotechnol 2003, 21:1233-1237.
25. Bolstad BM, Irizarry RA, Astrand M, Speed TP: A comparison of
normalization methods for high density oligonucleotide
array data based on variance and bias. Bioinformatics 2003,
19:185-193.
26. Hollander M, Wolfe DA: Nonparametric Statistical Methods 2nd edi-
tion. New York: John Wiley; 1999.
27. Ostermeier GC, Liu Z, Martins RP, Bharadwaj RR, Ellis J, Draghici S,
Krawetz SA: Nuclear matrix association of the human beta-
globin locus utilizing a novel approach to quantitative real-
time PCR. Nucleic Acids Res 2003, 31:3257-3266.