Báo cáo sinh học: "Comparative expression profiling of E. coli and S. aureus inoculated primary mammary gland cells sampled from cows with different genetic predispositions for somatic cell score" ppt
Bạn đang xem bản rút gọn của tài liệu. Xem và tải ngay bản đầy đủ của tài liệu tại đây (1.54 MB, 17 trang )
RESEARC H Open Access
Comparative expression profiling of E. coli and
S. aureus inoculated primary mammary gland
cells sampled from cows with different genetic
predispositions for somatic cell score
Bodo Brand
1
, Anja Hartmann
1
, Dirk Repsilber
2
, Bettina Griesbeck-Zilch
4
, Olga Wellnitz
5
, Christa Kühn
3
,
Siriluck Ponsuksili
1
, Heinrich HD Meyer
4
and Manfred Schwerin
1,6*
Abstract
Background: During the past ten years many quantitative trait loci (QTL) affecting mastitis incidence and mastitis
related traits like somatic cell score (SCS) were identified in cattle. However, little is known about the molecular
architecture of QTL affecting mastitis susceptibility and the underlying physiological mechanisms and genes
causing mastitis susceptibility. Here, a genome-wide expression analysis was conducted to analyze molecular
mechanisms of mastitis susceptibility that are affected by a specific QTL for SCS on Bos taurus autosome 18
(BTA18). Thereby, some first insights were sought into the genetically deter mined mechanisms of mammary gland
epithelial cells influencing the course of infection.
Methods: Primary bovine mammary gland epithelial cells (pbMEC) were sampled from the udder parenchyma of
cows selected for high and low mastitis susceptibility by applying a marker-assisted selection strategy considering
QTL and molecular marker information of a confirmed QTL for SCS in the telomer ic region of BTA18. The cells
were cultured and subsequently inoculated with heat-inactivated mastitis pathogens Escherichia coli and
Staphylococcus aureus, respectively. After 1, 6 and 24 h, the cells were harvested and analyzed using the microarray
expression chip technology to identify differences in mRNA expression profiles attributed to genetic predisposition,
inoculation and cell culture.
Results: Comparative analysis of co-expression profiles clearly showed a faster and stronger response after
pathogen challenge in pbM EC from less susceptible animals that inherited the favorable QTL allele ‘Q’ than in
pbMEC from more susceptible animals that inherited the unfavorable QTL allele ‘q’. Furthermore, the results
highlighted RELB as a functional and positional candidate gene and related non-canonical Nf-kappaB signaling as a
functional mechanism affected by the QTL. However, in both groups, inoculation resulted in up-regulation of
genes associated with the Ingenuity pathways ‘dendritic cell maturation’ and ‘acute phase response signaling’,
whereas cell culture affected biological processes involved in ‘cellular development’.
Conclusions: The results indicate that the complex expression profiling of pathogen challenged pbMEC sampled
from cows inheriting alternative QTL alleles is suitable to study genetically determined molecular mechanisms of
mastitis susceptibility in mammary epithelial cells in vitro and to highlight the most likely functional pathways and
candidate genes underlying the QTL effect.
* Correspondence:
1
Research Group of Functional Genomics, Leibniz Institute of Farm Animal
Biology, 18196 Dummerstorf, Germany
Full list of author information is available at the end of the article
Brand et al. Genetics Selection Evolution 2011, 43:24
/>Genetics
Selection
Evolution
© 2011 Brand e t al; licensee BioMed Central Ltd. This is an Open Access article distributed under the terms of the Creative Commons
Attribution License ( which permits unrestricted use, distribution, and reproduction in
any medium, provided the original work is properly cited.
Background
Mastitis or the inflammation of the mammary gland has
the highest economical impact of all productiv e diseases
in dairy cattle [1]. In addition to the economical losses
in milk production, the negative effects on animal wel-
fare as well as food-born pathogens that can cause
potential damage to human health are the main reasons
for intensive research on this topic during the last dec-
ades [2]. So far, many studie s have identified genomic
regions harboring qua ntitative trait loci (QTL) affecting
clinical mastitis or mastitis-related traits [3,4]. The num-
ber of studies investigating molecular mechanisms of
immune response to different mastitis pathogens in vivo
and in vitro in cattle is also increasi ng [5-10]. However,
the link between QTL, causal mutations affecting the
phenotypic variation in mastitis susceptibility and how
these mutations alter or affect molecular mechanisms is
still lacking for most QTL. So far, only a few studies
have investigated molecular mechanisms affected by a
QTL for udder health or related traits [11].
In a first study [12], we demonstrated the suitability of
an in vitro test system to investigate the transcriptome
of primary mammary epithelial cells. In the present
study, we conducted a genome- wide expression analysis
to analyze the molecular mechanisms of mastitis sus-
ceptibility in cattle that a re affectedbyaspecificQTL
on Bos taurus autosome 18 (BTA18). Several reports
have shown that BTA18 harbors QTL affecting clinical
mastitis or mastitis-related traits like the somatic cell
score (SCS) in the German Holstein [13-17] and other
cattle populations [18-21]. SCS, a phenotypic measure of
the number of somatic cells in milk, is often used as a
surrogate trait for udder health and has a strong genetic
correlation to mastitis in the German Holstein popula-
tion (r
g
= 0.84; [22]). One of the best confirmed QTL
affecting SCS in the German Holstein population is
locatedatthetelomericend of BTA18 (hereinafter
referred to as SCS-BTA18-QTL) [13,16,17]. Within this
region, QTL affecting udder conformation traits like
fore udder attachment and udder depth have also been
reported [23,24], traits that are known to have a sub-
stantial impact on udder health [25]. Thus, the specific
functional backgro und underl ying the SCS-BTA 18-QTL
could not be unambiguously inferred, because aside
from mechanisms of immune defense, udder conforma-
tion might also contribute to the genetic variability of
mastitis susceptibility. Additionally, the chromosomal
region enclosing the QTL confidence interval is charac-
terized by a high gene density [26]. Thus, the aim of the
present study was to obtain insights into the physiologi-
cal mechanisms underlying phenotypic variation in mas-
titis susceptibility, which mighthelpidentifymolecular
pathways and genes affecting mastitis susceptibility due
to the SCS-BTA1 8-QTL using a combined approach of
holistic gene expression profiling of primary bovine
mammary g land epithelial cells (pbMEC) sampled from
heifers that inherited alternative QTL alleles. In a pre-
vious study, prepartum primiparous heifers with a
genetic predisposition for low or high SCS after parturi-
tion [27] were selected using the molecular marker
information known for BTA18. Quantita tive Real-Ti me-
PCR ( qRT-PCR) was used to specifically investigate the
mRNA expression profiles of 10 innate immune system
key m olecules after bacterial challenge of pbMEC [12].
The first results showed that the less susceptible animals
that inherited the favorable SCS-BTA18-QTL allele ‘ Q’
(referred to as SCS-BTA18-Q animals) had a signifi-
cantly elevated mRNA expression of innate immune
response genes like TLR2, TNF-a,IL-1b,IL-6and IL-8
24 h after bacterial challenge in co mparison to the more
susceptible animals that inherited the unfavo rable SCS-
BTA18-QTL allele ‘q’ (referred to as SCS-BTA18-q ani-
mals). In the current study, we expanded the analys is to
a holistic t ranscriptome analysis using the Affymetrix
GeneChip Bov ine Genome Array to characterize global
differences in gene expression in response to pathogen
challenge in pbMEC sampledfromSCS-BTA18-Qand
SCS-BTA18-q animals. By analyzing the respective
expression data using the short time-series expression
miner STEM [28,29], co-expression profiles and signifi-
cantly affected Ingenuity canonical pathwa ys were iden-
tified providing first insights into genetically determined
molecular mechanisms affecting mastitis susceptibility
due to the SCS-BTA18-QTL.
Methods
Selection of animals
Heifers with either high or low susceptibility to mastitis
were selected from the entire German Holstein popula-
tion comprising heifers born between February and Sep-
tember 2003, that were sired for first parturition in a
time interval of six weeks between December 2004 and
February 2005. The detailed selection strategy and phe-
notypes of selected heifers are described by Kühn et al.
[27]. In brief, three sires were selected from the German
Holstein population based on the discrepancy of their
marker-assisted best linear unbiased prediction (MA-
BLUP) breeding values for SCS for their alternative hap-
lotypes in the telomeric region of BTA18. Daughters of
the three sires and their dams were genotyped at five
marker loci (BM7109, ILSTS002, BMS2639, BM2078,
TGLA227) within the telomeric region of BTA18 as
described in Xu et al. [17]. The most likely paternally
inherited marker haplotypes and thus, indirectly, the
inherited paternal QTL alleles were inferred, and eleven
heifers were selected from the pool of daughters. Six
Brand et al. Genetics Selection Evolution 2011, 43:24
/>Page 2 of 17
heifers (three heifers of sire 1, two heifers of sire 2, o ne
heifer of sire 3) were assumed to have inherited the
paternal chromosomal region decreasing SCS (SCS-
BTA18-Q) and five heifers (three heifers of sire 1 and
one heifer of each sire 2 and sire 3, respectively) were
assumed to have inherited the paternal chromosomal
region increasing SCS (SCS-BTA18-q). Dams and dam
sires of the heifers were preselected for high (low sus-
ceptible heifers) and low relative estimated breeding
values (high susceptible heifers) to increase the probabil-
ity that the heifers inherited also the corresponding
SCS-BTA18-QTL allele from the dams.
All 11 heifers were born and raised on different ordin-
ary dairy farms. The heifers were co llected at the Leib-
niz Institute for Farm Animal Biology Dummerstorf
(FBN), in August 2005 at least 12 weeks prior to calving.
They were kept in a f ree stall barn in one group under
identical environmental c onditions regarding housing,
feeding and milking regime. The husbandry conditions
were in accordance with national guidelines for animal
experiments and standard dairy farm practice without
any intervention in the living animal. The experimental
approach was appro ved by an institutional committee.
All individuals were slaughtered according to protocols
for certified European slaughterhouses under the federal
control of an independent veterinarian. The somatic cell
count of the experimental and non-experimental c ows
in the dairy herd at the FBN was routinely below
100,000 cells/mL indicating a high management level of
udder health. At day 42 postpartum, the indi viduals
were slaughtered and a post mortem investigation of the
udder and the carcass was performed. All heifers had no
clinical mastitis and milk samples did not give indication
of bacterial infection at slaughter.
Primary cell culture of mammary epithelial cells
Primary cell cultures from the mammary gland epithe-
lium were established as described by Griesbeck-Zilich
et al. [12]. Immediately after slaughter of the selected
heifers, two samples were taken aseptically from the par-
enchyma of the left rear quarter of the udder. The sam-
ples were transferred into Hank’s balanced salt solution
supplemented with antibiotics (HBSS; Sigma-Aldrich,
Munich, Germany), and the tissue was minced and
blood as well as milk residues were flushed away. There-
after, the cells were transferred to a digestion mix of 200
mL HBSS supplemented with antibiotics, 0.5 mg/mL
collagenase IA, 0.4 mg/mL DNase type I and 0.5 mg/mL
hyaluronidase (enzymes from Sigma-Aldrich, Munic h,
Germany). After incubation, the cells were separated
from connective tissue and non-epithelial cell conglom-
erates by filtration and centrifugation. Cells were then
resuspended in Dulbecco’ s modified Eagle’ smedium
nutrient mixture F-12 Ham (DMEM/F12, Sigma-
Aldrich, Munich, Germany) containing 10% FBS and
10 μl/mL IT S (0.5 mg/ml bovine insulin, 0.5 mg/mL
apo-transferrin, 0.5 μg/mL sod ium selenite; Sigma-
Aldrich, Munich, Germany). The cells were incubated
for 40 min (37°C, 5% CO
2
,and90%humidity)until
the fibroblasts had attached and epithelial cells could
be isolated by decanting. The cells were cryopreserved
at -80°C in 1 mL freezing medium containing DMEM/
F12, 20% FBS, and 10% DMSO. In order to verify the
epithelial origin of the cells, a n immunocytochemical
staining of cytoceratins characterizing this cell type
was conducted randomly as described [ 30]. The predo-
minant cell type was represented by epi thelial cells
(approximately 90 to 95%).
Treatment of epithelial cells with mastitis pathogens
Pathogen challenge and cell culture were performed
essentially as described by Griesbeck-Zilch et al. [12].
Heat-inactivated S. aureus M60 and E. coli isolates
derived from bovine milk samples of mastitis affected
udders were used for inoculation [31]. E pithelial cells
were thawed and cultured (37°C, 5% CO
2
, and 90%
humidity) in DMEM/F12 medium for two further pas-
sages. For pathogen challenge, they were seeded in three
six-well tissue culture plates (Greiner bio-one, Fricken-
hausen, Germany), one plate for each animal and each
time point (1, 6 and 24 h), at a concentration of 300,000
cells/well. Two wells in each plate were prepared for
control and one for each S. aureus and E. coli treatment.
At a confluence of about 70% on the second day after
seeding, the medium was refreshed. According to Well-
nitz et al. [31], 100 μL of bacterial-solution representing
a multiplicity of infection of 10, was added. 100 μLPBS
were used as control t reatment for the un-inoculated
control cells.
RNA extraction and microarray hybridization
Cells were harvested 1, 6, and 24 h after pathogen chal-
lenge, and total RNA was extra cted with the TriFast
reagent as described in the manufacturer’ sprotocol
(PEQLAB Biotechnology GmbH, Erlangen, Germany).
After DNaseI t reatment, RNA was removed using the
RNea sy Kit (Qiagen, Hilden, Germany ). RNA was quan-
tified using a NanoDrop ND-1000 spectrophotometer
(NanoDrop, PEQLAB Biotechno logy GmbH, Erlangen,
Germany) and its integrity was checked by running 1 μg
of RNA on a 1% agarose gel. Comparative expression
profiling was performed using the GeneChip Bovine
Genome Arrays (Affymetrix, St. Clara, USA) comprising
24,072 probe sets representing approximately 19,000
UniGene clusters. Acc ording to the recommendations
for microarray hybridization (Affymetrix, St. Clara,
USA), antisense biotinylated RNA was prepared with 2
μg of tot al RNA using the GeneChip 3’IVT Express kit
Brand et al. Genetics Selection Evolution 2011, 43:24
/>Page 3 of 17
(Affymetrix, St. Clara, USA). After hybridization, arrays
were scanned using the GeneChip scann er 3000 (Affy-
metrix, St. Clara, USA). The quality of hybridization was
assessed in all samples following the manufacturer’ s
recommendations using Affymetrix Expression Console
version 1.1 ( Affymetrix, St. Clara, USA). Additionally,
the R-statistical language (distribution 2.9.2) and the affy
(version 1.22.1) and affyPlm (version 1.20.0) packages
from the Bioconductor microarray suit [32] were used
for supplemental quality control. A complete l ist of all
arrays included in the analyses is given in Table 1. After
quality control, nine chips of the SCS-BTA18-q group
and two chips of the SCS-BTA18-Q group were
removed, because of higher centered and larger spread
boxes in NUSE (Normalized Unscaled Standard Error)
plots and an elevated RNA degradat ion indicated by the
5’ to 3’ ratio of GAPDH-RNA. Due to lack of biological
material, these chips could not be repeated. The micro-
array data are deposited at G ene Expression Omnibus
database [33] (GEO: GSE24560).
Microarray preprocessing
The R statistical language (distribution 2.9.2) was used
for data preprocessing. Microarray raw data were pre-
processed using the RMA algorithm [34] for background
correction, normali zation by quantile normalization and
summary measures by me dian polish. The data were fil-
tered for absent genes by applying the MAS5 algo rithm
implemented in the Bioconductor affy package (version
1.22.1) for detection of present calls. Thereafter, Affyme-
trix control probe sets were removed from the datasets.
Annotations of the Affymetrix identifiers to human gene
symbols are based on Hintermair [35] supplemented
with additional information obtained from the NetAffx
annotation provided by Affymetrix.
Statistical analysis and bioinformatics
After preprocessing of the microarray raw data, t he Bio-
Conductor package Limma (version 2.18.3) [36] was
used to identify differentially expressed genes. Limma
applies an empirical Bayes approach based on linear
models to assess the probability of differentially
expressed genes. In this study, a three factorial design
considering genotype, treatment and time point as fac-
tors was analyzed. A variety of tests was performed to
confirm the effects of the QTL allele on cell culture and
inoculation and to survey the consistency between ana-
lyses that could have been affected by the low number
of chips within and the difference in the number of
chips between groups. Analysis 1 was performed to
compare gene expression levels between time points
separately for each combination of factors treatment
(S.aureus,E.coliand control) and genotype (SCS-
BTA18-q and SCS-BTA18-Q).Analysis2wasusedto
investigate differences in gene expression levels at time
points between inoculated and control cells separately
for each combination of factors genotype (SCS-BTA18-q
and SCS-BTA18-Q) and pathogen (S. aureus and E.
coli). Analysis 3 was performed to investigate differences
in gene expression levels between time points for each
fol d change obtained between inoculated cells and con-
trol cells at time points (Analysis 2) separately for each
combination of factors genotype (SCS-BTA18-q and
SCS-BTA18-Q) and pathogen (S. aureus and E. coli),
respectively. All investigated comparisons are listed in
Table 2.
Due to the low number of samples within groups and
the difference in the number of samples between
groups , a de creased power of the statistical analyses was
expected. This problem is evident mainly in Analysis 3,
because of the high number of tests in addition to the
moderate number of factors and low numbers of sam-
ples. Analysis 3 was focused on the analysis of genes
predominantly affected by pathogen challenge. There-
fore, only genes with a minimum expression change of
log
2
fc ≥ 0.75 during time-course were considered. A
fold change threshold was applied in order to include in
the co-expression analysis, only the genes, showing
Table 1 Summary of microarrays included in the analysis
SCS-BTA18-QTL
allele
Control E. coli S. aureus
1
h
6
h
24
h
1
h
6
h
24
h
1
h
6
h
24
h
Q 656665666
q 334554444
Number of microarrays passing the quality control for each time point, each
treatment ( E. coli, S. aureus a nd control treatment) and each of the inherited
SCS-BTA18-QTL alleles (SCS-BTA18-Q, SCS-BTA18-q).
Table 2 Comparisons performed using Limma
Analyses Comparison Factors
Analysis 1 24 h - 1 h treatment X genotype
24 h - 6 h
6h-1h
Analysis 2 inoculated - control 24 h pathogen X genotype
inoculated - control 6 h
inoculated - control 1 h
Analysis 3 (inoculated - control 24 h) -
(inoculated - control 1 h)
pathogen X genotype
(inoculated - control 24 h) -
(inoculated - control 6 h)
(inoculated - control 6 h) -
(inoculated - control 1 h)
Summary of comparisons made in each of the three analyses; all analyses
were performed separately for each combination of factors: genotype (SCS-
BTA18-Q, SCS-BTA18-q) and treatment (E. coli, S. aureus and control treatment)
in Analysis 1 or genotype (SCS-BTA18-Q, SCS-BTA18-q) and pathogen (E. coli,
S. aureus) in Anal ysis 2 and Analysis 3.
Brand et al. Genetics Selection Evolution 2011, 43:24
/>Page 4 of 17
elevated expression changes during time-course. With
the log
2
fc ≥ 0.75 a moderate fold change filter was
applied [37]. The significance of co-expression was then
assessed by applying the clustering algorithm implemen-
ted in the short time-series expression miner STEM
(version 1.3.6) [28,29] for co-expression profiling and a
subsequent comparison of the number of genes assigned
to a specific co-expression profile model to the expected
number of genes assigned to the co-expression profile
model quantified by permutation. Because no expression
profiling w as performed at time point zero and control
cells and inoculated cells derived from the same cell cul-
ture, n o differences regarding gene expression between
the inoculated and control cells were expected at time
point zero. Hence, the ‘no normalization/add 0’ option
was selected in STEM in Analysis 3 and all expression
values at time point zero were set to zero to enable the
co-expression profiling to include changes in gene
expression levels in the first hour after bacterial chal-
lenge. The STEM clustering method [28] was chosen,
and the maximum number of profiles was set to the
default value of 50 considering a maximum uni t change
of 2 between profiles.
Contrary to Analysis 3, in Analysis 1 and Analysis 2
the moderated t-test statistics implemented in Limma
considering a stringent significance threshold of an FDR
adjusted p-value of q ≤ 0.05 were applied. Additionally,
a fold change criterion was not applied in these analyses
to monitor all significant expression changes due to cell
culture or inoculation. For the biological interpretation
of the data, significantly differentially (Analysis 1 and
Analysis 2) and co-expressed ( Analysis 3) genes were
further analyzed using the Ingenuity Pathway Analysis
8.8 [38]. In addition, to compare and visualize gene
expression levels, the hierarchical clustering method
implemented in the MeV MultiExperiment Viewer v4.4
[39,40] was used.
Results
Effects of cell culture on gene expression in primary
bovine mammary gland epithelial cells between cell
culture time points of 1, 6 and 24 h
To investigate the infl uence of cell culture on pbMEC
sampled from SCS-BTA18-Q and SCS-BTA18-q ani-
mals, the differences in mRNA expression levels of
control cells between time points 1, 6 and 24 h were
analyzed separately for each SCS-BTA18-QTL allele
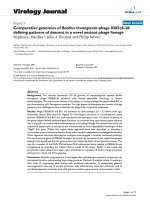
(Figure 1). A first analysis of differentially expresse d
genes using the Ingenuity Pathway Analysis indicated
that cellular and molecular processes affecting ‘ cell
cycle’ and ‘ cellular development’ are regulated in
response to cultivation after 24 h and that there is a
difference in the response to cell culture between SCS-
BTA18-Q and SCS-BTA18-q cells. Between time
points 1 and 24 h, both, the cells derived from SCS-
BTA18-QanimalsandthecellsderivedfromSCS-
BTA18-q animals, showed substantial cha nges in gene
expression. Whereas 293 genes were differentially
expressed in SCS-BTA18-Q cells, only 28 genes were
differentially expressed in the corresponding SCS-
BTA18-q cells [see Additional file 1]. The difference in
the number of differentially expressed genes between
the two groups is partially related to the lower number
of samples in the corresponding SCS-BTA18-q group
(10 samples) compared to the SC S-BTA18-Q group
(17 samples) affecting the power of the statistical ana-
lyses. However, only about 50% of the genes (14 genes)
differentially expressed in the SCS-BTA18-q group
were also found to be differentially expressed in t he
SCS-BTA18-Q group. Five of the six genes that were
up-regulated towards time point 24 h (LINS1, FBXL20,
IRF2BP2, PHF13, DSEL) and three of the top ten
down-regulated genes (NOL6,PDIA4,NEDD9)inthe
SCS-BTA18-q cells showed the same direction of sig-
nificant changes in expression levels in the SCS-
BTA18-Q cells. Accordance in genes’ regulation and
differences in the genes regulated between SCS-
BTA18-Q and SCS-BTA18-q cells suggested that com-
mon mechanisms were affected by cell culture but also
that unique mechanisms were affected by the genotype.
A subsequent functional analysis of the significantly
differentially expressed genes associated with molecular
and cellular functions related to ‘ cell cycle’ , ‘cell ular
development’ and ‘cellular assembly and organization’
was performed. In the SCS-BTA18-Q group, genes
mainly associated with molecular and cellular functions
affecting ‘ cell cycle progression’ (C15ORF63, FGF2,
NEDD9, NOLC1, NRG1, PES1, PRMT5, RA N, SESN1,
TBRG4), ‘rRNA processing’ (GEMIN4,NOLC1,NOP56,
WDR43)andthe‘ activation of gene expression’
SCS-BTA18-Q
SCS-BTA18-q
A
uninoculated cells
Control
0
50
100
150
200
250
300
350
400
450
500
total up down total up down total up down
6
h-1h 24h-
6
h
24h
-
1h
Figure 1 Differentially expressed genes between time points 1,
6 and 24 h of cell culture. Number of differentially genes (FDR
adjusted p-value q ≤ 0.05) between time points 1, 6 and 24 h of
cell culture for each of the inherited SCS-BTA18-QTL alleles,
respectively.
Brand et al. Genetics Selection Evolution 2011, 43:24
/>Page 5 of 17
(NEDD9, FGF2, NRG1, SMAD4) were differentially
expressed after 24 h of cell culture (Table 3). Although
the number of genes in the SCS-BTA18-q group was
low compared to the SCS-BTA18-Q group, single
genes indicated that, at least in part the same molecu-
lar and cellular functions were affected in the SCS-
BTA18-q group (Table 3). After 24 h of cell culture,
genes associated with molecular and cellular functions
involved in the ‘ regulation of the cell cycle’ ( LMNA,
NEDD9), in the ‘ regulation of gene expression’
(NEDD9, MCRS1)andin‘rRNA processing’ (GEMIN4)
were differentially expressed. Unique to the SCS-
BTA18-q group was the decreased expression of
LMNA and FSCN1 after 24 h of cell culture. Both
genes are involved in several molecular and cellular
functions including the ‘ organization of the actin
cytoskeleton’ and the ‘differentiation and proliferation
of epithelial cell lines’ (FS CN1)aswellasthe‘nuclear
assembly’,the‘chromatin organization’ and ‘apoptosis
signaling’ (LMNA). Unique to SCS-BTA18-Q cells, was
the differential expression of ge nes affecting molecular
and cellular functions associated w ith ‘small molecule
biochemistry’, ‘ nucleic acid metabolism’ and ‘carbohy-
drate metabolism’. In these cells, the down-regulation
between time point 1 h and 24 h of ERCC6, POLR2D,
RAD23B, genes that are involved in the nucleotide
excision repair pathway, of RN A polymerase polypep-
tides POLR1A, POLR1E, POLR2D, POLR3B and
POLR3D, genes that are involved in the pyrimidine
and purine metabolisms, as well as the down-regula-
tion of GPI and TPI1 that are involved in glycolysis
and gluconeogenesis affirmed that the processes
affected after 24 h of cell culture are mainly those
important for cellular homeostasis.
Effect of inoculation with heat inactivated S. aureus and
E. coli pathogens on gene expression in primary bovine
mammary gland cells between and at time points 1, 6
and 24 h of inoculation
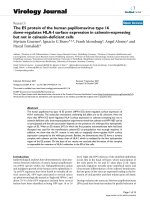
Inoculation with either pathogen significantly affected
gene expression in both SCS-BTA18-QTL groups. The
most significant changes were observed when consider-
ing the whole time period between 1 h and 24 h of
inoculation and the gene expression at time point 24 h
between inoculated and control cells (Figure 2). Between
time points 1 h and 24 h, E. coli inoculated cells showed
a s ignificantly higher number of differentially expressed
genes (SCS-BTA18-Q: 1010 genes and SCS-BTA18-q:
1393 genes) in comparison t o S. aureus inoculated cells
(SCS-BTA18 -Q: 3 12 gen es a nd SCS -BTA18-q: four
genes). Similarly, at time point 24 h, 402 and 43 genes
were differentially expressed between E. coli and S. aur-
eus inoculated cells and their respective un-inoculated
control cells in the SCS-BTA18-Q group and 107 and
five genes in the SCS-BTA18-q group, respectively. In
comparison, the number of differentially expressed
genes in inoculated cells between time points was higher
than between inoculated and control cells at given time
points suggesting that when analyzing between time
points, a large proportion of the differentially expressed
genes were affected by cell culture or by cumulative
effects of cell culture and inoculation.
These observations are supported by the identified
functional categories associated with the differentially
expressed genes using Ingenuity Pathway Analysis. At
time po int 24 h, inoculated cells in co mparison to con-
trol cells exhibited predominantly differentially
expressed genes that were involved in molecular and
cellular functions comprising ‘ hematological system
Table 3 Molecular and cellular functions affected by cell culture
Top 5 categories of molecular and cellular functions SCS-BTA18-Q SCS-BTA18-q
Control cells SCS-BTA18-Q p-values Genes p-values Genes
Cell cycle 1,98E-04 25 1,19E-02 2
Small molecule biochemistry 2,56E-04 19 ——
Cellular development 7,60E-04 10 2,66E-03 1
Nucleic acid metabolism 7,60E-04 6 ——
Carbohydrate metabolism 1,50E-03 9 ——
Top 5 categories of molecular and cellular functions SCS-BTA18-Q SCS-BTA18-q
Control cells SCS-BTA18-q p-values Genes p-values Genes
Cellular assembly and organization 1,28E-02 12 1,33E-03 2
Cellular function and maintenance 1,60E-02 6 1,33E-03 1
Cellular development 7,60E-04 10 2,66E-03 1
Cell morphology 2,48E-03 9 3,99E-03 1
Gene expression 3,68E-03 8 7,96E-03 2
Top five molecular and cellular functions affected in control cells after 24 h of cultivation; the molecular and cellular functional category and p-values as well as
the number of involved genes are shown for SCS-BTA18-Q and SCS-BTA18-q cells.
Brand et al. Genetics Selection Evolution 2011, 43:24
/>Page 6 of 17
development’, ‘inflammatory response’ , ‘cell to cell sig-
naling’ and ‘immune cell trafficking’ (Table 4). These
genes were exclusively regulated in inoculated cells but
not in control cells during time-course (Figure 3). In
addition, differentially expressed genes between time
points 1 h and 24 h in both inoculated and control cells
were significantly associated with mo lecula r and cellular
functions comprising ‘cell cycle’ , ‘ cellular growth and
proliferation’ , ‘DNA replication, recombination and
repair’ and ‘cell death’ (Table 5). However, these differ-
ences were more pronounced in inoculated cells in
comparison to the control cells. Furthermore, the num-
ber of genes assigned to each of the top five molecular
and cellular function categories between time points 1 h
and 24 h was higher in E. coli inoculated cells compared
to S. aureus inoculated and control cells. These results
indicated that cellular processes important for cellular
homeostasis are more seri ously affected by inocu lation
with E. coli than with S. aureus.
However, S. aureus inoculation resulted in an elevated
number of differen tially expressed genes assigned to the
functional categories ‘cell death’ and ‘ DNA replication,
recombination and repair’ in SCS-BTA18-Q cells
betweentimepoints1hand24hincomparisonto
control cells indicating that S. aureus inoculation
affected processes important for cellular homeostasi s
more seriously than cell culture. This analysis was done
on SCS-BTA18-Q cells only, because the number of sig-
nificantly differentially expressed genes was too low in
S. aureus i noculated SCS-BTA18-q cells to perform a
reliable investigation of associated molecular and cellular
functions.
Nevertheless, the observed effects of cell culture and
pathogen challenge on gene expression in pbMEC
clearly indicate the suitability o f the established in vitro
system to study the cellular and molecular response to
effects of endogenous and exogenous factors like effects
of the SCS-BTA18-QTL alleles.
Effects of SCS-BTA18-QTL alleles on the response to
pathogen challenge: co-expression profiling and
Ingenuity Pathway analysis
To study the effects of SCS-BTA18-QTL alleles on the
response to pathogen challenge, the non-r andom co-
100
300
500
700
900
1100
1300
1500
total up down total up down total up down
6h-1h 24h-6h 24h-1h
0
50
100
150
200
250
300
350
400
450
500
total up down total up down total up down
6h-1h 24h-6h 24h-1h
0
50
100
150
200
250
300
350
400
450
500
total up down total up down total up down
1h
6
h24h
0
50
100
150
200
250
300
350
400
450
500
total up down total up down total up down
1h 6h 24h
C
D
SCS-BTA18-Q
SCS-BTA18-q
A
Escherichia coli
inoculated cells
Staphylococcus aureus
inoculated cells
B
Staphylococcus aureus
inoculated cells versus control
Escherichia coli
inoculated cells versus control
Figure 2 Differentially expressed genes between and at time points 1, 6 and 24 h of bacterial cha llenge. Number o f differentia lly
expressed genes (FDR adjusted p-value q ≤ 0.05) between time points, for each pathogen challenge and each of the inherited SCS-BTA18-QTL
alleles as well as between inoculated cells and control cells at time points for each pathogen challenge and each of the inherited SCS-BTA18-
QTL alleles; A E. coli inoculated cells; B S. aureus inoculated cells; C E. coli inoculated cells versus control; D S. aureus inoculated cells versus
control.
Brand et al. Genetics Selection Evolution 2011, 43:24
/>Page 7 of 17
expression of genes was assessed by applying a permuta-
tion test to overcome the difficulty in assessing an
appropriate significance level enabling an unbiased com-
parison between SCS-BTA18-Q and SCS-BTA18-q cells.
The co-expression profiles that were significantly
enriched for genes showing a similar expression profile
during time-course are shown in Figure 4. A table of
genes including log fold changes for significantly
enriched profiles is given in additional file 2 [see Addi-
tional file 2]. Most of the 14 different significant profiles
(10 profiles) indicated an up-reg ulation of genes towards
time point 24 h. Remark ably, all of the profil es up-regu-
lated after 24 h in SCS-BTA18-Q cells showed an early
and linear up-regulation of co-expressed genes, whereas
all profiles in SCS-BTA18-q cells inoculated with S. aur-
eus and in part in t hose with E. coli (profiles 25 and 33)
showed a delayed up-regulation of genes after 6 h of
inoculation (Figure 4). These different expression pro-
files are characterized by genes mainly associated with
the functional categories ‘cell death’ (ADM, AGR2,
BIRC3, BNIP3, CASP3, CASP4, CCL5, DDX58, DUSP1,
FLI1, IER3, IFI16, LMO2, NFKBIA, NOS2, PTGS2,
STK38, USP18), ‘ complement system’ (C1R, C1S and
CFH)and‘ chemotaxis of neutrophils’ (CCL5 and
CXCL2).
To obtain a more detailed view of pathways affected
by the SCS-B TA18-QTL alleles, all of the significantly
co-expressed genes were included in the Ingenuity Path-
way Analysis for a biological interpretation of the data.
In a first step, Ingenuity canonical pathways were inves-
tigated. An overview of significantly affected canonical
pathways is given in Figure 5. Comparing canonical
pathways affected in SCS-BTA18-Q and SCS-BTA18-q
cells as well as in E. coli and S. aureus inoculated cells
indicated that most of the significant canonical pathways
were affected in both SCS-BTA18-QTL groups. How-
ever, the different ranks of canonical pathways based on
p-values and the number of co-regulated genes within
pathways between SCS-BTA18-Q and SCS-BTA18-q
cells indicated that there are pathogen-specific differ-
ences in the response to inoculation between both SCS-
BTA18-QTL alleles. In SCS-BTA18-q cells, the most
significantly affected canonical pathways were ‘commu-
nication between innate and adaptive immune cells’ as
Table 4 Biological functions affected by inoculation solely
E. coli S. aureus
Top 5 categories of biological functions SCS-BTA18-Q SCS-BTA18-q SCS-BTA18-Q
E. coli versus control SCS-BTA18-Q p-values Genes p-values Genes p-values Genes
Cell death 1,08E-13 96 8,30E-05 18 5,00E-05 14
Cell-to-cell signaling and interaction 3,60E-13 51 5,35E-03 12 2,45E-04 7
Hematological system development and function 3,60E-13 53 7,87E-05 14 8,09E-05 8
Immune cell trafficking 3,60E-13 34 8,62E-04 7 8,09E-05 5
Tissue development 3,60E-13 38 6,51E-03 5 3,49E-03 4
E. coli S. aureus
Top 5 categories of biological functions SCS-BTA18-Q SCS-BTA18-q SCS-BTA18-Q
E. coli versus control SCS-BTA18-q p-values Genes p-values Genes p-values Genes
Hematological system development and function 3,60E-13 53 7,87E-05 14 8,09E-05 8
Hematopoesis 8,87E-07 27 7,87E-05 9 1,03E-04 5
Cell death 1,08E-13 96 8,30E-05 18 5,00E-05 14
Cellular development 1,67E-07 56 9,58E-05 11 1,52E-05 9
Gene expression 3,39E-11 81 1,25E-04 10 1,11E-03 10
E. coli S. aureus
Top 5 categories of biological functions SCS-BTA18-Q SCS-BTA18-q SCS-BTA18-Q
S. aureus versus control SCS-BTA18-Q p-values Genes p-values Genes p-values Genes
Inflammatory response 4,38E-11 51 3,63E-03 11 8,30E-06 7
Cellular development 1,67E-07 56 9,58E-05 11 1,52E-05 9
Cellular growth and proliferation 9,89E-12 112 5,35E-03 18 1,52E-05 15
Tissue morphology 5,40E-05 13 6,51E-03 2 4,12E-05 3
Cell death 1,08E-13 96 8,30E-05 18 5,00E-05 15
Top 5 biological functions affected between inoculated SCS-BTA18-Q and SCS-BTA18-q cells and respective control cells; the functional category, p-values and
the number of genes are shown for E. coli inoculated SCS-BTA18-Q and SCS-BTA18-q cells and S. aureus inoculated SCS-BTA18-Q cells; the categories are ranked
by p-values of the SCS-BTA18-Q and SCS-BTA18-q cells, respectively and related p-values and the number of involved genes are shown for the alternative QTL
allele and pathogen; for S. aureus inoculated SCS-BTA18-q cells the number of significantly differentially expressed genes was to low to perform a reliable
investigation of associated molecular and cellular functions.
Brand et al. Genetics Selection Evolution 2011, 43:24
/>Page 8 of 17
well as ‘acute phase response signaling’, whereas in SCS-
BTA18-Q cells ‘dentritic cell maturation’ and ‘ TWEAK
signaling’ were predomin antly affected. ‘Dentritic cell
maturation’ and ‘acute phase response signaling’ we re
two of the most signi ficantly affected pathways for both
SCS-BTA18-QTL allele s and both pathogen challenges.
However, E. coli inoculated SCS-BTA18-Q cells showed
a s ignificantly higher number of differentially expressed
genes i n comparison to SCS-BTA18-q cells and both S.
aureus inoculated cells (Table 6). The most prominent
genes associated with ‘ dendritic cell maturation’
belonged to the major histocompatibility complex class
2 molecules namely HLA-DMA, HLA-DMB, HLA-
DQA1, HLA-DQB1, HLA-DRA and HLA-DRB1,togenes
involved in NF-kappaB signaling, namely NFKB1,
NFKB2, NFKBIA, NFKBIB, NFKBIE, IKBKE and RELB
and to the Interleukin 1 cyto kine family members,
namely IL1A, IL1B, IL1F6 and IL1RN. Genes like CD40,
NFKBIA, NFKBIZ, IKBKE, TLR2, I L1A and IL1B that
are also involved in ‘dendritic cell maturation’ showed
an earlier and superior pathogen specific up-regulation
in SCS-BTA18-Q cells in comparison to the SCS-
BTA18-q cells. In contrast, genes of the ‘acute phase
response signaling’ pathway such as SAA3P, IL6 and
NFKB2 showed an earlier and higher up-re gulation after
inoculation with both pathogens in SCS-BTA18-Q cells
in comparison to SCS-BTA18-q cells (Figure 4, profiles
40 and 42).
In addition, we investigated genes that are involved in
the ‘migration of leukocytes’ associated with the physio-
logical system development and function category
‘immune cell trafficking’, which was significantly regu-
lated by both pathogen challenges and SCS-BTA18-QTL
alleles (Table 4). This was done, because genes involved
in leukocyte migration could have a large effect on
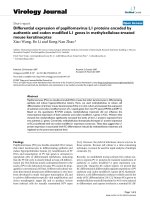
pathogen clearance and on SCS. Here, we applied the
hierarchical clustering method implemented in th e MeV
MultiExperiment Viewer v4.4 [39,40] to compare a nd
visualize gene expression between SCS-BTA18-Q and
SCS-BTA18-q cells after pathogen challenge (Figure 6).
In both challenges, SCS-BTA18-Q cells showed a faster
response in comparison to SCS-BTA18-q cells. Thus,
aft er inoculation with both pathogens cytoki nes showed
an earlier and faster up-regulation towards time point
co-
expressio
n
control
1h to 24h 24h
SCS-BTA18-qE. coli
B
co-
expressio
n
control
1h to 24h 24h
SCS-BTA18-qS. aureus
D
co-
expression
control
1h to 24h 24h
SCS-BTA18-QS. aureus
C
co-
expression
control
1h to 24h 24h
SCS-BTA18-QE. coli
A
Figure 3 Four-Set Venn diagrams comparing differentially expressed genes between analyses. Comparison between significantly co-
expressed genes at time point 24 h and significantly differentially expressed genes in control cells between time points 1 h and 24 h, in
inoculated cells between time points 1 h and 24 h as well as between inoculated cells and control cells at time point 24 h for each pathogen
and each QTL allele, respectively; A SCS-BTA18-Q cells inoculated with E. coli; B SCS-BTA18-q cells inoculated with E. coli; C SCS-BTA18-Q cells
inoculated with S. aureus; D SCS-BTA18-q cells inoculated with S. aureus.
Brand et al. Genetics Selection Evolution 2011, 43:24
/>Page 9 of 17
Table 5 Molecular and cellular functions affected by inoculation and cell culture
E. coli inoculated Un-inoculated control
Top 5 categories of molecular and cellular functions SCS-BTA18-Q SCS-BTA18-q SCS-BTA18-Q SCS-BTA18-q
E. coli inoculated
SCS-BTA18-Q cells
p-values Genes p-values Genes p-values Genes p-values Genes
Cell cycle 2,98E-18 120 2,26E-25 164 1,98E-04 25 1,19E-02 2
Cellular growth and proliferation 1,10E-10 215 2,56E-11 279 1,28E-02 10 3,28E-02 2
Cellular assembly and organization 9,30E-10 59 2,14E-10 70 1,28E-02 12 1,33E-03 2
DNA replication, recombination and repair 9,30E-10 96 2,14E-10 154 3,18E-02 5 ——
RNA-post-transcriptional modification 3,70E-06 39 9,50E-06 42 1,58E-03 11 4,56E-02 1
E. coli inoculated Un-inoculated control
Top 5 categories of molecular and cellular functions SCS-BTA18-Q SCS-BTA18-q SCS-BTA18-Q SCS-BTA18-q
E. coli inoculated
SCS-BTA18-q cells
p-values Genes p-values Genes p-values Genes p-values Genes
Cell cycle 2,98E-18 120 2,26E-25 164 1,98E-04 25 1,19E-02 2
Cellular growth and proliferation 1,10E-10 215 2,56E-11 279 1,28E-02 10 3,28E-02 2
Cellular assembly and organization 9,30E-10 59 2,14E-10 70 1,28E-02 12 1,33E-03 2
DNA replication, recombination and repair 9,30E-10 96 2,14E-10 154 3,18E-02 5 ——
Cell death 7,33E-06 153 2,27E-10 227 6,73E-03 8 ——
S. aureus inoculated E. coli inoculated Un-inoculated control
Top 5 categories of molecular and cellular functions SCS-BTA18-Q SCS-BTA18-Q SCS-BTA18-q SCS-BTA18-Q
S. aureus inoculated
SCS-BTA18-Q cells
p-values Genes p-values Genes p-values Genes p-values Genes
Cellular assembly and organization 6,54E-05 14 9,30E-10 59 2,14E-10 70 1,28E-02 12
Cell death 2,03E-04 33 7,33E-06 153 2,27E-10 227 6,73E-03 8
DNA replication, recombination and repair 2,61E-04 20 9,30E-10 96 2,14E-10 154 3,18E-02 5
Nucleic acid metabolism 2,61E-04 9 3,54E-03 4 4,61E-03 14 7,60E-04 6
Small molecule biochemistry 2,61E-04 18 7,60E-05 53 3,80E-03 26 2,56E-04 19
Top five molecular and cellular functions affected between time poin ts 1 h and 24 h in SCS-BTA18-Q and SCS-BTA18-q cells by inoculation; the molecular and
cellular functional catego ry, p-values and the number of involved genes are shown for E. coli inoculated SCS-BTA18-Q and SCS-BTA18-q cells and S. aureus
inoculated SCS-BTA18-Q cells, as well as for the control cells; the categories are ranked by p-values of the SCS-BTA18-Q and SCS-BT A18-q cells, respectively, and
related p-values and the number of involved genes are shown for the alternative QTL allele and the un-inoculated control cells; for S. aureus inoculated SCS-
BTA18-q cells the number of significantly differentially expressed genes was to low to perform a reliable investigation of associated molecular and cellular
functions; hence, for SCS-BTA18-Q cells additionally the related p-values and the number of involved genes are shown for E. coli inoculated cells and for un-
inoculated SCS-BTA18-Q control cells.
E. coli -Q
E. coli -q
S. aureus -Q
S. aureus -q
Figure 4 Significan t co-expression profiles. Significantly enriched co-expression profiles clustered by the short time-series expression miner
(STEM); profiles are ordered based on the p-value significance of the number of genes assigned to the co-expression profile versus the number
of genes expected quantified by permutation; only significantly enriched profiles are shown; each square represents one probe level model; the
line within the square represents the changes in the expression level during time-course between inoculated and control cells; in the upper left
corner the number of the profile and in the lower left corner the number of assigned genes are shown; colors indicate similar profiles within
each analysis.
Brand et al. Genetics Selection Evolution 2011, 43:24
/>Page 10 of 17
Figure 5 Overview c anonical pathways. Ingenuity canonical pathways affected during time-course between inoculated and control cells in
SCS-BTA18-Q and SCS-BTA18-q cells inoculated with E. coli and S. aureus, respectively; blue bars indicate p-value significance and the orange
threshold line indicates the p ≤ 0.05 significance thresholds; orange squares and lines indicate the ratio of genes found to be involved in the
specific pathway to the overall number of genes involved in that pathway.
Table 6 Gene table canonical pathways
QTL allele Pathogen Canonical pathway Genes
SCS-BTA18-Q E.coli Dendritic cell
maturation
HLA-DMA, IL1A, ICAM1, RELB, NFKBIE, IL1F6, HLA-DQA1, HLA-DRB1, LTB, HLA-DMB, IKBKE, IL6, NFKB2,
NFKB1, TLR2, HLA-DQB1, NFKBIA, HLA-A, CD40, IL1RN, HLA-DRA, COL10A1, IL1B, NFKBIB
Acute phase
response signaling
IL1A, SAA3P, APOA1, RRAS, NFKBIE, C1S, IL1F6, IKBKE, IL6, NFKB2, NFKB1, HMOX2, C1R, SOD2,
NFKBIA, IL1RN, CFB, IL1B, NFKBIB
SCS-BTA18-q E.coli Dendritic cell
maturation
HLA-DMA, IL1A, ICAM1, NFKBIE, IL1F6, HLA-DRB1, LTB, IKBKE, HLA-DMB, IL6, NFKB2, NFKB1, TLR2,
HLA-DQB1, NFKBIA, HLA-A, CD40, IL1RN, HLA-DRA, IL1B
Acute phase
response signaling
IL1A, SAA3P, C3, NFKBIE, C1S, SOCS2, IL1F6, IKBKE, IL6, NFKB2, NFKB1, HMOX2, C1R, HMOX1, SOD2,
NFKBIA, IL1RN, CFB, IL1B, C2
SCS-BTA18-Q S. aureus Dendritic cell
maturation
IL1A, ICAM1, RELB, NFKBIE, HLA-DQA1, PIK3R5, HLA-DRB1, LTB, IKBKE, IL6, NFKB2, NFKB1, TLR2, HLA-
DQB1, NFKBIA, CD40, IL1RN, HLA-DRA, IL1B
Acute phase
response signaling
SOCS1, IL1A, SAA3P, APOA1, NFKBIE, IKBKE, NFKB2, IL6, NFKB1, HMOX2, NFKBIA, SOD2, IL1RN, CFB,
IL1B
SCS-BTA18-q S. aureus Acute phase
response signaling
C1R, HMOX1, IL1A, NFKBIA, C1S, IL1F6, IL6, FGG, CRABP1
Dendritic cell
maturation
HLA-DQB1, IL1A, NFKBIA, IL1F6, CD83, IL6
Summary of genes associated with Ingenuity canonical pathways ‘dendritic cell maturation’ and ‘acute phase response signaling’ in S. aureus and E. coli
inoculated SCS-BTA18-Q and SCS-BTA18-q cells, respectively.
Brand et al. Genetics Selection Evolution 2011, 43:24
/>Page 11 of 17
24 h in SCS-BTA18-Q cells in comparison to SCS-
BTA18-q cells. In addition, a substantial difference in
the composition of cytokines up-regulated in response
to S. aureus challenge between S CS-BTA18-Q and SCS-
BTA18-q cells was observed (Table 7). In E. coli inocu-
lated SCS-BTA18-Q cells, 22 of the 29 genes affecting
leukocyte migration were also up-regulated in SCS-
BTA18-q cells, whereas in S. aureus inoculated SCS-
BTA18-Q cells, only four of the 18 genes significantly
co-expressed were also up-regulated in S CS-BTA18-q
cells (Table 7). In particular, the elevated expression
level of CXCL2 and CXCL3 1 h after inoculation with E.
coli showed that SCS-BTA18-Q cells can initiate an
early response to inoculation by the up-regulation of
cytokines involved in the inflammatory response and in
chemotaxis in comparison to SCS-BTA18-q c ells.
Furthermore, the hierarchical clustering indicated that
the up-regulation of genes involved in leukocyte migra-
tion already o ccurred preferentially in the first 6 h in
SCS-BTA18-Q cells inoculated with E. coli, whereas in
SCS-BTA18-q cells several genes (CXCL2, NFKBIA)did
not show an elevated expression until 24 h after inocu-
lation. The difference in the regulation of genes during
time-course between SCS-BTA18-q and SCS-BTA18-Q
cells was more pronounced in S. aureus than in E. coli
inoculated cells, which could be attributed to the
delayed up-regulation of genes 6 h after inoculation in
SCS-BTA18-q (Figure 4). Thus, after S. aureus inocula-
tion, SCS-BTA18-Q cells showed a continuous up-regu-
lation towards time point 24 h in the corresponding
hierarchical clustering analysis, whereas the expression
data of SCS-BTA18-q cells at time point 24 h and of
both SCS-BTA18- Q and SCS-BTA18-q cells at t ime
point 1 h were clustered together. In summary, S CS-
BTA18-q showed a less distinct and delayed response to
pathogen challenge in comparison to SCS-BTA18-Q in
both S. aureus and E. coli inoculated cells, and E. coli
inoculated cells triggered a faster and more distinctive
response to pathogen challenge than S. aureus did.
To identify potential candidate genes underlying the
SCS-BTA18-QTL, a combined survey considering
differentially expressed and positional candidate
genes w as performe d, indicati ng a singl e gene, v-rel
reticuloendotheliosis viral oncogen homolog B (RELB)
to be differentially expressed after inoculation in SCS-
BTA18-Q, but not SCS-BTA18-q cells and to be
located in the vicinity of the SCS-BTA18-QTL.
Discussion
In this study, some first insights into the molecular
mechanisms of the response to bacterial challenge of
mammary gland epithelial cells sampled from half-sib
heifers marker selected for alternative SCS-BTA18-QTL
CCL2
CCL20
CCL5
CD38
CD40
CX3CL1
CXCL2
CXCL3
CXCL6
CXCL10
ICAM1
IL18BP
IL1B
IL8
LGALS9
MMP9
NFKBIA
PLAU
RASGRP
1
S100A8
S100A9
TGM2
SCS-BTA18-Q_1h
SCS-BTA18-q_1h
SCS-BTA18-q_6h
SCS-BTA18-Q_6h
SCS-BTA18-q_24h
SCS-BTA18-Q_24h
SCS-BTA18-q_6h
SCS-BTA18-Q_6h
SCS-BTA18-q_24h
SCS-BTA18-q_1h
SCS-BTA18-Q_1h
SCS-BTA18-Q_24h
0.0 0.295 0.96
0.0 0.9 2.23
CCL5
NFKBIA
VCAM1
CXCL10
A E. coli inoculated cells
B S. aureus inoculated cells
Figure 6 Hierarchical clustering of genes associated with
leukocyte migration. Hierarchical clustering of expression data
obtained for significantly co-expressed genes in SCS-BTA18-Q and
SCS-BTA18-q cells associated with the Ingenuity functional category
‘immune cell trafficking’ that are involved in the migration of
leucocytes; A E. coli inoculated cells; B S. aureus inoculated cells;
heat map visualizes changes in gene expression levels between
inoculated and control cells at time points; the log
2
fold change
ranges are shown at the upper bars.
Brand et al. Genetics Selection Evolution 2011, 43:24
/>Page 12 of 17
alleles were drawn from a holistic transcriptome analy-
sis. The main findings of this study were firstly, that
both, cell culture and inoculat ion, triggered significant
changes in gene expression of mammary epithelial cells
in vitro. Secondly, inoculation with heat-inactivated E.
coli induced a stronger immune response compared to
inoculation with h eat-inactivated S. aureus within the
first 24 h. Thirdly, both, cells sampled from animals
inheriting the favorable QTL allele ‘Q’ and cells sampled
from animals i nheriting the unfavorabl e QTL alle le ‘q’
could activate immune response mechanisms after bac-
terial challenge in vitro, but there was a delayed and
weaker response in SCS-BTA18-q cells.
Numerous studies have shown that mammary epithe-
lial cells play a crucial role in the response to invading
pathogens in the mammary gland [31,41,42], and several
studies have used primary bovine mammary gland
epithelial cell cultures to investigate common mechan-
isms of immune response in mammary epithelial cells in
response to mastitis pathogens in vitro [8,30,43-45]. The
differences in the response to bacterial challenge of
mammary epithelial cells in vivo and in vitro have been
partially characterized by [8,45], indicating that only a
subset of the genes involved in the immune response in
vivo are regulated in mammary epithelial cells in vitro
and that there is a difference in the time-course of the
response. It has been suggested that these differences
could be related to missing virulence factors of heat-
inactivated pathogens that were used in in vitro experi-
ments compared to the active pathogens used in in vivo
models and to other immune cells regulating the gene
expression of mammary epithelial cell in vivo [8,45].
However, most of the studies showed that primary
bovine mammary gland epithelial cells can trigger an
immune response after bacterial challenge or inoculation
with bact erial cell wall comp onents [8,30,44,46]. In par-
ticular, an induced expression was observed for inflam-
matory chemokines like IL-8, CCL20, CCL5 and CCL2
that are involved in neutrophile, lymphocyte and
monocyte recruitment as well as for genes with antimi-
crobial activity such as S100A9 and S100A12 and for
acute phase proteins like SAA3P and HP [8,30,44,45].
Our aim was to survey, if the present established in
vitro test system is suitable to investigate molecular
mechani sms regulated in the response to bacterial chal-
lenge and if there are differences in the respon se to
pathogen challenge that are related to the different
genetic predisposition of the animals.
Effects of cell culture on gene expression in primary
bovine mammary gland epithelial cells
Firstly, our study demonstrated that the cells sampled
from SCS-BTA18-Q and SCS-BTA18-q animals
responded to cell culture and that processes mainly
involved in ‘cell cycle’ and ‘ cellular development’ were
affected by cell culture after 24 h. In particular, the
down-regulation of genes associated with molecular and
cellular function like ‘small molecule biochemistry’ ,
‘nucleic acid metabolism’ and ‘carbohydrate metabolism’
in SCS-BTA18-Q cells, comprising genes involved in the
nucleotide excision repair pathway, in pyrimidine and
purine metabolisms as well as glycolysis and gluconeo-
genesis, indicated that processes essential for cell survi-
vability are down-regulated during culture. The number
of differentially expressed genes in SCS-BTA18-q cells
aft er 24 h of culture was low compared to S CS-BTA18-
Q cells. Correspondingly, the observed effects of cell
culture were more pronounced in SCS-BTA18-Q cells,
which could be in part attributed to the lower number
of samples in the SCS-BTA18-q group. However, the
high coincidenc e of the top up- and down-regulated
genes between SCS-BTA18-Q and SCS-BTA18-q con-
trol cells, t he observed distinct response of pathogen
challenged SCS-BTA18-q- after 24 h, and the distinct
response of SCS-BTA18-Q and SCS-BTA18-q cells dur-
ing time-course, both, after cell culture and inoculation,
indicate that the limited number of differentially
expressed genes in the control SCS-BTA18-q cells in
Table 7 Gene table functional category immune cell trafficking
QTL allele Pathogen Category Functional
annotation
Genes
SCS-BTA18-Q E. coli Immune cell
trafficking
Migration of
leukocytes
CCL2, CCL5, CCL20, CCL28, CD38, CD40, CSF1, CX3CL1, CXCL2, CXCL3, CXCL6, CXCL10,
CXCL14, FAS, ICAM1, IL8, IL18BP, IL1B, ITGAV, LGALS9, MMP9, NFKBIA, PLAU, RASGRP1,
S100A8, S100A9, TGM2, TNFRSF6B, VCAM1
SCS-BTA18-Q S. aureus Immune cell
trafficking
Migration of
leukocytes
CCL2, CCL5, CCL20, CD40, CXCL6, CXCL10, EDN1, FAS, ICAM1, IL1B, LGALS9, MMP9, NFKBIA,
PLAU, RASGRP1, S100A8, S100A9, VCAM1
SCS-BTA18-q E. coli Immune cell
trafficking
Migration of
leukocytes
C3, CCL2, CCL5, CCL20, CD38, CD40, CX3CL1, CXCL2, CXCL3, CXCL6, CXCL10, CXCR4, CXCR7,
EDN1, ICAM1, IL8, IL18BP, IL1B, ITGA5, LGALS9, MMP9, NFKBIA, PLAU, RASGRP1, S100A8,
S100A9, TGM2
SCS-BTA18-q S. aureus Immune cell
trafficking
Migration of
leukocytes
CCL5, CXCL2, CXCL3, CXCL10, CXCR4, CXCR7, IL8, IL18BP, NFKBIA, VCAM1
Summary of differentially expressed genes associated with Ingenuity functional category ‘ immune cell trafficking’ that are involved in the migration of leukocytes
in S. aureus and E. coli inoculated SCS-BTA18-Q and SCS-BTA18-q cells, respectively.
Brand et al. Genetics Selection Evolution 2011, 43:24
/>Page 13 of 17
comparison with the control SCS-BTA18-Q cells reflects
well the observed delayed and weaker response after
challenge with pathogens.
Effect of inoculation with heat-inactivated S. aureus and
E. coli pathogens on gene expression in primary bovine
mammary gland cells
The response to inoculation with heat-inactivated E. coli
and S. aureus showed pathogen specific effects on the
gene expression in pbMEC with an elevated n umber of
significantly differentially expressed genes observed for
E. coli inoculated cells compared to S. aureus inoculated
cells within the first 24 h. A faster and more pro-
nounced immune response to E. coli in comparison to
S. aureus is a lso known from other studies investigati ng
response mechanisms of the mammary gland in vitro
and in vivo [45-48]. Different analyses were performed
to characterize the response of the mammary gland
epithelial cells to bacterial challenge in this study. All
three analyses, i.e. analysis between time points, analysis
at time points between inoculated and un-inoculated
cells and co-expression analysis showed that inoculation
of cells sampled from SCS-BTA18-Q and SCS-BTA18-q
animals with E. coli stimulated the expression of genes
involved in the ‘ migration of leukocytes’ as well as in
canonical pathways associated with ‘ dendritic cell
maturation’ and ‘acute phase response’. SAA3, S100A9,
IL-1b, CCL5, MX2 and BF were some of the genes sti-
mulated 24 h after E. coli inoculation, that have pre-
viously been shown to b e significantly up-regulated in
response to E. coli challenge in pbMEC [8]. Essentially,
these results confirmed the results obtained in the ana-
lyses of innate immune system key molecules by RT
PCR [12] investigating the same cells. After E. coli chal-
lenge, the microarray results at time point 24 h were in
agreement to the respective results obtained with RT
PCR [12]. TLR 2, IL-1b,IL-6,IL-8,LTFand C3 showed
a h igher expression in cells sampled from SCS-BTA18-
Q animals compared to cells sampled from SCS-BTA18-
qanimals.IntheS. aureus inoculated cells, all of these
genes showed a higher expression level 24 h after inocu-
lation in SCS-BTA18-Q cells compared to SCS-BTA18-
q cells in the microarray analyses, hence, fully confirm-
ing the previous results obtained by RT PCR at time
point 24 h [12]. Observed effects of cell culture and
pathogen challenge on gene expression in pbMEC
clearly indicated that the established in vitro system is
suitable to study the cellular and molecular respo nse to
effects of endogenous and exogenous factors like effects
of the SCS-BTA18-QTL alleles. This is in agreement
with an ovi ne animal model [49], which also used sheep
mammary gland epithelial cells to identify molecular
mechanisms that are affected by selection for high and
low SCS in two divergent lines of sheep selected by
applying a selection strategy based on conventional
breeding values.
Effects of SCS-BTA18-QTL alleles on the response to
pathogen challenge
In the present study, cells sampled from SCS-BTA18-Q
animals exhibited corresponding changes in gene
expression after pathogen challenge in accordance to
other studies investigating molecular mechanisms of
immune response in mammary gland epithelial cells
[6,8,47]. In contrast, cells sampled from ani mals inherit-
ing the SCS-BTA18-q allele showed a delayed and less
distinct immune response associated gene expression to
pathogen challenge. The comparison of genes affecting
leukocyte migration between SCS-BTA18-Q and SCS-
BTA18-q cells clearly showed that SCS-BTA18-Q cells
triggered a faster response to E. coli inoculation indi-
cated by the early a nd linear up-regulation of CCL2,
CCL 20, CXCL2, CXC L3, IL1B, IL-8 and NFKBIA.These
genes are important for the inflammatory response and
for the recruitment of monocytes, lymphocytes, neutro-
phils and basophils, which in turn are essential for a fast
pathogen clearance [41,50]. On the contrary, cells from
animals inheriting the SCS-BTA18-q allele showed a
delayed up-regulation of those genes towards time point
24 h in response to E. coli challenge. The observed early
and linear up-regulation of inflammatory chemokines
after E. coli or S. aureus inoculation in SCS-BTA18-Q
cells is in line to the earlier and higher up-regulation
after pathogen challenge of SAA3P, IL6 and NFKB2,
genes that are involved in ‘ acute phase response
signaling’.
The differences observed between SCS-BTA18-Q and
SCS-BTA18-q cells inoculated with S. aureus were more
distinct than in E. coli inoculated cells. Whereas a high
number of genes were regulated in common after E. c oli
challenge in SCS-BTA18-Q and SCS-BTA-q cells, only
CCL5, CXCL10, NFKBIA and VCAM1 were in common
and significantly regulated in SCS-BTA18-q and SCS-
BTA18-Q cells after S. aureus challenge. In addition, the
expression data of SCS-BTA18-q cells at time point 24
h clustered together with the expression data of SCS-
BTA18-q and SCS-BTA18-Q cells at time point 1 h
underlining a delayed response in SCS-BTA18-q cells.
Interestingly, by comparing the differentially expressed
genes in SCS-BTA18-Q and SCS-BTA18-q cells a single
gene located in the vicinity of the S CS-BTA18-QTL,
RELB, was exclusively and significantly regulated in
SCS-BTA18-Q cells. In a previous study we could iden-
tify the two-marker haplotype BB710 - PVRL2_c.3 92G >
A within a 1 Mb range of the RELB locus as associated
with SCS in the German Holstein Population [15]. RELB
is involved in the non-canonical NF-kappaB signaling as
part of the RelB/p52 complex [51]. Further analysis of
Brand et al. Genetics Selection Evolution 2011, 43:24
/>Page 14 of 17
genes involved in non-canonical NF-kappaB signaling
also indicated that CD40 and TNFSF13B (BAFF), two
receptors elici ting the non- canonical NF-ka ppaB signal-
ing are significantly co -expressed in SCS-BTA18-Q cells
as well as NFKB2, the gene encoding the p100 protein,
which is processed into p52 to activate the RelB/p52
complex. The RelB/p52 complex is thought to be impor-
tant in biological functions such as lymphoid organo-
genesis, B-cell survival and maturation and dendritic cell
activation [51,52]. In addition, RELB deficient mice
exhibited a multifocal, mixed inflammatory cell infiltra-
tion in several organs [53] and fibroblasts from RELB
deficient mice, also indicated an important role of RELB
as transcription suppressor limiting the expression of
proinflammatory mediators [54]. This would be in line
with the higher susceptibility of SCS-BTA18-q animals
indicated b y the higher SCS observed in SCS-BTA18-q
animals. In summary, these results indicated RELB as an
interesting positional and functional candidate gene for
the SCS-BTA18-QTL, but further studies are needed to
investigate the role of RELB within the SCS-BTA18-
QTL and to confirm the results. A survey of polymorph-
isms within the RELB locus would help to clarify if
RELB itself or other genes regulating RELB are causal
for the SCS-BTA18-QTL.
Conclusions
Primary bovine mammary gland epithelial cells sampled
from m arker selected half-sib heifers inheriting alterna-
tive paternal QTL alleles of a confirmed QTL for SCS
showed distinct responses to pathogen challenge with
heat-inact ivated E. coli and S. aureus during time-
course. The individual immune response of both, SCS-
BTA18-Q and SCS-BTA18-q cells indicates tha t the
established in vitro test system can reflect genetically
determined differences in molecular mechanisms
affected by the SCS-BTA18-QTL in response to patho-
gen challenge and that the underlying mechanisms of
the SCS-BTA18-QTL might be attributed to immune
functions. The early and linear up-regulation of cyto-
kines in SCS-BTA18-Q cells suggests a s uperior
immune response in SCS-B TA18-Q cells compar ed to
SCS-BTA18-q cells. Especially the up-regulation of
RELB and other genes involved in the non-canonical
NF-kappaB signaling in SCS_BTA18-Q cells high light ed
RELB as a positiona l and functional candidate gene
affected by the SCS-BTA18-QTL. Future analyses of
lymph node and parenchyma samples obtained from the
genetically divergent half- sib heifers and a comparison
to conventionally selected heifers w ill allow to more
accurately define the molecular mechanisms specifically
affected by the SCS-BTA18-QTL and could provide new
insights into molecular mechanisms commonly involved
in the response to pathogens in mammary gland epithe-
lial cells.
Additional material
Additional file 1: Differentially expressed between time points 1 h
and 24 h in un-inoculated control cells. Lists of differentially expressed
genes between time points 1 h and 24 h of un-inoculated control cells.
Gene symbol, log
2
fold changes as well as Entrez gene names are
provided for each of the two paternally inherited SCS-BTA18-QTL alleles.
Genes were selected on the basis of FDR adjusted p-values of q ≤ 0.05.
Additional file 2: List of genes showing a significant co-expression
in time-course after inoculation with heat inactivated E. coli and S.
aureus in SCS-BTA18-Q and SCS-BTA18-q cells, respectively.
Significantly co-expressed genes in S. aureus and E. coli inoculated SCS-
BTA18-Q and SCS-BTA18-q cells identified using the clustering algorithm
implemented in the short time-series expression miner STEM [28,29]
(version 1.3.6). Only genes with a fold change of log
2
fc ≥ 0.75 in time-
course were considered. Significance was assessed based on the non-
random co-expression of genes by comparing the number of genes
assigned to a specific co-expression profile model to the expected
number of genes assigned to the co-expression profile model quantified
by permutation. The number of the profile, the human gene symbol and
the log fold changes for time points 0 h, 1 h, 6 h and 24 h are shown.
Acknowledgements
The authors would like to thank the laboratory staffs of the Leibniz Institute
for Farm Animal Biology in Dummerstorf and of the Veterinary Physiology at
the Vetsuisse Faculty of the University of Bern for their hospitality and
assistance. The financial support of the German Federal Ministry of Education
and Research (BMBF) (Projekt FUGATO M.A.S.net, FKZ 0313390A) and the
Development Association for Biotechnology Research (FBF) e.V., Bonn, is
gratefully acknowledged.
Author details
1
Research Group of Functional Genomics, Leibniz Institute of Farm Animal
Biology, 18196 Dummerstorf, Germany.
2
Research Unit of Genetics and
Biometry, Leibniz Institute of Farm Animal Biology, 18196 Dummerstorf,
Germany.
3
Research Unit of Molecular Biology, Leibniz Institute of Farm
Animal Biology, 18196 Dummerstorf, Germany.
4
Institute of Physiology,
Technical University Munich, 85350 Freising, Germany.
5
Veterinary
Physiology, Vetsuisse Faculty, University of Bern, 1725 Posieux, Switzerland.
6
Institute of Farm Animal Science and Technology, University of Rostock,
18059 Rostock, Germany.
Authors’ contributions
BB performed the microarray and bioinformatic analyses and drafted the
manuscript. BGZ, OW and HHDM designed and coordinated the cell culture
experiments and performed the Real-Time PCR analyses. CK and MS devised
the design of the study, coordinated the study and participated in the
interpretation of the data and critically revised the manuscript. SP, AH and
DR participated in the microarray analyses and AH performed the miroarray
experiments. All authors read and approved the final manuscript.
Competing interests
The authors declare that they have no competing interests.
Received: 12 October 2010 Accepted: 24 June 2011
Published: 24 June 2011
References
1. Kossaibati MA, Esslemont RJ: The costs of production diseases in dairy
herds in England. Vet J 1997, 154:41-51.
2. Seegers H, Fourichon C, Beaudeau F: Production effects related to mastitis
and mastitis economics in dairy cattle herds. Vet Res 2003, 34:475-491.
Brand et al. Genetics Selection Evolution 2011, 43:24
/>Page 15 of 17
3. Khatkar MS, Thomson PC, Tammen I, Raadsma HW: Quantitative trait loci
mapping in dairy cattle: review and meta-analysis. Genet Sel Evol 2004,
36:163-190.
4. Ogorevc J, Kunej T, Razpet A, Dovc P: Database of cattle candidate genes
and genetic markers for milk production and mastitis. Anim Genet 2009,
40:832-851.
5. Tao W, Mallard B: Differentially expressed genes associated with
Staphylococcus aureus mastitis of Canadian Holstein cows. Vet Immunol
Immunopathol 2007, 120:201-211.
6. Mitterhuemer S, Petzl W, Krebs S, Mehne D, Klanner A, Wolf E, Zerbe H,
Blum H: Escherichia coli infection induces distinct local and systemic
transcriptome responses in the mammary gland. BMC Genomics 2010,
11:138.
7. Moyes KM, Drackley JK, Morin DE, Rodrigue z-Zas SL, Eve rts RE, Lewin HA,
Loor JJ: Mammary gene expression profiles during an intramammary
chal lenge reveal potential mechanisms linking negative energy
balance with impaired immune response. Physiol Genomics 2010,
41:161-170.
8. Guenther J, Koczan D, Yang W, Nuernberg G, Repsilber D, Schuberth HJ,
Park Z, Maqbool N, Molenaar A, Seyfert HM: Assessment of the immune
capacity of mammary epithelial cells: comparison with mammary tissue
after challenge with Escherichia coli. Vet Res 2009, 40:31.
9. Regenhard P, Petzl W, Zerbe H, Sauerwein H: The antibacterial psoriasin is
induced by E. coli infection in the bovine udder. Vet Microbiol 2010,
143:293-298.
10. Günther J, Liu SZ, Esch K, Schuberth HJ, Seyfert HM: Stimulated expression
of TNF-alpha and IL-8, but not of lingual antimicrobial peptide reflects
the concentration of pathogens contacting bovine mammary epithelial
cells. Vet Immunol Immunopathol 2010, 135:152-157.
11. Sugimoto M, Fujikawa A, Womack JE, Sugimoto Y: Evidence that bovine
forebrain embryonic zinc finger-like gene influences immune response
associated with mastitis resistance. Proc Natl Acad Sci USA 2006,
103:6454-6459.
12. Griesbeck-Zilch B, Osman M, Kühn C, Schwerin M, Bruckmaier RH, Pfaffl MW,
Hammerle-Fickinger A, Meyer HHD, Wellnitz O: Analysis of key molecules
of the innate immune system in mammary epithelial cells isolated from
marker-assisted and conventionally selected cattle. J Dairy Sci 2009,
92:4621-4633.
13. Brink M: Ein Beitrag zur Feinkartierung von QTL-Regionen für
Eutergesundheit beim Rind. Schriftenreihe des Instituts für Tierzucht und
Tierhaltung der Christian-Albrechts-Universität zu Kiel 2003, 142:1-131.
14. Baes C, Brand B, Mayer M, Kühn C, Liu Z, Reinhardt F, Reinsch N: Refined
positioning of a quantitative trait locus affecting somatic cell score on
chromosome 18 in the German Holstein using linkage disequilibrium. J
Dairy Sci 2009, 92:4046-4054.
15. Brand B, Baes C, Mayer M, Reinsch N, Kuehn C: Identification of a two-
marker-haplotype on Bos taurus autosome 18 associated with somatic
cell score in German Holstein cattle. BMC Genetics
2009, 10:50.
16. Kühn C, Bennewitz J, Reinsch N, Xu N, Thomsen H, Looft C, Brockmann GA,
Schwerin M, Weimann C, Hiendleder S, Erhardt G, Medjugorac I, Forster M,
Brenig B, Reinhardt F, Reents R, Russ I, Averdunk G, Blumel J, Kalm E:
Quantitative trait loci mapping of functional traits in the German
Holstein cattle population. J Dairy Sci 2003, 86:360-368.
17. Xu N, Paul S, Bennewitz J, Reinsch N, Thaller G, Reinhardt F, Kühn C,
Schwerin M, Erhardt G, Weimann C, Thomsen H, Mishra S, Kalm E:
Confirmation of quantitative trait loci for somatic cell score on bovine
chromosome 18 in the German Holstein. Arch Tierz 2006, 49:111-119.
18. Holmberg M, Andersson-Eklund L: Quantitative trait loci affecting health
traits in Swedish dairy cattle. J Dairy Sci 2004, 87:2653-2659.
19. Lund MS, Sahana G, Andersson-Eklund L, Hastings N, Fernandez A,
Schulman N, Thomsen B, Viitala S, Williams JL, Sabry A, Viinalass H, Vilkki J:
Joint analysis of quantitative trait loci for clinical mastitis and somatic
cell score on five chromosomes in three Nordic dairy cattle breeds. J
Dairy Sci 2007, 90:5282-5290.
20. Schrooten C, Bovenhuis H, Coppieters W, Van Arendonk JAM: Whole
genome scan to detect quantitative trait loci for conformation and
functional traits in dairy cattle. J Dairy Sci 2000, 83:795-806.
21. Schulman NF, Viitala SM, de Koning DJ, Virta J, Maki-Tanila A, Vilkki JH:
Quantitative trait loci for health traits in Finnish Ayrshire cattle. J Dairy
Sci 2004, 87:443-449.
22. Hinrichs D, Stamer E, Junge W, Kalm E: Genetic analyses of mastitis data
using animal threshold models and genetic correlation with production
traits. J Dairy Sci 2005, 88:2260-2268.
23. Brand B, Baes C, Mayer M, Reinsch N, Seidenspinner T, Thaller G, Kühn C:
Quantitative trait loci mapping of calving and conformation traits on
Bos taurus autosome 18 in the German Holstein population. J Dairy Sci
2010, 93:1205-1215.
24. Kolbehdari D, Wang Z, Grant JR, Murdoch B, Prasad A, Xiu Z, Marques E,
Stothard P, Moore SS: A whole-genome scan to map quantitative trait
loci for conformation and functional traits in Canadian Holstein bulls. J
Dairy Sci 2008, 91:2844-2856.
25. Rupp R, Boichard D: Genetics of resistance to mastitis in dairy cattle. Vet
Res 2003, 34:671-688.
26. The Bovine Genome Sequencing and Analysis Consortium, Elsik CG,
Tellam RL, Worley KC: The genome sequence of taurine cattle: A window
to ruminant biology and evolution. Science 2009, 324:522-528.
27. Kühn C, Reinhardt F, Schwerin M: Marker assisted selection of heifers
improved milk somatic cell count compared to selection on
conventional pedigree breeding values. Arch Tierz 2008, 51:23-32.
28. Ernst J, Nau GJ, Bar-Joseph Z: Clustering short time series gene
expression data. Bioinformatics 2005, 21:i159-i168.
29. Ernst J, Bar-Joseph Z:
STEM: a tool for the analysis of short time series
gene expression data. BMC Bioinformatics 2006, 7:191.
30. Wellnitz O, Kerr DE: Cryopreserved bovine mammary cells to model
epithelial response to infection. Vet Immunol Immunopathol 2004,
101:191-202.
31. Wellnitz O, Reith P, Haas SC, Meyer HHD: Immune relevant gene
expression of mammary epithelial cells and their influence on leukocyte
chemotaxis in response to different mastitis pathogens. Vet Med (Praha)
2006, 51:125-132.
32. Gentleman RC, Carey VJ, Bates DM, Bolstad B, Dettling M, Dudoit S, Ellis B,
Gautier L, Ge YC, Gentry J, Hornik K, Hothorn T, Huber W, Iacus S, Irizarry R,
Leisch F, Li C, Maechler M, Rossini AJ, Sawitzki G, Smith C, Smyth G,
Tierney L, Yang JYH, Zhang JH: Bioconductor: open software
development for computational biology and bioinformatics. Genome Biol
2004, 5 :R80.
33. Gene Expression Omnibus (GEO). [ />geo/].
34. Irizarry RA, Bolstad BM, Collin F, Cope LM, Hobbs B, Speed TP: Summaries
of Affymetrix GeneChip probe level data. Nucl Acids Res 2003, 31:e15.
35. Hintermair V: Comparative analysis of Bos taurus and Homo sapiens DNA
microarrays. Master’s Thesis, Technical University, Munich 2007.
36. Smyth GK: Linear models and empirical Bayes methods for assessing
differential expression in microarray experiments. Stat Appl Genet Mol Biol
2004, 3, Article 3.
37. Pan KH, Lih CJ, Cohen SN: Effects of threshold choice on biological
conclusions reached during analysis of gene expression by DNA
microarrays. Proc Natl Acad Sci USA 2005, 102:8961-8965.
38. Ingenuity Systems. [].
39. Saeed AI, Sharov V, White J, Li J, Liang W, Bhagabati N, Braisted J, Klapa M,
Currier T, Thiagarajan M, Sturn A, Snuffin M, Rezantsev A, Popov D,
Ryltsov A, Kostukovich E, Borisovsky I, Liu Z, Vinsavich A, Trush V,
Quackenbush J: TM4: A free, open-source system for microarray data
management and analysis. Biotechniques 2003, 34:374-378.
40. Saeed AI, Hagabati NK, Braisted JC, Liang W, Sharov V, Howe EA, Li JW,
Thiagarajan M, White JA, Quackenbush J: TM4 microarray software suite.
Methods Enzymol 2006, 411:134-193.
41. Rainard P, Riollet C: Innate immunity of the bovine mammary gland. Vet
Res 2006, 37:369-400.
42. Goldammer T, Zerbe H, Molenaar A, Schuberth HJ, Brunner RM, Kata SR,
Seyfert HM: Mastitis increases mammary mRNA abundance of beta-
Defensin 5, Toll-Like-Receptor 2 (TLR2), and TLR4 but not TLR9 in cattle.
Clin Diagn Lab Immunol 2004, 11:174-185.
43. Atalla H, Gyles C, Mallard B: Persistence of a Staphylococcus aureus small
colony variants (
S.aureus SCV) within bovine mammary epithelial cells.
Vet Microbiol 2010, 143:319-328.
44. Griesbeck-Zilch B, Meyer HHD, Kühn CH, Schwerin M, Wellnitz O:
Staphylococcus aureus and Escherichia coli cause deviating expression
profiles of cytokines and lactoferrin messenger ribonucleic acid in
mammary epithelial cells. J Dairy Sci 2008, 91:2215-2224.
Brand et al. Genetics Selection Evolution 2011, 43:24
/>Page 16 of 17
45. Swanson K, Stelwagen K, Dobson J, Henderson H, Davis S, Farr V, Singh K:
Transcriptome profiling of Streptococcus uberis-induced mastitis reveals
fundamental differences between immune gene expression in the
mammary gland and in a primary cell culture model. J Dairy Sci 2009,
92:117-129.
46. Strandberg Y, Gray C, Vuocolo T, Donaldson L, Broadway M, Tellam R:
Lipopolysaccharide and lipoteichoic acid induce different innate
immune responses in bovine mammary epithelial cells. Cytokine 2005,
31:72-86.
47. Lee J-W, Bannerman DD, Paape JM, Huang M-K, Zhao X: Characterization
of cytokine expression in milk somatic cells during intramammary
infections with Escherichia coli or Staphylococcus aureus by real-time
PCR. Vet Res 2006, 37:219-229.
48. Petzl W, Zerbe H, Günther J, Yang W, Seyfert HM, Nürnberg G,
Schuberth HJ: Escherichia coli, but not Staphylococcus aureus triggers an
early increased expression of factors contributing to the innate immune
defense in the udder of the cow. Vet Res 2008, 39:18.
49. Bonnefont C, Foucras G, Toufeer M, Caubet C, Aurel MR, Robert-Granié C,
Cunha P, Gilbert F, Rainard P, Rupp R: Differential transcriptional response
to Staphylococcus aureus infection in two divergent lines of sheep
selected on milk somatic cell score. Proceedings of the 9th World Congress
on Genetics Applied to Livestock Production: 1-6 August 2010 Leipzig; 2010
[ />50. Elazar S, Gonen E, Livneh-Kol A, Rosenshine I, Shpigel NY: Essential role of
neutrophils but not mammary alveolar macrophages in a murine model
of acute Escherichia coli mastitis. Vet Res 2010, 41:53.
51. Sun SC: Non-canonical NF-kappaB signaling pathway. Cell Res 2011,
21:71-85.
52. Speirs K, Lieberman L, Caamano J, Hunter CA, Scott P: Cutting edge: NF-
kappaB2 is a negative regulator of dendritic cell function. J Immunol
2004, 172:752-756.
53. Weih F, Carrasco D, Durham SK, Barton DS, Rizzo CA, Ryseck RP, Lira SA,
Bravo R: Multiorgan inflammation and hematopoietic abnormalities in
mice with a targeted disruption of RelB, a member of the NF-kappaB/
Rel family. Cell 1995, 80:331-340.
54. Xia Y, Chen S, Wang Y, Mackman N, Ku G, Lo D, Feng L: RelB modulation
of IkappaBalpha stability as a mechanism of transcription suppression of
Interleukin-1 alpha (IL-1 alpha), IL-1 beta, and tumor necrosis factor
alpha in fibroblasts. Mol Cell Biol 1999, 19:7688-7696.
doi:10.1186/1297-9686-43-24
Cite this article as: Brand et al.: Comparative expression profiling of E.
coli and S. aureus inoculated primary mammary gland cells sampled
from cows with different genetic predispositions for somatic cell score.
Genetics Selection Evolution 2011 43:24.
Submit your next manuscript to BioMed Central
and take full advantage of:
• Convenient online submission
• Thorough peer review
• No space constraints or color figure charges
• Immediate publication on acceptance
• Inclusion in PubMed, CAS, Scopus and Google Scholar
• Research which is freely available for redistribution
Submit your manuscript at
www.biomedcentral.com/submit
Brand et al. Genetics Selection Evolution 2011, 43:24
/>Page 17 of 17