Managing cash flow an operational focus phần10 docx
Bạn đang xem bản rút gọn của tài liệu. Xem và tải ngay bản đầy đủ của tài liệu tại đây (149.75 KB, 28 trang )
APPENDIX A
Case Study: Managing Cash Flow
OBJECTIVE:
Given a cash flow forecast, appropriate historical financial information, and
assumptions regarding the future, be able to evaluate an organization’s cash posi-
tion and make recommendations about how it can manage its business more effec-
tively to conserve cash.
JACK B. NIMBLE COMPANY
(formerly ABC Machining, Inc.)
Jack Nimble had been employed by ABC Machining for nearly 20 years, serving
in a variety of engineering and manufacturing positions for the company. The
company owner decided to put the company up for sale, and Jack was eager to
buy it, since he knew he could do a better job of managing and running it than
was presently being done. There was potential for additional sales; and cost sav-
ings through production efficiencies, superior customer service, and reduced
administrative expenses (the owner was quite generous to himself) would be easy
to accomplish. Jack had no doubt that he could improve things dramatically with-
in a year, and growth possibilities after the first year were extremely attractive.
Jack did not have strong financial skills, but he knew that he had to put
together some kind of projected figures to set goals for the company and to satis-
fy his financial backers, who were members of his family and also not financially
sophisticated. Exhibit A.1 shows the income statement projections that Jack
prepared.
Based on this projection, which he felt was realistic, Jack did not do any fur-
ther financial studies, nor did his financial supporters request any more data.
Their feeling was that the combination of the sales growth and the attractive
improvement in profitability would be enough to avoid any financial difficulties.
Unfortunately, these projections proved insufficient. Jack did not take into
consideration three significant factors: (1) He would have to invest in excess of $2
325
million in plant and equipment to gain all the efficiencies and throughput expan-
sion he required; (2) to gain the new customers required to achieve the sales tar-
get, he would have to extend 30-day credit terms to all customers; and (3) it would
take time to ramp up to $1.5 million monthly sales necessary to attain the $18 mil-
lion target figure.
As ABC Machining, the company enjoyed a unique position—demand for its
products exceeded ability to supply. The company was able to sell all of its month-
ly production of about $1 million on a continuing basis. ABC required cash pay-
ment at time of delivery to virtually all customers, and was still able to sell 100
percent of its output. Jack, however, wanted to increase sales and net profits and
recognized the existence of increased competition and other changes in the mar-
ketplace. He not only saw the need to retain present customers but also to acquire
new customers. To accomplish his goals, he knew he would have to offer credit
terms for payment and would have to absorb the cost of carrying the significant
increase in accounts receivable investment.
Jack was fully aware of the plant and equipment investment and the
accounts receivable factors, but he did not understand the cash flow ramifications
they would have on his fledgling business. He simply assumed the profit gener-
ated from the new sales would produce enough cash to cover any requirements
he would face. He had not taken the ramping factor into consideration at all. If he
had done a balance sheet projection, even without taking the ramping into
account, the pro forma balance sheet figures in Exhibit A.2 would have appeared,
allowing him to plan for the cash shortage contingency.
From the pro forma balance sheet, it is clear that Jack could have anticipated
a significant problem with cash. Without that projection, however, Jack only
discovered the problem once in the middle of it. Fortunately, because some of his
relatives were willing to guarantee Jack’s loan, he was able to get a $1.5 million line
326
Case Study: Managing Cash Flow
ABC Machining Jack B. Nimble Co.
12/31/x1 – actual 12/31/x2 – projected
$ % $ %
Sales $12,002.7 100.0% $18,000 100.0%
Cost of goods sold 8,436.1 70.3 11,900 66.1
________ ______ _______ ______
Manufacturing Profit 3,566.6 29.7 6,100 33.9
Selling, gen. & admin.
expenses 2,474.4 20.6 2,500 13.9
________ ______ _______ ______
Operating Profit 1,092.2 9.1 3,600 20.0
Taxes 395.1 3.3 1,300 7.2
________ ______ _______ ______
Net Income $ 697.1 5.8% $ 2,300 12.8%
________ ______ _______ ______
________ ______ _______ ______
Exhibit A.1 Jack B. Nimble Company: Income Statements for Years Ending
December 31, 20x1 and 20x2 ($$ in 000s)
Jack B. Nimble Company 327
of credit from his bank and to increase his long-term loan by $500,000. To complete
the picture of his first year of operation, in Exhibit A.3 Nimble’s actual financial
results are shown compared to the projected figures and to the prior year numbers.
Part of Jack’s problem (and the solution to his critical needs) was borrowing. At
January 1, 20x2, Jack assumed a loan of just over $1 million with a monthly pay-
ment of $16,000 including interest at 8
1
/2 percent. He added $500,000 to the loan on
April 1, 20x2, which increased the monthly payment to $25,000 but did not change
the interest rate. He also negotiated a $1.5 million line of credit at a rate of 9 per-
cent. The actual cash flow, by month, for the year is shown in Exhibit A.4.
From these figures, it is clear that Jack made good progress towards achiev-
ing his goals. During the year, however, his cash flow difficulties forced him to
defer the purchase of certain equipment that he needed, and the impact on future
years may be severe. He did a good job controlling expenses and inventory, but
his accounts receivable went through the roof. As a result, he is now dealing with
a significant line of credit (and related interest charges). He has financed the rest
of his requirements partly from the profits he was able to attain and from the addi-
tion to his bank loan, but also by not paying his vendors on time. His accounts
payable balance has increased dramatically, and is now about 85 percent higher
than it should be. Jack’s phone is surely ringing off the hook with angry and frus-
trated vendors who are looking for payment. Additionally the bank is pressuring
($$ in 000s) 12/31/x2 – pro forma
ASSETS $ %
Cash $ (925) (12.2)
Accounts receivable 1,875 24.8
Inventory 2,400 31.8
______ _____
Current Assets 3,350 44.4
Other assets 4,200 55.6
______ _____
TOTAL ASSETS $7,550 100.0
______ _____
______ _____
LIABILITIES
Accts payable & accrued expenses $1,250 16.6
Other current liabilities 400 5.3
______ _____
Current Liabilities 1,650 21.9
Other liabilities 900 11.9
______ _____
Total Liabilities 2,550 33.8
STOCKHOLDERS’ EQUITY
Total Stockholders’ Equity 5,000 66.2
______ _____
TOTAL LIABILITIES & EQUITY $7,550 100.0
______ _____
______ _____
Exhibit A.2 Jack B. Nimble Company: Pro Forma Balance Sheet Figures for
December 31, 20x2
328 Case Study: Managing Cash Flow
ABC Machining, Inc.
12/31/x2l
12/31/x2
12/31/x1
($$ in 000s)
actual
projected
actual
$% $% $%
Sales
$15,073.4 100.0
$18,000 100.0
$12,002.7 100.0
Cost of goods sold
10,290.4 68.3
11,900 66.1
8,436.1 70.3
________
_____
_______
_____
_______
_____
Manufacturing Profit
4,783.0 31.7
6,100 33.9
3,566.6 29.7
Selling, g & a expenses
2,317.2 15.4
2,388 13.3
2,369.4 19.7
Interest expense
162.9 1.1
112 0.6
105.0 0.9
________
_____
_______
_____
_______
_____
Operating Profit
2,302.9 15.2
3,600 20.0
1,092.2 9.1
Taxes
912.0 6.0
1,300 7.2
395.1 3.3
________
____
_______
_____
_______
_____
NET INCOME
$ 1,390.9 9.2
$ 2,300 12.8
$ 697.1 5.8
________
_____
_______
_____
_______
_____
________ _____
_______ _____
_______ _____
Exhibit A.3
Jack B. Nimble Company (and ABC Machining, Inc.)
Income Statements for Years Ending December 31, 20x2 and 20x1
Jack B. Nimble Company 329
ABC Machining, Inc.
12/31/x2
12/31/x2
12/31/x1
($$ in 000s)
actual
pro forma
actual
ASSETS
$
%
$
%
$
%
Cash
$ 10.0 0.1
$(925) (12.2)
$ 207.6 4.3
Accounts receivable
2,029.6 26.0
1,875 24.8
142.1 3.0
Inventory
2,512.7 32.2
2,400 31.8
2,457.6 51.1
________ _____
_______ _____
________ _____
Current Assets
4,552.3 58.3
3,350 44.4
2,807.3 58.4
Other assets
3,251.6 41.7
4,200 55.6
2,003.1 41.6
________ _____
_______ _____
________ _____
TOTAL ASSETS
$7,803.9 100.0
$7,550 100.0
$4,810.4 100.0
________ _____
_______ _____
________ _____
________ _____
_______ _____
________ _____
LIABILITIES
Line of credit
$ 101.7 1.3
$ 0
$ 0.0 0.0
Accts pay & accd expenses 1,844.0 23.6
1,250 16.6
793.3 16.5
Other current liabilities
425.6 5.5
400 5.3
314.2 6.5
________ _____
_______ _____
________ _____
Current Liabilities
2,371.3 30.4
1,650 21.9
1,107.5 23.0
Long-term borrowing
1,346.1 17.2
900 11.9
1,007.3 21.0
________ _____
_______ _____
________ _____
Total Liabilities
3,717.4 47.6
2,550 33.8
2,114.8 44.0
STOCKHOLDERS’ EQUITY
Total Stockholders’ Equity
4,086.5 52.4
5,000 66.2
2,695.6 56.0
________ _____
______ ____
_______ ____
TOTAL LIABILITIES
& EQUITY
$7,803.9 100.0
$7,550 100.0
$4,810.4 100.0
________ _____
______ _____
________ _____
________ _____
______ _____
________ _____
Exhibit A.3
Jack B. Nimble Company (and ABC Machining, Inc.)
Balance Sheets at December 31, 20x2 and 20x1 (continued)
Jan Feb Mar Apr May Jun Jul A
ug Sep Oct Nov Dec Total
Projected Income Statement
Sales
1,001.2 1,045.9 1,095.6 1,142.0 1,177.8 1,235.6 1,288.8 1,304.9
1,355.5 1,425.2 1,490.2 1,510.7 15,073.4
Cost of goods
sold - var
447.5 452.2 484.1 487.4 509.1 516.9 534.4 555.5
569.4 577.0 600.2 604.8 6,338.5
Cost of goods
sold - fixed 291.1 292.5 293.6 295.7 298.8
299.4 331.2 341.1 347.7 366.1 395.9 398.8 3,951.9
Selling, g & a - var. 119.1 122.8 128.9 132.2 141.8
144.3 152.7 157.2 161.9 166.5 172.5 174.9 1,774.8
Selling, g & a - fixed 39.9 41.1 41.9 42.2
42.5 44.0 45.2 47.7 48.2 49.0 49.9 50.8
542.4
Interest
7.1 12.5 15.3 18.4 14.3 12.7 16.3
14.5 14.2 14.1 12.0 11.4 162.9
______ ______ _____ _____ _____ _____ _____ _____
______ _____ ______ ______ _______
Profit before taxes 96.5 124.8 131.8 166.1
171.3 218.3 209.0 188.9 214.1 252.5 259.7 270.0 2,302.9
Income taxes
38.2 49.2 52.1 63.8 68.0 86.8 83.0
74.9 85.1 100.2 103.2 107.5 912.0
______ ______ _____ _____ _____ _____ _____
_____ ______ _____ ______ ______ _______
Net Income
58.3 75.6 79.7 102.3 103.3 131.5 126.0 114.0
129.0 152.3 156.5 162.5 1,390.9
______ ______ _____ _____ _____ _____ _____
_____ ______ _____ ______ ______ _______
______ ______ _____ _____ _____ _____ _____
_____ ______ _____ ______ ______ _______
Net Income -
% of sales
5.8% 7.2% 7.3% 9.0% 8.8% 10.6% 9.8%
8.7% 9.5% 10.7% 10.5% 10.8% 9.2%
______ ______ _____ _____ _____ _____ _____
_____ ______ _____ ______ ______ _______
______ ______ _____ _____ _____ _____ _____ _____
______ _____ ______ ______ _______
Loan Amortization
Principal - beg. bal. 1,007.3 998.4 989.5 1,480.5 1,466.0
1,451.4 1,436.7 1,421.8 1,406.9 1,391.9 1,376.7 1,361.5
Interest
7.1 7.1 7.0 10.5 10.4 10.3 10.2
10.1 10.0 9.9 9.8 9.6 111.8
Principal payment 8.9 8.9 9.0 14.5 14.6
14.7 14.8 14.9 15.0 15.1 15.2 15.4 161.2
______ ______ _____ _____ _____ _____ _____ _____
______ _____ ______ ______ _______
Principal
- ending bal. 998.4 989.5 980.5 1,466.0 1,451.4 1,436.7
1,421.8 1,406.9 1,391.9 1,376.7 1,361.5 1,346.1
______ ______ _____ _____ _____ _____ _____ _____
______ _____ ______ ______
______ ______ _____ _____ _____ _____ _____ _____
______ _____ ______ ______
Interest on line
of credit
0.0 5.4 8.3 7.9 3.9 2.4 6.1 4.5
4.2 4.2 2.2 1.8 51.0
______ ______ _____ _____ _____ _____ _____ _____
______ _____ ______ ______ _______
______ ______ _____ _____ _____ _____ _____
_____ ______ _____ ______ ______ _______
Exhibit A.4
Jack B. Nimble Company
Actual Cash Flow For 20x2
Jan Feb Mar Apr May Jun Jul A
ug Sep Oct Nov Dec Total
Cash Flow
A/R coll. -
current month 100.2 105.2 108.7 110.1 118.8
125.1 126.6 129.4 136.5 140.2 144.5 153.2 1,498.5
A/R coll.
- prior month 0.0 551.1 577.9 600.1 625.1 648.2
681.1 706.5 715.5 745.9 784.3 815.1 7,450.8
A/R coll.
- 2d prior month 0.0 0.0 342.3 359.1 378.9
398.8 405.0 422.2 446.2 450.0 465.9 492.8 4,161.2
New borrowing
500.0
500.0
_____
_______
Total Receipts 100.2 656.3 1,028.9 1,569.3 1,122.8
1,172.1 1,212.7 1,258.1 1,298.2 1,336.1 1,394.7 1,461.1 13,610.5
Cost of goods sold 651.3 657.0 689.6 694.4
718.3 726.5 766.2 794.3 812.8 833.3 877.3 884.0
9,104.8
Selling, gen.
& admin.
154.0 158.9 165.8 169.4 179.3 183.3 192.9 199.9
205.1 210.5 217.4 220.7 2,257.2
Interest
7.1 12.5 15.3 18.4 14.3 12.7 16.3
14.5 14.2 14.1 12.0 11.4 162.9
Taxes
100.0
139.5
131.8
244.7
616.0
Other - capital
investment 102.2 198.5 99.7 0.0 0.0 594.1
0.0 205.7 0.0 0.0 210.0 197.5 1,607.7
Debt principal
8.9 8.9 9.0 14.5 14.6 14.7 14.8 14.9
15.0 15.1 15.2 15.4 161.2
______ ______ _____ _____ _____ _____ _____ _____
______ _____ ______ ______ _______
Total Disbursements 1,023.5 1,035.8 979.4 1,036.2 926.5 1,663.1
990.3 1,229.3 1,291.8 1,073.0 1,332.0 1,328.9 13,909.8
______ ______ _____ _____ _____ _____ _____
_____ ______ _____ ______ ______ _______
Exhibit A.4
Jack B. Nimble Company
Actual Cash Flow For 20x2 (continued)
Jan Feb Mar Apr May Jun Jul A
ug Sep Oct Nov Dec Total
Net Cash Flow -923.3 -379.5 49.5 533.1 196.3
-491.0 222.4 28.8 6.4 263.1 62.7 132.2 -299.3
Beginning cash 207.6 -715.7 -1,095.2 -1,045.7 -512.6 -316.3
-807.3 -584.9 -556.1 -549.7 -286.6 -223.8 207.6
______ ______ _____ _____ _____ _____ _____
_____ ______ _____ ______ ______ _______
Available cash -715.7 -1,095.2 -1,045.7 -512.6 -316.3
-807.3 -584.9 -556.1 -549.7 -286.6 -223.8 -91.7 -91.7
Line of credit
borrowing
725.7 1,105.2 1,055.7 522.6 326.3 817.3 594.9
566.1 559.7 296.6 233.8 101.7 101.7
______ ______ _____ _____ _____ _____ _____ _____
______ _____ ______ ______ _______
Ending Cash
10.0 10.0 10.0 10.0 10.0 10.0 10.0
10.0 10.0 10.0 10.0 10.0 10.0
______ ______ _____ _____ _____ _____ _____ _____
______ _____ ______ ______ _______
Exhibit A.4
Jack B. Nimble Company
Actual Cash Flow For 20x2 (continued)
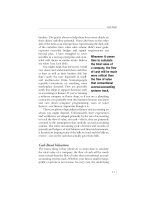
Cash Forecast Information 333
him, insisting that he zero out the line of credit for at least one month before they
will consider another year’s extension.
Because of his cash flow problems, Jack got smart quickly. He decided he
needs a reliable cash flow projection for next year, particularly since he wants to
catch up on his fixed asset expenditures as well as make additional investments.
The assumptions and estimates that support the forecast in Exhibit A.5 are as
reliable as can be expected in the circumstances.
FINANCIAL FORECAST INFORMATION
• Sales—January 20x3—$1,600,000; increasing at the rate of 1% per month
each month thereafter
• Cost of goods sold
• Variable CGS @ 40 percent of sales
• Fixed CGS @ $425,000/month, increasing at $10,000 per month for each
following month
• Selling, general and administrative expenses (including bad debt expense,
but excluding interest expense)
• Variable @ 10 percent of sales
• Fixed @ $55,000/month for six months, then $65,000/month
• Taxes—40 percent of profit before taxes
CASH FORECAST INFORMATION
• Accounts receivable collections
• 10 percent of current month sales
• 55 percent of prior month sales
• 34.5 percent of second prior month sales
• 0.5 percent uncollectible
• Cost of goods sold
• 100 percent of variable costs are cash
• 70 percent of fixed costs are cash
• Current month expenses are used as basis for projecting cash flow,
although they are actually paid for at a later date
• Selling, general and administrative expenses
• $5,000 of fixed costs are noncash; all others are cash
• Current month expenses are used as basis for projecting cash flow,
although they are actually paid for at a later date
• Operating cash—maintain minimum balance of $10,000
• Line of credit—9 percent interest on the prior month end balance
• Loan payments
• Interest @ 8.5 percent of outstanding balance
• $25,000/month repayment (interest included)
• Balance outstanding @ January 1, 20x3 = $1,346,100
• Tax payments
• Payment in January, April, June, and September covering in full all tax
obligations calculated for the period covered by the payments
• Other obligations
• All other obligations are for fixed-asset investments
• January $125,000
• February $700,000
• March $175,000
• Subsequent months $200,000/month
The preparation of this kind of a forecast is not difficult once the basic
assumptions and estimates are developed. The picture such a forecast provides
the management of the organization is invaluable. The prospect of an excess
amount of cash is an opportunity that should be used to the fullest advantage,
while a cash shortfall needs to be recognized early and handled wisely to mini-
mize the cost to the organization and to avoid the disaster of not being able to pay
off obligations. Either way, typical income statement projections and pro forma
balance sheets are not enough. Cash is the ultimate determinant of survival, suc-
cess, or failure.
TASK
Review the cash flow projection in conjunction with the financial statements and
other data previously presented in this case study. Identify opportunities, both
financial and operational, for improved cash management and be prepared to
make suggestions to Jack that can help him get through his cash crunch and meet
his bank’s demands.
JACK B. NIMBLE COMPANY CASE STUDY
SUGGESTED SOLUTION
There are many different cash management and operational areas to discuss relat-
ed to this case study. The company faces a cash flow crisis that has been caused
essentially by four factors:
1. Growth in sales without proper attention having been paid to the fact
that growth is an expensive proposition, requiring cash for the increase
in accounts receivable, inventory, staff, and possibly equipment and/or
plant
334
Case Study: Managing Cash Flow
Jan Feb Mar Apr May Jun Jul A
ug Sep Oct Nov Dec Total
Projected Income Statement
Sales
1,600.0 1,616.0 1,632.2 1,648.5 1,665.0 1,681.6 1,698.4 1,715.4
1,732.6 1,749.9 1,767.4 1,785.1 20,292.0
Cost of goods
sold - var
640.0 646.4 652.9 659.4 666.0 672.6 679.4 686.2
693.0 700.0 707.0 714.0 8,116.8
Cost of goods
sold - fixed 425.0 435.0 445.0 455.0 465.0
475.0 485.0 495.0 505.0 515.0 525.0 535.0 5,760.0
Selling, g & a - var. 160.0 161.6 163.2 164.8 166.5
168.2 169.8 171.5 173.3 175.0 176.7 178.5 2,029.2
Selling, g & a - fixed 55.0 55.0 55.0 55.0
55.0 55.0 65.0 65.0 65.0 65.0 65.0 65.0
720.0
Interest
10.3 11.1 13.3 11.5 12.7 11.1 11.2
9.7 8.6 9.1 8.4 8.3 125.4
______ ______ _____ _____ _____ _____ _____ _____
______ _____ ______ ______ _______
Profit before taxes 309.7 306.9 302.8 302.7
299.8 299.8 288.0 288.0 287.6 285.8 285.3 284.2 3,540.6
Income taxes 123.9 122.7 121.1 121.1 119.9 119.9
115.2 115.2 115.1 114.3 114.1 113.7 1,416.3
______ ______ _____ _____ _____ _____ _____
_____ ______ _____ ______ ______ _______
Net Income
185.8 184.1 181.7 181.6 179.9 179.9 172.8 172.8
172.6 171.5 171.2 170.5 2,124.4
______ ______ _____ _____ _____ _____ _____
_____ ______ _____ ______ ______ _______
______ ______ _____ _____ _____ _____ _____ _____
______ _____ ______ ______ _______
Net Income
% of Sales 11.6% 11.4% 11.1% 11.0% 10.8% 10.7%
10.2% 10.1% 10.0% 9.8% 9.7% 9.6% 10.5%
______ ______ _____ _____ _____ _____ _____ _____
______ _____ ______ ______ _______
______ ______ _____ _____ _____ _____ _____ _____
______ _____ ______ ______ _______
Loan Amortization
Principal -
beginning bal. 1,346.1 1,330.6 1,315.1 1,299.4 1,283.6 1,267.7
1,251.7 1,235.5 1,219.3 1,202.9 1,186.4 1,169.8
Interest
9.5 9.4 9.3 9.2 9.1 9.0 8.9 8.8
8.6 8.5 8.4 8.3 107.0
Principal payment 15.5 15.6 15.7 15.8
15.9 16.0 16.1 16.2 16.4 16.5 16.6 16.7
193.0
______ ______ _____ _____ _____ _____ _____
_____ ______ _____ ______ ______ _______
Principal -
ending bal. 1,330.6 1,315.1 1,299.4 1,283.6 1,267.7
1,251.7 1,235.5 1,219.3 1,202.9 1,186.4 1,169.8 1,153.1 1,153.1
______ ______ _____ _____ _____ _____ _____
_____ ______ _____ ______ ______ _______
______ ______ _____ _____ _____ _____ _____
_____ ______ _____ ______ ______ _______
Interest on
line of credit
0.8 1.7 4.0 2.3 3.6 2.1 2.4
0.9 0.0 0.6 0.0 0.0 18.4
______ ______ _____ _____ _____ _____ _____
_____ ______ _____ ______ ______ _______
______ ______ _____ _____ _____ _____ _____ _____
______ _____ ______ ______ _______
Exhibit A.5
Jack B. Nimble Company
Cash Flow Projection For 20x3
Jan Feb Mar Apr May Jun Jul A
ug Sep Oct Nov Dec Total
Cash Flow
A/R coll.
- current month 160.0 161.6 163.2 164.8 166.5
168.2 169.8 171.5 173.3 175.0 176.7 178.5 2,029.2
A/R coll.
- prior month 869.0 880.0 888.8 897.7 906.7 915.7
924.9 934.1 943.5 952.9 962.4 972.1 11,047.8
A/R coll.
- 2d prior mo. 538.2 545.1 552.0 557.5 563.1
568.7 574.4 580.2 586.0 591.8 597.7 603.7 6,858.4
______ ______ _____ _____ _____ _____ _____ _____
______ _____ ______ ______ _______
Total Receipts 1,567.2 1,586.7 1,604.0 1,620.1 1,636.3 1,652.6
1,669.1 1,685.8 1,702.7 1,719.7 1,736.9 1,754.3 19,935.5
Cost of goods sold 937.5 950.9 964.4 977.9 991.5
1,005.1 1,018.9 1,032.7 1,046.5 1,060.5 1,074.5 1,088.5 12,148.8
Selling,
gen. & admin. 210.0 211.6 213.2 214.8 216.5
218.2 229.8 231.5 233.3 235.0 236.7 238.5 2,689.2
Interest
10.3 11.1 13.3 11.5 12.7 11.1 11.2
9.7 8.6 9.1 8.4 8.3 125.4
Taxes
396.0
367.7
241.0
350.3
1,355.0
Other - capital
investment 125.0 700.0 175.0 200.0 200.0
200.0 200.0 200.0 200.0 200.0 200.0 200.0 2,800.0
Debt principal
15.5 15.6 15.7 15.8 15.9 16.0 16.1
16.2 16.4 16.5 16.6 16.7 193.0
______ ______ _____ _____ _____ _____ _____ _____
______ _____ ______ ______ _______
Total
Disbursements 1,694.3 1,889.2 1,381.6 1,787.8 1,436.6 1,691.4
1,476.1 1,490.1 1,855.1 1,521.0 1,536.2 1,552.0 19,311.4
Net Cash Flow -127.1 -302.5 222.5 -167.7 199.7
-38.8 193.1 195.7 -152.4 198.7 200.7 202.3 624.1
Beginning cash -91.7 -218.8 -521.3 -298.9 -466.6 -266.9
-305.7 -112.6 83.1 -69.3 129.4 330.1 -91.7
______ ______ _____ _____ _____ _____ _____
_____ ______ _____ ______ ______ _______
Available cash -218.8 -521.3 -298.9 -466.6 -266.9
-305.7 -112.6 83.1 -69.3 129.4 330.1 532.4 532.4
Line of credit
borrowing
228.8 531.3 308.9 476.6 276.9 315.7 122.6
0.0 79.3 0.0 0.0 0.0 0.0
______ ______ _____ _____ _____ _____ _____ _____
______ _____ ______ ______ _______
Ending Cash
10.0 10.0 10.0 10.0 10.0 10.0 10.0 83.1
10.0 129.4 330.1 532.4 532.4
Exhibit A.5
Jack B. Nimble Company
Cash Flow Projection For 20x3 (continued)
Jack B. Nimble Company Suggested Solution 337
2. The granting of credit terms of 30 days to customers, which means a
month’s worth of sales for which the company will not receive immediate
cash. In the meantime, it has to expend money ahead of time for the mate-
rials and labor that go into the products to be sold
3. Debt service—loan repayment and interest payments—that have been
incurred to handle previous tight cash situation but were not adequately
planned for by Nimble in his projections
4. Investment in fixed assets—property, plant and equipment—that Jack
feels is necessary to achieve his goals. These investments require payment
(from cash or borrowed funds) when they are purchased but provide
returns only over the lives of the assets acquired. The timing differences
have to be financed by the company, and Nimble has not taken this into
account.
An examination of the Cash Flow Projection for 20X3 quickly shows that the
company looks to be in very good shape by the end of that projection year. While
encouraging, this alone does not make the problem go away. As of the beginning
of the projection year, Nimble Company is out of cash and has several months of
negative cash flow to handle. It is this immediate problem that needs to be han-
dled. Additionally, there are lots of opportunities that would make the cash flow
situation even better than it looks in the projection, and these should be consid-
ered and implemented if feasible. Finally, even with the favorable projection, there
are numbers of operational and financial problems that should be addressed to
improve the overall company financial performance.
The suggested solution attempts to point out some of the key financial and
operational areas that should be addressed, but the reader should recognize that
there are many other areas that deserve attention as well.
Financial Issues
The company’s financial structure is seriously out of alignment. The short-term
line of credit has been used not only for working capital needs, but also for capi-
tal investment requirements. Using short-term money for long-term needs creates
a repayment problem since the benefits of those capital investments will accrue
only over the long-term. Since repayment requirements are immediate having
adequate funds to make them is difficult and in the case of Nimble Company, vir-
tually impossible. That is the major reason the company has been unable to zero
out the line of credit as demanded by the bank.
To solve this problem, it will be necessary to reshape the capital structure of
the company and, more immediately, to take care of the line of credit problem.
One quick and dirty, though temporary, way to deal with the line of credit issue
would be to ask the bank for a waiver of the requirement to zero out the loan. The
bank might say, “No”, in which case the company is no worse off than before. Or
338 Case Study: Managing Cash Flow
they might say, “Yes” to the request, in which case the problem goes away until a
more permanent fix is devised. In this particular case, given the very favorable
picture in the forecast for the end of year 20x3, it seems likely that the bank will
have little choice but to go along with the request for a limited period of time. To
refuse the request and call for immediate repayment of the loan will put the com-
pany into default and will thereby leave the bank as the owner/operator of the
company, a position no bank wants to get into. Since its best option for getting
repaid is to help the company get out of its difficulty, an affirmative response to
the request is likely, unless there are other factors that cause the bank to feel the
loan is a lost cause.
Once the line of credit problem is handled, Nimble Company can then work
with the bank to create a more appropriate capital structure consisting of long-
term loans, collateralized by the fixed assets it already owns. This reduces imme-
diate cash requirements by deferring the loan payments over a longer period of
time, albeit with greater interest payments. But the goal is to get through the
immediate cash crunch, and anything that can be deferred is likely to be a good
thing. Further, a more properly balanced capital structure is necessary and desir-
able for the company. As part of the refinancing structuring, the existing line of
credit should be extinguished, solving the zero balance problem, and replaced
with a new line of credit to be used for working capital needs only. Any new long-
term assets should then be financed by appropriate long-term debt.
Operational Issues
An immediate and obvious concern has to be the collection of existing accounts
receivable. Sales for the last quarter of 20X2 were $4,426,100 or $48,100 per day.
12/31/X2 accounts receivable were $2,029,600, making Jack’s collection period
42.2 days – 12.2 days more than his terms. That 12.2 days calculates out to be
$586,800 in unavailable cash. Calculated on an annual basis, his sales were
$15,073,400 or $41,300 per day. On that basis, his collection period is at 49.1 days,
which represents $788,800 in overdue cash the company is owed. Jack appears
to be doing little or nothing to collect his overdue accounts receivable, and he
needs to be pushed into going after the slow payers. Failing to pay attention to
this type of behavior on the part of his customers will only cause them to take
more advantage of him and extend payment times still farther out. A vigorous
follow-up program on the overdue accounts is likely to bring in a substantial
sum of money.
A second immediate issue is his planned expenditures for capital invest-
ments, which total $2,800,000 for the 20X3 projection period. Of particular con-
cern is the $700,000 projected for February. This should be cancelled if possible,
deferred if not cancelable, or financed if not deferrable. After that Jack’s $200,000
per month projection from April through December needs to be examined close-
ly to eliminate those planned expenditures that are not essential to the basic
growth and profitability of his business. It is too easy for production/engineer-
Jack B. Nimble Company Suggested Solution 339
ing trained managers to think that all they need to get their jobs accomplished is
more equipment. In this case Nimble can simply not afford to spend that much
money, and it also seems likely that even without a cash problem there is much
more projected than can be justified. In any event, that line item needs to be
scaled back significantly both to save cash and avoid becoming over-committed
to fixed-asset investment.
Arguably the most significant area of concern is the month-by-month
decline in the company’s profitability through the 20X3 projection period from
11.6 percent of sales to 9.6 percent. Something is wrong! According to the Financial
Forecast Information, fixed costs of goods sold are increasing at $10,000 per month
for the entire 12 months. That amounts to nearly $800,000 for the year. Nimble’s
reasons for these increases must be questioned, and such a review will undoubt-
edly point out savings of considerable magnitude in the projected cash flow. The
profitability decline is a huge red flag, caused principally by the increase in fixed
costs of goods sold, and this problem needs to be fixed, again not only to save cash
but also to improve company operations and profitability. Any self-respecting
bank will be very leery of lending money to a company with declining profitabil-
ity of this magnitude.
Additional operational areas to review for the purpose of improving both
cash flow and profitability are
• Variable costs of goods sold at 40 percent of sales (these should be decreas-
ing to reflect the improvements in efficiency he should be experiencing
because of investment in equipment)
• Selling, general and administrative expenses, both fixed and variable, to
see if they can be reduced
• Taxes, a look at which might result in the opportunity to defer or reduce
some of those payments as well
Finally, Nimble should be looking at his inventory. While his inventory has
not increased appreciably since he took over the company and therefore has not
been a direct contributor to his cash flow problems, there is still a potential for
improved operations. Nimble’s inventory turnover for 20X2 (cost of goods sold
divided by the inventory balance) is approximately 4.1 times—not bad, but cer-
tainly not exciting. The best way to determine if this number is satisfactory or not
is to examine industry statistics for the industry. We do not have that information
available, so a definitive determination cannot be made. However, if his invento-
ry turnover could be increased to five times, it would free up about $455,000 in
cash; if the turnover could be increased to six times, the amount of cash freed up
would be about $800,000. Those numbers will be even larger as the business
expands. For that kind of potential cash saving, inventory is worth looking into,
even though an improvement would take some time to implement—too long for
it to be an immediate solution to his existing problem.
If we had more information about the company it would be plausible that
other areas for improvement could be found (up to and including the possibility
of having Jack replaced by a more effective manager). But the idea presented here
is that most of any cash flow saved and profitability gained will come about as a
result of operational issues rather than financial issues. This does not mean the
financial issues should be ignored or minimized, but that operational issues
should be recognized as the principal causes of cash flow problems and the prin-
cipal sources of cash flow improvement.
340 Case Study: Managing Cash Flow
341
APPENDIX B
Cash Conservation Checklist
ASSETS Yes No N/A
Cash
1. Conserve what you have and invest any excess. _____ _____ _____
2. Utilize float on disbursements. _____ _____ _____
3. Negotiate with bank for quicker availability
of deposited funds. _____ _____ _____
4. Use lockboxes if they make economic sense. _____ _____ _____
5. Centralize cash and use sweep accounts
or like devices. _____ _____
6. Invest as early and as long as possible. _____ _____ _____
7. Don’t spend unless you must. _____ _____ _____
8. Use electronic transfers for incoming cash
whenever possible. _____ _____ _____
9. Offer discounts for cash sales. _____ _____ _____
10. _____ _____ _____
11. _____ _____ _____
Accounts Receivable
1. Get invoices out no later than time of shipment. _____ _____ _____
2. Establish and stick with credit terms. _____ _____ _____
3. Age and monitor your receivables. _____ _____ _____
4. Follow up regularly and persistently
on overdue accounts. _____ _____ _____
5. Consider (but do not automatically implement)
cash discounts or other incentives to pay. _____ _____ _____
6. Consider shortening payment terms to customers. _____ _____ _____
7. Control your accounts receivable to sales ratio. _____ _____ _____
8. Measure and control accounts receivable
collection period over two or three months
rather than a full year. _____ _____ _____
342 Cash Conservation Checklist
9. Factor receivables if not collateralized. _____ _____ _____
10. Use collection agencies if necessary. _____ _____ _____
11. Implement penalties for late payments. _____ _____ _____
12. Get cash payment for invoices where
cost of invoicing exceeds amount of the invoice. _____ _____ _____
Inventory
1. Stay out of the inventory business as much as possible. _____ _____ _____
2. Buy for customer orders rather than for stock. _____ _____ _____
3. Use vendor consignment inventory. _____ _____ _____
4. Negotiate blanket purchase orders
with flexible delivery schedules. _____ _____ _____
5. Consider effective disposal of obsolete
inventory for cash. _____ _____ _____
6. Stratify your inventory (ABC system) and control
strata independently. _____ _____ _____
7. Improve inventory turns.
8. Consider unloading dead or dying inventory for cash
(e.g., fire sales, parking lot flea markets, etc.). _____ _____ _____
9. _____ _____ _____
Prepaid Expenses
1. DON’T!! _____ _____ _____
2. Get your deposits back. _____ _____ _____
3. Avoid salary advances. _____ _____ _____
4. Consider monthly, quarterly, or semiannual insurance
premium payments rather than annual payments. _____ _____ _____
5. Do not overpay or prepay taxes. _____ _____ _____
6. _____ _____ _____
7. _____ _____ _____
8. _____ _____ _____
Fixed Assets
1. Buy what you need, not what would be nice. _____ _____ _____
2. Consider used equipment. _____ _____ _____
3. Rent out extra space. _____ _____ _____
ASSETS Yes No N/A
4. Consider leases to conserve cash. _____ _____ _____
5. Sell off idle assets. _____ _____ _____
6. Refurbish rather than buy new. _____ _____ _____
7. Use outside contractors for temporary excess
manufacturing requirements. _____ _____ _____
8. Use excess capacity to do contract work for others. _____ _____ _____
9. favorable payment or financing terms
with suppliers of new equipment. _____ _____ _____
10. Defer purchases. _____ _____ _____
11. Borrow to finance purchases (chattel mortgages). _____ _____ _____
12. Build rather than buy. _____ _____ _____
13. Check plant layout for efficiency. _____ _____ _____
14. Consider making employees responsible
for maintaining their own equipment. _____ _____ _____
15. _____ _____ _____
16. _____ _____ _____
17. _____ _____ _____
LIABILITIES AND EQUITY Yes No N/A
Accounts Payable and Accrued Expenses
1. Pay only what you owe (price and quantity). _____ _____ _____
2. Don’t double pay invoices. _____ _____ _____
3. Pay only properly authorized invoices. _____ _____ _____
4. Don’t pay early except for very good reasons. _____ _____ _____
5. Take advantageous discounts even if you have to borrow. _____ _____ _____
6. Negotiate better terms with suppliers. _____ _____ _____
7. Use computer to schedule and manage payments. _____ _____ _____
8. Establish plans/budgets for payments; review
and analyze variances. _____ _____ _____
9. Pay slow if you must, but communicate with
your suppliers about your plans. _____ _____ _____
10. Use bartering. _____ _____ _____
Liabilities and Equity
343
ASSETS Yes No N/A
344 Cash Conservation Checklist
11. Slow down spending—spend only what you have. _____ _____ _____
12. Pay off small invoices on time to reduce amount
to be managed. _____ _____ _____
13. Pay cash for small invoices where cost of processing
exceeds amount of invoice. _____ _____ _____
14. _____ _____ _____
Borrowing
1. Negotiate for lowest interest rate and best terms. _____ _____ _____
2. Get deferrals on interest and/or principal. _____ _____ _____
3. Analyze totality of loan costs —interest, compensating
balance requirements, restrictive covenants,
repayment terms, etc. _____ _____ _____
4. Borrow as little and as late as practical. _____ _____ _____
5. Match long-term needs with long-term borrowing. _____ _____ _____
6. Don’t use long-term debt for seasonal, cyclical,
or other short-term needs. _____ _____ _____
7. Roll interest into principal. _____ _____ _____
8. Convert to longer term repayment schedule. _____ _____ _____
9. _____ _____ _____
10. _____ _____ _____
Equity
1. Consider if it makes sense to pay dividends. _____ _____ _____
2. Consider if dividend payments are consistent
with cash availability. _____ _____ _____
3. Use stock in lieu of cash dividends. _____ _____ _____
4. Issue new stock.
5. Sell stock at discount to employees. _____ _____ _____
6. Initiate (or promote) dividend reinvestment program. _____ _____ _____
7. _____ _____ _____
8. _____ _____ _____
9. _____ _____ _____
LIABILITIES AND EQUITY Yes No N/A
INCOME AND EXPENSES Yes No N/A
Sales
1. Sell to the company plan. _____ _____ _____
2. Sell to customers who pay on time. _____ _____ _____
3. Sell profitable products. _____ _____ _____
4. Emphasize sales of higher margin
products/services. _____ _____ _____
5. Negotiate advance payments and/or
progress payments. _____ _____ _____
6. Remember that only the margin represents
increase in cash. _____ _____ _____
7. Raise prices (or lower prices). _____ _____ _____
8. Increase unit sales.
9. Provide volume discounts. _____ _____ _____
10. Emphasize cash sales. _____ _____ _____
11. _____ _____ _____
Expenses
1. Establish budget of expenses to assure
positive cash flow. _____ _____ _____
2. Review and control actual expenses to budget. _____ _____ _____
3. Establish authorization controls and limits
on purchase orders and/or requisitions. _____ _____ _____
4. Use blanket orders with flexible delivery schedules. _____ _____ _____
5. Negotiate for cash discounts. _____ _____ _____
6. Establish an atmosphere of cash conservation
among all employees. _____ _____ _____
7. Control cash disbursements at purchase order
level as well as actual expenditures. _____ _____ _____
8. Each dollar of cost saved equals a dollar of
cash improvement. _____ _____ _____
9. Reappraise assets to reduce taxes. _____ _____ _____
10. Hiring only when and as needed. _____ _____ _____
11. Initiate expense reduction program. _____ _____ _____
12. Competitively bid contracts. _____ _____ _____
13. Consider less expensive production methods. _____ _____ _____
14. Reduce or eliminate non-value-added activities. _____ _____ _____
Income and Expenses
345
15. Prepare budgets that reflect only
essential expenditures. _____ _____ _____
16. _____ _____ _____
17. _____ _____ _____
OTHER Yes No N/A
1. CASH IS KING! Manage your business accordingly. _____ _____ _____
2. Build cash awareness into your organizational
culture. _____ _____ _____
3. Prepare cash budgets in addition to profit budgets. _____ _____ _____
4. Pay any bonuses, commissions, etc. based
on cash flow criteria. _____ _____ _____
5. _____ _____ _____
6. _____ _____ _____
7. _____ _____ _____
8. _____ _____ _____
346 Cash Conservation Checklist
INCOME AND EXPENSES Yes No N/A
A
ABC, see Activity based costing
ABM (Activity Based Management), 156
Accounting, responsibility, 229, 231–232
Accounting function, 177–238
activity-based costing applications for,
211–213
areas of, 179–181
basic business principles in, 183–184
budget analysis in, 200–202
cash management analysis survey for,
188–198
cost analysis of, 202–206
developing recommendations for,
213–214
financial reporting in, 185–188
goal identification in, 182–183
goals of, 11
operations analysis of, 206–211
organizational issues with, 198–199
and organization recommendations,
232–234
prioritizing activities in, 184–185
review of, 234–237
specific recommendations for, 214–232,
234–237
Accounts payable, 8, 182, 206–207,
215–216, 235
Accounts receivable, 4, 7, 16, 39–43,
45–47, 182, 207–209, 216–217,
235–236
Accounts receivable-based financing, 252,
255–256
Accrual-based accounting, 19, 20, 186, 188
ACHs (automated clearinghouses), 23
Acquisitions (of new businesses), 316
Activity based costing (ABC), 152–174
accounting function applications of,
211–213
case study in, 168, 169, 171–174
cost assignment view of, 162
functional cost controls in, 167–170, 172
levels in, 163–166
objectives of, 153
and organizational concerns, 152,
154–157
overhead considerations in, 164,
166–167
process view of, 163
traditional costing vs., 157–161, 165
Activity Based Management (ABM), 156
Adjusted Net Income method, 288–289
Administration, 5, 167
Aging, accounts receivable, 42–43, 46
American Institute of Certified Public
Accountants (AICPA), 264
Amortization, 186
Assets, 12, 18, 251
Assumptions, 292–293, 297–298
Audit checks, 60–61
Automated clearinghouses (ACHs), 23
Automatic balance accounts, 66
Availability float, 24–26
B
Backlogs, 4
Balance sheets, 36–39
Banks/banking, 21–23, 28–33, 66–67, 252,
254–255, 258–259
Bank accounts, 66–67
Bankers’ acceptances, 256
Basic business principles, 5–6, 183–184
Batch level activities, 163
Benchmarking, 124–151
case study of, 148–150
and comparative analysis, 145–148
employee comparisons for, 141–144
external, 126–127, 150–151
internal, 126–130, 148–150
measures by function for, 133–134
and organizational structure, 130,
134–141
qualitative, 132
quantitative, 131
and stakeholders, 124
strategic concepts for, 125–126
targets of, 150–151
Best-in-class benchmarking, 127
Billing, 7
Board of Directors, 242
Bonds, 257
347
Index
Borrowed statistics, 146
Borrowing, 12, 251–262
interest rates for, 21, 23
and leverage, 259–262
management of, 258–259
medium- and long-term, 256–258
short-term, 253–256
sources for, 252–253
Bottom-up systems, 80
Budgeting systems:
analysis of, 200–202
and cash balances projections, 272, 273
and cash disbursements projections,
270–272
and cash flow planning, 267–275
and cash receipts projections, 268–270
and corporate planning, 71–74
and forecasting sales, 268
recommendations for, 223
and sales function, 100–103
C
Capital expenditures, 315–316
Capital investments, 155, 248–250
Capital leases, 258
Case study, 325–340
Cash, sources of, 12–14
Cash-based accounting, 186, 188
Cash conservation checklist, 341–346
Cash conversion and expansion, 3, 12
Cash discounts, 47–50, 60
Cash flow(s), 12–23
classifications of, 286–287
considerations for, 244–245
costs of, 38–39
decisions affecting, 153
and Federal Reserve System, 21–23
historical perspective on, 21
objectives of managing, 17–18
planning for, see Planning cash flow
process of, 14–17
and profitability vs. liquidity, 18–20
profits vs., 12–13
statements of, see Statements of cash
flows
Cash flow analysis, 285–322
and controls, 299–312
and FASB 95, 285–287
and interpretation, 300, 305, 307–309,
312–322
projections methodology for, 287–298
and reporting, 293
Cash gap, 12–13
Cash generation cycle, 14, 15, 17
Cash management, 9–11, 17–18, 95–96,
156, 188–192
Cash management services, 29
Cash on delivery (COD), 42, 43, 47
Cash processing systems, 52–56
Cash surrender value (of life insurance
policies), 256
Centralization of payables, 59
CEO (Chief Executive Officer), 242
CFO (Chief Financial Officer), 242
Check-clearing process, 22–26
Checking accounts, 29
Chief Executive Officer (CEO), 242
Chief Financial Officer (CFO), 242
Clearing time, 25, 26
COD, see Cash on delivery
Collection float, 24–26
Collection periods, 39–41
Collection systems, 7, 43–53, 109, 110
Commercial paper, 256
Commissions, 109
Commitment, lack of, 81
Commitment fees, 254
Common-size financial statements, 221
Communication, 33, 62, 111
Comparative analysis, 145–148, 221
Compensating balances, 29–30
Compensation, 97, 109–110, 143–144
Competition, strategies for, 74–76
Competitive analysis, 77
Competitive benchmarking, 126–127
Competitive pricing, 106
Compounding, 242, 244
Concentration accounts, 55–56
Contractors, 3
Contracts (with customers), 256
Controls, 167–170, 172, 299–312
Controlled disbursement funding, 63–65
Conversion, 3, 12
Correspondent banks, 25, 29
Costs, 8
of banking services, 29–31
of cash flow, 38–39
of goods sold, 226
noncompliance, 158
nonfinancial, 157
of overhead, 164, 166–167
of personnel, 141–144
348 Managing Cash Flow
traditional, 159–161
unit, 164
Cost analysis, 202–206
Cost assignment view, 162
Cost performance, 154, 155
Cost reductions, 123–175
activity based costing method for,
152–174
benchmarking method for, 124–151
targets of, 154
techniques for, 123
Credit policies, 44
Credit terms, 56–58
Currency, 22
Customers, 3, 124, 156, 252
Customer analysis, 77
Customer service, 2–3, 109
D
Days’ sales outstanding (DSO), 270
DCF, see Discounted cash flow
Debentures, 257
Deliveries, 51
Demand deposit accounts, 29, 66
Demand notes, 255
Depreciation, 186, 245
Detail operating plans, 90
Determination of strategic options, 78
Differentiation strategy, 74
Direct clearance, 25
Direct method planning, 280–282
Disbursement funding, 63–65
Disbursements float, 23, 24, 26, 63
Disbursements systems, 58–67, 270–272
Discounts, cash, 47–50, 60
Discounted cash flow (DCF), 242, 244
Discount rates, 23
Dollars per item, 105–106
DSO (days’ sales outstanding), 270
E
Economic conditions, 21
Economic float, 26–28
Electronic funds transfers (EFT), 23, 54–55
Employees, 72–73, 124, 134–135, 141–144,
230, 314–315
Employee Retirement Income Security
Act (ERISA), 253
Environmental analysis, 78
Equipment, see Property, plant, and
equipment
Equipment financing, 257
Equity, 12, 251
ERISA (Employee Retirement Income
Security Act), 253
Estimated funding disbursement
systems, 63–65
Excess cash, 13, 16, 272–275, 278. See also
Investing excess cash
Expenses, 8, 186
External analysis, 76–78
External benchmarking, 126–127, 150–151
F
Facility level activities, 163
Factoring, 255–256
FASB 95, see Statement of Financial
Accounting Standards Board No. 95
Federal Deposit Insurance Corporation
(FDIC), 30
Federal Reserve clearance, 25
Federal Reserve System (Fed), 21–23
Finance charges, 51
Finance leases, 258
Financial objectives orientation, 80
Financial ratios, 222
Financial reporting, 183, 185–188
Financial stability (of bank), 30
Financing activities, 313–314, 316
Financing sources, 250–251
Flexibility, 254
Float, 23–28, 59, 62
Focus strategy, 75
Forecasting, 103–104, 264–265, 268
Franklin, Benjamin, 8
G
Gap, cash, 12–13
General ledger, 183, 210–211, 218–219,
236–237
Goals, 69–70, 72, 88, 99, 182–183
Goldilocks Cash Management Principle,
16
Government, 3, 22, 124
Government securities, 23
Guaranties, 256
Index 349