Báo cáo y học: "Computational and transcriptional evidence for microRNAs in the honey bee genome" pot
Bạn đang xem bản rút gọn của tài liệu. Xem và tải ngay bản đầy đủ của tài liệu tại đây (271.27 KB, 12 trang )
Genome Biology 2007, 8:R97
comment reviews reports deposited research refereed research interactions information
Open Access
2007Weaveret al.Volume 8, Issue 6, Article R97
Research
Computational and transcriptional evidence for microRNAs in the
honey bee genome
Daniel B Weaver
¤
*
, Juan M Anzola
¤
†
, Jay D Evans
¤
‡
, Jeffrey G Reid
¤
§
,
Justin T Reese
†
, Kevin L Childs
†**
, Evgeny M Zdobnov
¶††
,
Manoj P Samanta
¥
, Jonathan Miller
#
and Christine G Elsik
†
Addresses:
*
Bee Power, LP, Lynn Grove Road, 16481 CR 319, Navasota, TX 77868 USA.
†
Department of Animal Science, Texas A&M University,
College Station, Texas 77843, USA.
‡
Bee Research Laboratory, USDA-ARS, BARC-E, Beltsville, MD, USA.
§
WM Keck Center for
Interdisciplinary BioScience Training, Houston, TX 77005, USA.
¶
European Molecular Biology Laboratory, Meyerhofstr., Heidelberg,
Germany.
¥
Systemix Institute, Los Altos, CA 94024, USA.
#
Department of Biochemistry, Baylor College of Medicine, Houston, TX 77030, USA.
**
The Institute for Genome Research, Rockville, MD 20850, USA.
††
Department of Genetic Medicine and Development, University of Geneva
Medical School (CMU), rue Michel-Servet 1, 1211 Geneva 4, Switzerland.
¤ These authors contributed equally to this work.
Correspondence: Christine G Elsik. Email:
© 2007 Weaver et al.; licensee BioMed Central Ltd.
This is an open access article distributed under the terms of the Creative Commons Attribution License ( which
permits unrestricted use, distribution, and reproduction in any medium, provided the original work is properly cited.
Honey bee microRNAs<p>A total of 68 non-redundant candidate honey bee miRNAs were identified computationally; several of them appear to have previously unrecognized orthologs in the <it>Drosophila </it>genome. Several miRNAs showed caste- or age-related differences in transcript abun-dance and are likely to be involved in regulating honey bee development.</p>
Abstract
Background: Non-coding microRNAs (miRNAs) are key regulators of gene expression in
eukaryotes. Insect miRNAs help regulate the levels of proteins involved with development,
metabolism, and other life history traits. The recently sequenced honey bee genome provides an
opportunity to detect novel miRNAs in both this species and others, and to begin to infer the roles
of miRNAs in honey bee development.
Results: Three independent computational surveys of the assembled honey bee genome identified
a total of 65 non-redundant candidate miRNAs, several of which appear to have previously
unrecognized orthologs in the Drosophila genome. A subset of these candidate miRNAs were
screened for expression by quantitative RT-PCR and/or genome tiling arrays and most predicted
miRNAs were confirmed as being expressed in at least one honey bee tissue. Interestingly, the
transcript abundance for several known and novel miRNAs displayed caste or age-related
differences in honey bees. Genes in proximity to miRNAs in the bee genome are
disproportionately associated with the Gene Ontology terms 'physiological process', 'nucleus' and
'response to stress'.
Conclusion: Computational approaches successfully identified miRNAs in the honey bee and
indicated previously unrecognized miRNAs in the well-studied Drosophila melanogaster genome
despite the 280 million year distance between these insects. Differentially transcribed miRNAs are
likely to be involved in regulating honey bee development, and arguably in the extreme
developmental switch between sterile worker bees and highly fertile queens.
Published: 1 June 2007
Genome Biology 2007, 8:R97 (doi:10.1186/gb-2007-8-6-r97)
Received: 11 August 2006
Revised: 13 December 2006
Accepted: 1 June 2007
The electronic version of this article is the complete one and can be
found online at />R97.2 Genome Biology 2007, Volume 8, Issue 6, Article R97 Weaver et al. />Genome Biology 2007, 8:R97
Background
MicroRNAs (miRNAs) play pivotal roles in diverse biological
processes through post-transcriptional regulation of gene
expression. These short (approximately 22 nucleotide (nt))
non-coding RNAs repress protein synthesis by binding to
partially complementary sites in the 3' untranslated regions
(UTRs) of target genes [1-3]. MiRNAs affect biological phe-
nomena such as cell proliferation, embryo and tissue differ-
entiation [4], morphological change [5], and apoptosis, aging
and life span [6]. Overall, miRNAs appear to regulate much of
the coding transcriptome, influencing the spatial and tempo-
ral expression patterns of thousands of genes in plants, nem-
atodes, insects, and vertebrates [7,8]. The pervasive influence
of miRNAs exerts strong selective pressures on nucleotide
sequences. Either positive selection for, or negative selection
against, miRNA target sites can be detected in the 3' UTRs of
most genes [9,10].
MiRNA sequences are often, but not invariably, highly con-
served across great evolutionary distances, allowing identifi-
cation of nearly identical short oligonucleotides that affect
gene expression in species as divergent as worms and man
[11]. This extraordinary sequence conservation may be indic-
ative of extraordinary functional conservation, or some other
exceptional evolutionary constraint. For instance, because a
single miRNA may regulate hundreds of genes, mutation of a
mature miRNA sequence could pleiotropically affect the
expression breadth and specificity of many gene targets [12].
Thus, preservation of miRNA function in the wake of miRNA
mutation would require coordinated compensatory mutation
of each of its target's 3' UTRs - predicted to be an exceedingly
rare confluence of events. Consequently, the sequence, struc-
ture and some functions of miRNAs may be conserved [13],
while the specific gene targets and regulatory networks of
particular miRNAs may exhibit significant interspecies varia-
tion [14].
The recently sequenced honey bee genome [15] provides an
opportunity to detect novel miRNAs in this species and oth-
ers, and to begin to infer the roles of miRNAs in key life his-
tory traits of honey bees, such as the development of fertile as
well as sterile ('worker') individuals. Here we present the
results of three independent computational surveys and tran-
scriptional evidence for known and novel miRNAs. We sug-
gest several novel miRNA candidates in honey bees. Some of
these novel miRNAs appear to have been overlooked in anal-
yses of the well-studied insect Drosophila melanogaster and
other genomes.
Results
Computational identification of putative miRNAs
We exploited the whole genome assembly of the honey bee to
predict candidate miRNAs. Three non-exclusive sets of
miRNA candidates were compiled. First, honey bee
sequences homologous to miRNAs listed in miRBase [16]
were identified (HOM). Second, microconserved-sequence
elements (MCEs), continuous sequences of lengths 22
through 29 nt that are common to and precisely conserved in
all three of the Apis mellifera, D. melanogaster and Anophe-
les gambiae genomes, were catalogued [17].
Finally, slightly longer bee sequences (75-90 nt) sharing
structural features characteristic of miRNAs and aligning well
with similar sequences in Drosophila - an approach we call
stem-loop scanning (SLS) - identified another set of putative
honey bee miRNAs. This approach does not simply flag
regions with propensity to form stem loop structures of
appropriate length because there are thousands of such
regions in the 235 Mb of the sequenced honey bee genome.
Instead, Smith-Waterman alignments to regions of the Dro-
sophila genome likely to form pre-miRNA structures were
used to filter and refine the list of putative SLS candidates in
honey bee.
Each putative miRNA precursor (pre-miRNA) identified by
any method was folded to verify the thermodynamic propen-
sity of the pre-miRNA sequence to adopt appropriate hairpin
secondary structure - and to verify that the mature miRNA
resided in the stem of the hairpin. We identified putative
canonical honey bee miRNAs, but the MCE and SLS methods
also suggested a number of possible new miRNAs, present
but previously unrecognized in other genomes.
Consolidation of output from the MCE and homology-based
miRNA search methods provided a final set of 65 unique
miRNA candidate loci with 66 unique predicted miRNA mod-
els for experimental evaluation - including the best 25 predic-
tions generated by MCE. This final set of 65 miRNA loci
included 6 putative miRNAs identified by either homology or
MCE methods, but also by the SLS process. However, none of
the candidates identified only by SLS were among the final set
of 65, or tested for expression in this study. Honey bee
miRNA candidates, including some potentially novel miRNAs
and a few honey bee orthologs of known miRNAs, are listed in
Additional data file 1. There were two variant mature and pre-
cursor miRNA models predicted by MCE and HOM for one of
the predicted miRNA loci. For each candidate honey bee
miRNA model, Additional data file 1 gives the prediction
method (HOM, MCE and/or SLS), miRBase designation if
available, sequences of the putative mature honey bee miRNA
and putative precursor region, genomic coordinates of each
occurrence of mature and putative precursor miRNA
sequences within the bee genome assembly release 4, location
relative to coding sequence (CDS) of the honey bee official
gene set [18] (intergenic, intronic, or overlapping a CDS), GC
content of the GC content domain in which the miRNA is
embedded (described in [15]), and folding energies. Folded
precursors for some of the novel miRNAs are shown in Addi-
tional data file 8.
Genome Biology 2007, Volume 8, Issue 6, Article R97 Weaver et al. R97.3
comment reviews reports refereed researchdeposited research interactions information
Genome Biology 2007, 8:R97
Validation of honey bee miRNA candidates by RT-PCR
A variety of techniques are available for miRNA detection and
validation, including hybridization techniques such as North-
ern blots and techniques using PCR (reviewed in [19]). We
employed the RT-PCR technique described by Shi and Chang
[20] to verify transcription of many of the candidate honey
bee miRNAs we describe. In brief, this protocol invokes the
polyadenylation of extracted RNA (in our case, after size-
selection for small RNA species by either glass-fiber substrate
binding or separation using polyacrylamide gel electrophore-
sis) followed by reverse-transcription primed by a poly(T)
adapter. MiRNA-specific forward primers are then paired
with a primer complementary to the RT adaptor for quantita-
tive PCR amplification.
Table 1 shows normalized expression levels across a pool of
larvae and adult bee samples for 30 candidate miRNAs. Some
candidates were queried with multiple primers in order to
test for strand-based expression and to distinguish between
expression of precursor and mature miRNA sequences, lead-
ing to a total of 45 presented primers. Another 23 primers
either generated artifactual PCR products in water or one-
primer controls, or failed tests of amplification linearity. In
general, candidates tested with forward and reverse primers
showed much higher expression of one strand. As a method-
ological control showing strand specificity, primers for two
variants of U4 spliceosome RNA (C5581a and C5581b)
showed strong expression in the predicted reverse direction
while a forward-oriented primer for C5581b showed almost
no expression. Expression for this locus was marginal when
the narrow (enriched for 18-30 nucleotide (nt) species) RNA
pool was queried. Primers that matched mature miRNAs
tended to generate stronger signal, especially when testing
the gel-purified (18-30 nt) RNA extractions. Alignments of
the tested primers to candidate miRNAs appear in Additional
data file 2 and a gel showing quantitative RT-PCR (qRT-PCR)
products from the 18-30 nt size selected RNA is found in
Additional data file 9.
We found 25 potentially novel miRNAs by MCE, of which 17
were tested by qRT-PCR. Twelve of these were expressed in
one or more tissues, stages, castes or pooled RNA samples,
while four had no detectable expression (C2327, C4131,
C5267 and C6617). Nevertheless, three of the RT-PCR nega-
tive candidates showed evidence of transcription in the tiling
array data (C4131, C6617 and C5267).
C5152a and C5152b are discrete miRNA predictions in physi-
cal proximity on opposite strands (shown in Additional data
file 1) and both yield good hairpin predictions (Additional
data file 8). C5152b is similar, but not identical, to Drosophila
dre-ame-190. :
Expression of C5152a and C5152b by RT-PCR
was tested using multiple primers, and both F- and D+ prim-
ers showed expression (Additional data file 3). Primers F- and
D+ were designed to amplify the mature miRNAs predicted
for C5152a and C5152b, respectively (Additional data file 2).
However, the complex overlap and antisense orientation of
these two predictions, and binding sites for both F- and D+
within each of C5152a and C5152b, prevent us from excluding
the possibility that only one is actually expressed in both
sense and antisense orientations.
Overall, we provide evidence of transcription for most of the
novel MCE predictions, including roughly two-thirds of novel
candidates amenable to RT-PCR testing. Predicted expres-
sion levels were correlated between assays involving RNA
extracts biased toward small species using either selective
precipitation or electrophoretic separation (Table 1; Addi-
tional data file 3). Additional candidates will likely be con-
firmed as having transcription using other techniques and
honey bee tissues or life stages.
Validation of miRNA candidates by whole genome
tiling array
We also analyzed the results of two whole-genome honey bee
tiling array experiments for evidence that our candidate miR-
NAs were expressed. Using RNA pooled from multiple tissues
and stages, genome-wide transcription, including intergenic
regions, was evaluated by hybridization to 36-mer probes.
Two strand-specific 36 nt oligonucleotide probes for every 46
bp of the honey bee genome were arrayed. The whole genome
tiling array was hybridized in two separate experiments with
two different pooled polyadenylated RNA samples; but the
second experiment contained pooled RNA enriched for brain
and thorax.
For each candidate miRNA, tiling probes in a genomic region
containing its precursor sequence flanked by 50 bases on
both 5' and 3' ends were examined. A miRNA was considered
expressed if at least one probe within the chosen region meas-
ured signal above 90% of all tiling probes from the entire
genome. Twenty-six miRNAs, listed in Additional data file 6,
measured strong signal in either of the tiling array
experiments and six in both. Among the latter six, C4222,
C6617 and ame-mir-100 exhibited differential signal strength
in the two tiling array experiments.
Tiling array experiments measure genome-wide expression
patterns in an unbiased manner. In several organisms, sig-
nals from tiling arrays were observed in numerous noncoding
regions of the genome, suggesting the presence of noncoding
RNA, including tRNAs. Notably, tRNAs are approximately
the same size as miRNA precursors [21]. However, neither
pre-miRNAs nor mature miRNAs will be polyadenlylated.
Thus, use of polyA RNA in these experiments therefore biased
the RNA samples against mature miRNAs. Consequently,
failure of some RT-PCR validated miRNAs to be detected as
tiling array signals is not surprising. Conversely, there was
difficulty in assigning statistical significance to the observed
tiling array signals because the array experiments were
designed to detect longer protein-coding genes. Therefore,
there were too few probes (approximately 3-4) for each
R97.4 Genome Biology 2007, Volume 8, Issue 6, Article R97 Weaver et al. />Genome Biology 2007, 8:R97
miRNA precursor, and typically only one of these probes
showed strong signals. The significance of tiling array results
is higher for the six miRNAs displaying strong signals in both
experiments A and B, and for the twelve miRNA candidates
that also exhibited RT-PCR results consistent with transcrip-
tion. However, differential signal for three of the tiling array
positive miRNA candidates suggests that those miRNAs
(C6617, C4222 and ame-mir-100) may have roles in bee brain
or thorax.
Table 1
Description of tested miRNAs
Locus miRBase ID Primer ID Orientation Location Expression (not size selected) Expression (size selected)
ame-mir-1 ame-mir-1 ame-mir-1.F F M 0.06 N/A
ame-mir-1 ame-mir-1 amir1.F F P 1.05 1.28
ame-mir-124 ame-mir-124 miR-124M351 F M 2.09 0.69
ame-mir-124 ame-mir-124 miR-124M351R R M 0.40 0.07
ame-mir-2-1 ame-mir-2-1 ame-mir-2+.F F M 7.81 13.55
ame-mir-2-2 ame-mir-2-2
ame-mir-2-3 ame-mir-2-3
ame-mir-2-1 ame-mir-2-1 mir-2:1.1:101712.F F P 0.06 0.02
ame-mir-278 ame-mir-278 ame-mir-278.F F M 0.37 0
ame-mir-7 ame-mir-7 ame-mir-7.F F M 17.95 3.16
ame-mir-7 ame-mir-7 miR-7M112R F M 0.06 N/A
ame-mir-9a ame-mir-9a ame-mir-9a.F F M 23.69 9.58
ame-mir-9b ame-mir-9b ame-mir-9b F M 0.64 1.95
ame-mir-iab-4 ame-mir-iab-4 ame-miriab4.F F P 0.24 0.06
ame-mir-10 ame-mir-10 ame-miR-10 F M 0.09 N/A
ame-mir-279 ame-mir-279 miR-279M341 F M 5.53 1.04
ame-mir-279 ame-mir-279 miR-279M341R R M 0.56 N/A
ame-mir-283 ame-mir-283 HCmir-283.F F M 23.69 17.88
ame-mir-71 ame-mir-71 miR-71.R R M 1.70 1.38
ame-mir-87-2 ame-mir-87-2 mir-87:13.12:403730.F F P 0.43 0.91
ame-bantam ame-bantam banM365 F M 0.16 0.06
C1504 ame-mir-925 C1504.F F M 0.11 0.30
C2989 ame-mir-926 C2989.F F M 31.25 N/A
C3345 ame-mir-927 contig3345.R R M 0.17 3.63
C4222 ame-mir-928 C4222.F F M N/A 3.39
C5152a ame-mir-190* C5152a.F F O3 0.52 0.64
C5152a ame-mir-190* D+ R O 1.29 0.20
C5152b ame-mir-190 C5152b.F F P 0 0
C5152b ame-mir-190 F- R P 76.96 25.28
C5303 ame-mir-137 C5303.F F O3 2.96 0.74
C5303 ame-mir-137 C+ R O3 0.15 0.02
C5560 ame-mir-929 C5560.F F O 955,568 45,073
C5560 ame-mir-929 A- R O3 0.01 0
C5560 ame-mir-929 C5560.R R M 0.00 0
C5599 ame-mir-930 C5599b.F F M 0.54 0.08
C689 ame-mir-932 amir1.R F M 0.23 0.28
C689 ame-mir-932 contig689.F F P 20.62 N/A
C689 ame-mir-932 C689.F R M 0.16 N/A
C689 ame-mir-932 E+ R M N/A 1.69
C2187
†
C2187.F F M 0.98 N/A
C2370
†
C2370.F F M 8.37 N/A
C5581a
‡
C5581a.R R M 20.62 N/A
C5581b
‡
C5581b.F F M 0.07 0
C5581b
‡
C5581b.R R M 22.10 N/A
Orientation is on predicted miRNA (F, forward; R, reverse). Location is within: mature miRNA (M); precursor sequences (P); overlapping mature miRNA with 3' primer end
within mature sequence (O); overlapping mature miRNA but with 3' primer end in precursor (O3). Expression levels for pooled queen and worker samples are described in
the text. The last two columns are normalized expression estimates for pooled RNA that either had or had not been size-selected by PAGE to include sizes from 18-30 nt.
*C5152a is the reverse complement of ame-mir-190.
†
C2187 and C2370 met thermodynamic criteria, but did not meet miRBase folding criteria.
‡
Denotes U4 spliceosome
RNA. The expression levels are scaled to the average of all primers.
Genome Biology 2007, Volume 8, Issue 6, Article R97 Weaver et al. R97.5
comment reviews reports refereed researchdeposited research interactions information
Genome Biology 2007, 8:R97
Caste-, tissue- and age-related miRNA expression
correlations
We hypothesized that miRNAs might be involved in the dra-
matic developmental fate changes associated with the switch
from a reproductive female to a sterile worker female caste.
Accordingly, RNA was isolated from various tissues and
stages of both queen and worker honey bees and character-
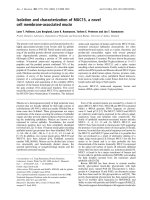
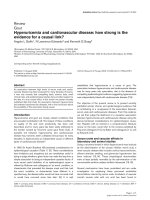
ized by RT-PCR. Figure 1 and Additional data file 10 contrast
expression levels for a subset of the candidate miRNA loci in
adult head, thorax, abdomen and whole pupae, for both
queens and workers. Several candidates showed differential
expression between queens and workers in the abdomen,
arguably the body part that is physiologically most distinct
between these castes due to their different fecundity. Candi-
date loci ame-mir-9a, C3345, and C5152 were more strongly
expressed in worker abdomens, while C1504 and ame-mir-71
were more strongly expressed in queen abdomens. Ame-mir-
71 also had far stronger expression in developing (pupal)
workers than in queens and in worker thoraces. A more com-
plete summary of RT-PCR experiments for this subset is
shown in Additional data file 4. In agreement with our
hypothesis that computationally predicted honey bee miR-
NAs could be implicated in bee development, and particularly
in the changes that characterize alternative fates of worker
and queen, many miRNAs display tissue, stage or caste-
related expression patterns. Additional data files provide the
values of RT-PCR transcription estimates for pooled RNA
(Additional data file 3) and additional queen/worker samples
(Additional data file 4), primer sequences employed for
experimental evaluation (Additional data file 5), and align-
ments of the primers to the precursor sequences (Additional
data file 2).
Intronic miRNAs and host genes
MiRNAs are often clustered within the genomes of mammals
and flies, and this clustering is often associated with co-tran-
scription of miRNAs and genes with which they are in close
proximity [22]. The co-transcription of miRNAs and nearby
genes may also reflect coordinate regulation of miRNAs and
nearby genes. In particular, intronic miRNAs are often,
though not invariably, coordinately expressed with their host
gene and transcribed as a single primary transcript [23]. In
support of the postulated role of miRNAs in regulating the
alternative developmental trajectories associated with caste
differentiation, we examined the functional role of honey bee
official gene set genes in which intronic honey bee miRNAs
are embedded [18]. Given the paucity of direct functional evi-
dence for most genes in honey bees, we relied upon a compre-
hensive set of computational orthologs described elsewhere
[15]. We discovered several notable relationships that will
merit additional investigation. First, there were associations
with fundamental cellular machinery of growth and develop-
ment. Ame-mir-34, ame-mir-277 and ame-mir-317 all occupy
intron 3 of GB10191. GB10191 is the ortholog of Rbp8 in Dro-
sophila, and RPB8 in humans - part of the RNA polymerase
II core complex and intimately involved in all transcriptional
activity. Similarly, ame-mir-279 is embedded within intron 3
of GB12486, the honey bee DNA polymerase-α primase.
Intriguingly, the functional processes of other genes hosting
intronic miRNAs suggest some bee miRNAs may be impli-
cated in important but more complex caste differences. For
instance, novel candidate miRNA C689 is found within
GB10066, the bee ortholog of neuroligin, implicated in nerv-
ous system development. Novel miRNA C1504 is embedded
in GB11212, whose Drosophila ortholog is involved in the dor-
sal/ventral patterning, expressed in wing discs, and nega-
tively regulated by Ultrabithorax. Candidate C5267 is
contained in GB15446, whose Drosophila homologs are regu-
lators of transcription from RNA polymerase II promoters,
and involved in eye development and other morphogenic
interactions. Novel candidate C5599 is found within
GB14516, the ortholog of Dll (Distalless), which has transcrip-
tion factor activity and is intimately involved in proximal/dis-
tal pattern formation and morphogenesis, especially
antennae and genitalia formation. Bee miRNAs may also be
involved in programming behavioral response repertoires, as
GB15597 harbors miRNA C4222, and its fly ortholog is eag,
implicated in behavioral responses, including sensory per-
ception of smell and flight.
Gene Ontology analysis
We reasoned that an analysis of overrepresented Gene Ontol-
ogy (GO) [24] terms associated with genes near miRNAs
might offer additional insights into function for some bee
miRNAs, and allow us to examine broad patterns of func-
tional conservation between bee miRNAs and Drosophila
miRNAs. We first determined the GO slim terms (a more gen-
eral subset of GO terms) associated with the Drosophila
ortholog of each bee gene [15]. Then using GeneMerge [25],
we determined GO slim terms that were overrepresented
among the set of bee genes occurring <10, <20, <50 or <100
kb from a predicted mRNA, compared with the set of all bee
genes with Drosophila orthologs. Because some bee genes
have multiple orthologs to Drosophila, and to ensure that our
GO enrichment analysis was not biased by random selection
of one to many fly orthologs of bee gene near miRNAs, we per-
formed ten GeneMerge replicate experiments at each dis-
tance and report only GO terms whose Bonferroni corrected
E-socres were less than 0.05 in all ten replicates.
GO analysis revealed the following: 'Physiological process' as
the only GO term overrepresented among genes <10 kb from
bee miRNAs in every replicate experiment; 'Response to
stess' overrepresented in every replicate experiment for genes
<20 kb from bee miRNAs; no GO term overrepresented in
every replicate <50 kb from bee miRNAs; 'Nucleus' overrep-
resented in every replicate <100 kb from bee miRNAs. Run-
ning GeneMerge on a negative control set consisting of
randomly selected bee genes yielded no GO terms with signif-
icant Bonferroni corrected E-scores.
R97.6 Genome Biology 2007, Volume 8, Issue 6, Article R97 Weaver et al. />Genome Biology 2007, 8:R97
Figure 1 (see legend on next page)
Worker
Queen
10
100
1000
Relative abundance
Head
Thorax
Abdomen
Pupa
Tissue
Ame-mir-9a.F
0.1
1
Head
Thorax
Abdomen
Pupa
Tissue
miR-71.R
0.01
Relative abundance
0.001
0.01
0.1
1
10
100
1000
Head
Thorax
Abdomen
Pupa
F- (C5152a )
Relative abundance
Tissue
1
10
100
Head
Thorax
Abdomen
Pupa
Contig3345.R
Relative abundance
TissueTissue
Relative abundance
10
100
1000
Head
Thorax
Abdomen
Pupa
Ame-mir-2+.F
Tissue
1
10
100
Head
Thorax
Abdomen
Pupa
Relative abundance
C1504.F
Genome Biology 2007, Volume 8, Issue 6, Article R97 Weaver et al. R97.7
comment reviews reports refereed researchdeposited research interactions information
Genome Biology 2007, 8:R97
To compare GO terms associated with these miRNAs in bee
and fly, we conducted a similar analysis of Drosophila genes
near miRNAs. We obtained GO slim terms associated with
Drosophila genes occurring <10, <20, <50 or <100 kb from
Drosophila orthologs of these bee miRNAs, and ran Gene-
Merge to find overrepresented GO terms. As before, only GO
terms whose Bonferroni corrected E-scores were less than
0.05 in all ten replicate experiments are reported. The GO
experiment data are summarized in Additional data file 7.
Interestingly, the GO term 'Physiological process', which was
overrepresented among bee genes <10 kb from miRNAs was
also overrepresented among Drosophila genes <20, <50 and
<100 kb from miRNAs. As before, running GeneMerge on a
negative control set consisting of randomly selected Dro-
sophila genes yielded no GO terms with significant Bonfer-
roni corrected E-scores.
Compared to bee, there were far more GO terms that were sig-
nificantly enriched among genes near miRNAs in the Dro-
sophila genome. For example, four GO slim terms
('Development', 'Morphogenesis', 'RNA binding' and 'Signal
transduction') were overrepresented in all replicates at every
distance in Drosophila, and there were 29 GO terms signifi-
cantly enriched among genes <100 kb from fly miRNAs
(Additional data file 7). In contrast, in the bee genome, there
were no GO terms enriched at every distance, and only 1 GO
term ('Nucleus') enriched among genes <100 kb from bee
miRNAs. This disparity between bee and Drosophila is likely
caused by the increased sensitivity in the Drosophila experi-
ment compared to the bee experiment. The Drosophila
experiment used Drosophila GO annotations directly,
whereas the bee experiment relied on the existence and detec-
tion of Drosophila orthologs for each bee gene.
Discussion
The honey bee genome [15] offers a rich resource for investi-
gation of the genomic networks and emergent systems that
characterize sociality and enable coherent operation of the
complex web of interactions in the hive. However, the signif-
icant level of sequence divergence of honey bee from Dro-
sophila and mosquito, and the absence of closely related
genome sequences suitable for phylogenetic shadowing can
impede genomic comparisons involving bees. We turned evo-
lutionary distance to our advantage, reasoning that strongly
conserved sequences in an appropriate length range (MCEs)
might represent previously undiscovered miRNAs (the MCE
algorithm) [17]. In addition, we exploited the secondary
structure characteristics of most confirmed miRNAs, and the
conservation of core microprocessor components in bee, like
Drosha, to identify other candidates that would adopt pre-
miRNA hairpin structures, and produce significant Smith-
Watermann alignments between putative bee and Drosophila
miRNAs (the SLS algorithm).
Among those novel miRNA predictions we tested, we
observed only one false positive candidate identification by
MCE. C5581 was predicted as a miRNA, but that sequence is
homologous to a U4 splicing RNA. There was one case in
which two methods predicted slightly different miRNAs at
overlapping genomic coordinates. Mature ame-mir-137,
identified by HOM, is completely identical over the 22 nt that
it overlaps with the 27 nt of mature C5303, predicted by MCE.
We observed two cases where different miRNA predictions
occurred at overlapping genomic coordinates, but the oppo-
site strand: C5152a/C5152b (primers F- and D+) and ame-
mir-9b/ame-mir-79. In both cases, at least one of the oppos-
ing strand pair was identical or similar to a known mature
miRNA. Predicted ame-miR-9b and ame-mir-79 are identical
to known miRNAs. Predicted mature C5152b is similar, but
not identical to Drosophila dme-mir-190; C5152b is longer
than dme-mir-190, and differs at only three nucleotides inter-
nally. These may be examples of miRNA sense/antisense
transcription.
The SLS output contained five predictions with significant
similarity to the HOM output (ame-mir-13a, ame-mir-276,
ame-mir-305, ame-mir-92 and ame-mir-9a) and only two
predictions with significant similarity to the top 25 MCE can-
didates, both of which were variants of C5152. Of these SLS
predictions, only ame-mir-9a and C5152 were tested for
expression by RT-PCR, and both were validated. The tiling
array evidence we accumulated also suggests that mir-305 is
expressed. The SLS output included several novel pre-miRNA
predictions that contained apparent repeat motifs and are
unlikely to be true miRNAs. However, other SLS candidates
may represent new miRNAs and future experiments will
more systematically assess evidence of expression for some of
them.
We detected transcription of mature miRNAs as well as some
pre-miRNAs. Generally, putative mature miRNA transcript
abundance exceeded the level of precursor transcripts. Prim-
ers for mature miRNAs also tended to show the strongest
effects of transcript direction (for example, ame-mir-279;
Table 1), and retained strand-specific expression levels when
the 18-30 nt RNA pool was assayed. Nevertheless, tests at a
number of candidate miRNAs indicated fairly similar (<5-
fold difference) transcription levels for both RNA strands (for
example, ame-mir-1). Due to the small sample sizes, we have
highlighted only the more extreme expression differences,
although, as has been shown in expression studies of protein-
Normalized expression across worker and queen samples for six miRNA candidatesFigure 1 (see previous page)
Normalized expression across worker and queen samples for six miRNA candidates. Values indicate relative expressions levels as log
10
scale, with SD for
three sample replicates, as described in the text. Primer IDs are indicated.
R97.8 Genome Biology 2007, Volume 8, Issue 6, Article R97 Weaver et al. />Genome Biology 2007, 8:R97
encoding transcripts in bees, even subtle differences in tran-
script abundance could play important roles in development.
It is possible that actual mature miRNA for those candidates
that did demonstrate expression may differ slightly from the
mature miRNA we predicted. For example, a variant of the
primer for candidate ame-mir-7 (ame-mir-7.F) indicated a
very strong transcript level, while a primer with one more 3'
nucleotide (T; miR-7M112R) gave no product. Thus, we
showed that our RT-PCR technique was very sensitive to
small primer sequence differences, as shown in plant miR-
NAs by Shi and Chang [20].
Likewise, the strongest expression product observed
(C5560F) was primed by a forward primer that stopped one
base short of the 5' end of the predicted mature miRNA (Addi-
tional data file 2). Because it is possible that the actual novel
mature miRNA sequences may differ slightly from the
sequence of the candidate mature miRNA primers we tested,
we cannot unequivocally reject those candidate miRNAs for
which we did not obtain reproducible expression patterns.
Honey bee genomic study is still young, but initial observa-
tions offer some clarity and focus for further investigation.
First, with a few notable exceptions (for example, odorant
receptor genes and genes involved with innate immunity),
there are as yet few potential relationships between gross
genomic features and the social organization of bees [15]. In
fact, the emergence of social life and its manifestation in bees
may rely mainly on fairly subtle genomic interactions that
affect gene network organization, regulation and expression
patterns. In support of this hypothesis, previous work sug-
gests that the development of distinct reproductive castes
(workers and queens) in honey bees reflects the differential
regulation of well-established developmental genes, rather
than that of a parallel set of caste-specific genes [26,27].
We submit that miRNAs and their combinatorial interactions
with overlapping and independent target gene sets may offer
a tractable means to aid the evolution of sociality, by stabiliz-
ing the alternative developmental programs that generate
distinct castes from a uniform genetic groundplan. Thus, the
evolution of distinct reproductive and sterile castes might
proceed from the loss or acquisition of miRNA binding sites
in the 3' UTRs of particular genes by drift or selection, cou-
pled with divergent temporal or spatial expression of miRNAs
between workers and queens. In fact, it has recently been sug-
gested that miRNAs may be understood as contributing to
canalization and genetic buffering of gene regulatory net-
works by interacting with transcription factors in coherent
and incoherent feed-forward loops to stabilize phenotypic
variability [28]. However, we need not posit that miRNAs act
as direct switches for differential developmental pathways.
The same canalizing effect could be achieved with miRNAs
acting as global regulators of tissue identity and gene expres-
sion breadth and specificity. Indeed, the properties that make
miRNAs attractive candidates as stabilizers of phenotypic
variability would also allow miRNAs to modulate emergence
of different phenotypes upon alternative spatial or temporal
expression in different castes. Two candidates showed espe-
cially strong expression differences between identical tissues
from bee queens and workers (Figure 1). Ame-mir-9a.F was
expressed most strongly in worker versus queen thorax and
abdomen. Candidate 5152a was overexpressed in queen ver-
sus worker head, then showed the opposite pattern in the
abdomen.
We also present many unrecognized miRNAs in honey bee
and show that some of them, as well as other canonical miR-
NAs, appear to be transcribed in a stage-, tissue- or caste-spe-
cific manner (Figure 1). In fact, the genomic location of many
of the most strongly caste, stage or tissue biased miRNAs,
coupled with known functional activities of some miRNAs in
other species, orders and phyla, allow inferences regarding
the roles these caste- or stage-biased miRNAs may play in
honey bees. For instance, we find that ame-mir-9a is among
the most strongly caste-biased miRNAs, with much higher
expression levels in adult worker thorax and abdomen than
similar queen tissues, but higher levels of mir-9a occur in
queen pupae (Figure 1). Interestingly, mir-9a controls sen-
sory organ precursors (SOPs) in Drosophila, with loss of mir-
9a function resulting in ectopic production of SOPs, while
overexpression of mir-9a yields a severe diminution of SOPs.
Mir-9a is also expressed at high levels in epithelial cells adja-
cent to SOPs in proneural clusters, suppressing sens through
miRNA/target interactions in the sens 3' UTR, and inhibiting
neuronal fate in non-SOP cells [29]. This suggests possible
roles for ame-mir-9a in influencing caste differences in honey
bees. Another example is C1504.F, which is expressed in
higher levels in queens than workers (Figure 1) and is nested
within the honey bee ortholog of the RNA binding protein
gene, CG32062. Expression of CG32062 in Drosophila is
dependent upon Notch-mediated signaling from the Dorso-
Ventral organizer (D/V) boundary, and repressed by the
homeotic gene, Ultrabithorax. The product of CG32062 likely
constitutes a second long-range D/V morphogen, independ-
ent of Wingless (Wg) [30]. MiRNAs in other organisms are
often organized in clusters that lie in physical proximity in the
genome, and may be present in multiple copies too. In D. mel-
anogaster, the proapoptotic K-box miRNA mir-2, and mir-13
occur jointly. The same relationship holds in bees, and ame-
mir-71 is also present within this same region (Table 1). In
fact, even with a relatively fragmented genome consisting of
over 9,000 scaffolds, we can discern that the honey bee har-
bors several linked sets and/or multiple copies of miRNAs.
They include ame-mir-1, which is near ame-mir-133. We note
that mir-1 and mir-133 are co-located in physical proximity in
organisms as diverse as honey bees, frogs, mice and men, and
are well-documented regulators of myogenesis in other
organisms [31]. Ame-mir-1 and ame-mir-133 may exhibit
similar functions in honey bees. Other examples of clustered
miRNAs or multicopy miRNAs include: novel miRNA C5152a
antisense to C5152b; novel C5303 overlapping ame-mir-137;
Genome Biology 2007, Volume 8, Issue 6, Article R97 Weaver et al. R97.9
comment reviews reports refereed researchdeposited research interactions information
Genome Biology 2007, 8:R97
ame-mir-9b overlapping the ame-mir-79 locus, but on the
opposite strand; ame-mir-12 near ame-mir-283; ame-mir-
275 near ame-mir-305; ame-mir-277 near ame-mir-317 and
ame-mir-34; C1504 near ame-mir-375; and ame-let-7 on the
same scaffold as ame-mir-100. Two of the most interesting
cases involve multiple miRNAs in the introns of single genes.
Ame-mir-277, ame-mir-317 and ame-mir-34 occur in the
same intron of GB10191 - a core component of the RNA
polymerase II complex. Finally, three copies of ame-mir-2,
plus one instance each of ame-mir-13a and ame-mir-71, all
occur within intron 3 of GB15727 - a serine/threonine phos-
phatase lost from Drosophila, but with both vertebrate and
more ancient metazoan orthologs.
That fact that we found three GO terms ('Physiological proc-
ess', 'Nucleus' and 'Response to stress') that were overrepre-
sented among genes near miRNAs in both the Drosophila and
bee genome demonstrates that some miRNAs function in the
same or similar functions in Drosophila and bee. Further-
more, this result allows us to ascribe roles for honey bee miR-
NAs in processes relevant to these GO terms. Future studies
of the specific genes near these miRNAs and annotated with
these GO terms may help elucidate how these miRNAs func-
tion in honey bee.
The sensitivity of the GO experiment in bee was limited by a
number of factors. The GO analysis considers only those bee
genes with recognizable orthologs in Drosophila, and the GO
annotation for bee genes was always based upon functional
evidence from Drosophila. Furthermore, in honey bee, the
GeneMerge E-score for GO terms present in every experiment
varies somewhat depending upon the particular Drosophila
ortholog selected for use in GeneMerge, at least when there is
more than one Drsophila ortholog. While 'Development',
'Morphogenesis', 'RNA binding' and 'Signal transduction'
were overrepresented in every Drosophila experiment at all
distances, there are no GO terms overrepresented in every
bee experiment at each distance. Therefore, we suggest that
the lack of enrichment for these same GO slim terms in the
bee experiment may reflect the lack of a complete gene list in
honey bee, the paucity of direct functional evidence for honey
bee genes, and the reliance upon Drosophila orthology and
GO annotation for bee genes. As honey bee genome annota-
tion and functional genomics proceeds, further GO analysis
may reveal additional functional attributes for honey bee
miRNAs.
Conclusion
Not surprisingly, the honey bee genome contains numerous
candidate miRNAs that can be identified by computational
methods. We show that some honey bee candidates identified
in this way have been overlooked in other genomes. Some
novel and canonical miRNA transcription levels differed
strongly across the tested tissues and samples. Honey bees
and other social insects are defined by a developmental poly-
morphism between highly fertile, long-lived queens and
largely sterile workers. Differences in miRNA expression
observed in homologous tissues of queen and worker may
help provide insights into gene regulation during the remark-
able developmental switch characterizing caste differences in
the honey bee.
Materials and methods
Computational miRNA predictions
Our first strategy for identifying novel miRNAs invoked
BLASTN searches of known miRNAs from miRBase release
8.0 [16] against the honey bee genome (Assembly release 4.0)
using wordsize 7 and E-score threshold ≤0.1. These searches
identified several hundred candidate bee miRNAs with signif-
icant matches to miRNAs from other species. A sliding win-
dow of 110 nt with increments of 3 nt was scanned along the
sequences extracted at 100 nt upstream and downstream of
each match. Windows were scored for folding energy (at least
25 Kcal/mol) using RNAFOLD [32], then for base pairing and
position of putative mature miRNA along the stem. Candi-
dates with at least 16 bases paired to the opposite strand were
considered putative mature regions. Windows that passed
this scoring scheme were visually inspected for proper
folding.
Our second strategy relied on three-way, all against all,
genomic comparisons of D. melanogaster, A. gambiae and A.
mellifera to identify probable honey bee miRNA candidates
[17]. Hundreds of microconserved MCE sequences identified
in this way included more than 40% of previously validated
Drosophila miRNAs, and this set seems likely to contain
additional and novel miRNAs shared by bee and Drosophila.
The secondary structural features of known pre-miRNAs in
Drosophila are expected to be characteristic of novel pre-
miRNAs of bee as well, because the genes involved in process-
ing primary RNA transcripts into mature miRNAs in Dro-
sophila are conserved in honey bee. Consequently, secondary
structures of candidate bee miRNA precursors were screened
for proper folding and thermodynamic stability typical of
Drosophila miRNA precursors, and putative mature miRNAs
were eliminated if they did not lie within the stem regions of
the pre-miRNA hairpins, according to the criteria previously
proposed by Ambros et al. [33]. Ground-state energies and
structures were computed with the Vienna Package [34].
For the third strategy we applied a novel algorithm, SLS, to
the entire honey bee genome to identify sequences that would
adopt appropriate hairpin secondary structure. In the SLS
method, overlapping 100 nt segments of the genome are ana-
lyzed for sequences that can form loops similar to those seen
in known miRNAs. In detail, each 100 nt segment was aligned
to its reverse complement using a modified Smith-Waterman
alignment algorithm (G::T pairing was penalized less than
other mismatches). Good alignments were tested to deter-
mine if they would form a stem and a loop with size typical of
R97.10 Genome Biology 2007, Volume 8, Issue 6, Article R97 Weaver et al. />Genome Biology 2007, 8:R97
known miRNAs. Specifically, stems had to be 20-25 bp, and
loops had to be 4-35 nt. Candidate sequences were then sub-
jected to thermodynamic testing using Mfold [35] to deter-
mine free energy values. Those with folding energies less than
-20 kcal/mole were discarded. This entire process was per-
formed on both the honey bee and Drosophila genomes.
Putative miRNAs from honey bee that aligned well to putative
miRNAs from Drosophila were saved as candidate miRNAs.
Transcriptional analyses: RT-PCR
RNA was extracted and enriched for short transcripts using a
variant of the RNAqueous (Ambion, Austin, TX, USA) proto-
col. Honey bee tissues (head, thorax, and abdomen from
queens and workers, and whole bodies from queen and
worker prepupae) were ground in 200-600 μl lysis grinding
buffer depending on tissue volume. This suspension was
diluted in an equal volume of 64% EtOH and then spun
through the provided filter columns. The flow-through, con-
taining smaller RNA species, was then mixed with a 70% vol-
ume of isopropanol and passed through a second filter
column in order to trap the now-precipitated small RNAs.
After prescribed wash steps, RNA was eluted from this second
column in 50 μl sterile H
2
O. RNA size range and quantity was
estimated using an Agilent 9000 Bioanalyzer (Agilent Tech-
nologies, Santa Clara, CA, USA). A second extraction was car-
ried out as above for queen and worker head, thorax, and
abdomen, as well as third-instar larvae and prepupal bees.
This extraction was separated using a 15% denaturing (TBE-
urea) polyacrylamide gel (Invitrogen, Carlsbad, CA, USA).
RNA species 18-30 nt in length were cut from the gel, eluted
as a group using a FLASHPAGE mini-electrophoresis unit
(Ambion), purified by EtOH precipitation, and resuspended
in 50 μl sterile H
2
O.
Contaminating DNA was removed by exposing 2 μg of each
total RNA pool to 10 U DNaseI with appropriate buffer
(Ambion) in the presence of 20 U RNAsin (Roche, Man-
nheim, Germany). Samples were incubated 1 hour at 37°C,
then 75°C for 15 minutes. Polyadenylated tails were added to
all transcripts using a 15 μl reaction containing 2 μg total
RNA, 2 U E-PAP enzyme with appropriate 1× buffer
(Ambion), 4 mM MnCl
2
, and 1.7 mM ATP. Samples were
incubated at 37°C for 1 hour. cDNA was prepared from 0.4 μg
polyadenylated RNA template in a 15 μl reaction containing
10 pmol oligo-dT linker (5'GCG AGC ACA GAA TTA ATA CGA
CTC ACT ATA GGT
12
VN) and 2 mM dNTP. The reaction was
heated to 70°C for 10 minutes and placed on ice. After pre-
heating to 42°C for 2 minutes, 4 μl of reverse transcriptase
mix, containing 50 U Superscript II in appropriate buffer and
reagents (Invitrogen) was added. Synthesis was carried out at
42°C for 50 minutes, followed by 15 minutes at 70°C.
The above cDNA was diluted 1:5 and used as the template for
amplification in an iCycler real-time PCR thermalcycler (Bio-
rad, Hercules, CA, USA). Gene specific primers for approxi-
mately two thirds of the putative miRNAs were designed
based on the predicted mature or precursor RNA sequences
(Table 1). The 25 μl reaction mixes consisted of 1 U Taq DNA
polymerase with appropriate buffer (Roche), 1 mM dNTP
mix, 2 mM MgCl
2
, 1× SYBR Green dye (Molecular Probes,
Eugene, Oregon, USA), 10 nM Fluorescein calibration dye
(Biorad), and 0.2 μM of each forward and reverse primer. The
thermal program for all reactions was 95°C for 30 s followed
by 40 cycles of (95°C for 30 s, 60°C for 30 s, 72°C for 30 s,
76°C for 10 s immediately after the extension step for fluores-
cence capture). Melt-curve analysis and agarose gel analyses
were used to test whether PCR products were the appropriate
size (gel products 60-80 bp, dissociation temperatures 76-
81°C). In addition, qPCR runs using negative (no template)
templates, as well as miRNA forward primers without the
adaptor primer, were used to exclude primers that showed
signs of spurious amplification (n = 23).
Threshold cycle (C
T
) values for each miRNA were subtracted
from the mean C
T
values for all miRNAs surveyed in a given
cDNA. Amplification efficiency (serial dilution) analyses sug-
gested that these PCR reactions were highly efficient and,
accordingly, relative abundances were calculated as 2
δCT
.
While the low replicate number precludes statistical analyses,
means and standard deviations are presented for the two
sample replicates in order to indicate sample variability.
Gene ontologies of miRNA-regulated genes
To determine the functional categories of bee and fly genes
under control of miRNAs, we looked for GO terms [24] over-
represented among genes in close proximity to putative miR-
NAs in the Drosophila and bee genomes. GO slim terms and
annotations for D. melanogaster genes generated at FlyBase
[36] were obtained from the Gene Ontology Consortium web-
site [37]. GO terms were assigned to genes of the honey bee
Official Gene Set [18] using D. melanogaster orthologs,
which were identified as described by the Honey Bee Genome
Sequencing Consortium 2006 [15]. In cases where more than
one fly ortholog existed for a given bee gene, a random fly
ortholog was selected independently in each replicate experi-
ment. GeneMerge [25] was then run using test sets of genes
<10 kb, <20 kb, <50 kb or <100 kb from putative miRNAs
and their associated GO slim terms, and a population set con-
sisting of all mapped bee genes with fly orthologs (for the bee
experiment) or all mapped fly genes (for the fly experiment).
Ten replicate experiments were conducted for both fly and
bee analyses, and only GO terms whose Bonferroni corrected
E-scores were less than 0.05 in all ten replicate experiments
were considered significantly overrepresented. For negative
control experiments, GeneMerge was run on a test set of ran-
domly selected bee or fly genes equal in number to the set of
bee or fly genes <10, <20, <50 and <100 kb from a putative
miRNA.
Genome Biology 2007, Volume 8, Issue 6, Article R97 Weaver et al. R97.11
comment reviews reports refereed researchdeposited research interactions information
Genome Biology 2007, 8:R97
Additional data files
The following additional data are available with the online
version of this article. Additional data file 1 provides a com-
plete listing of candidate miRNAs, including miRBase desig-
nation, the sequence of the putative mature honey bee
miRNA, the sequences 110 nt up- and downstream of each
mature miRNA candidate (putative precursor region), the
genomic coordinates of each occurrence of mature and puta-
tive precursor miRNA sequences within the bee genome
assembly release 4, whether the candidate miRNA is inter-
genic, intronic, or overlapping a CDS, the GC content of the
GC content domain in which the miRNA is embedded
(described in [15]), and folding energy. Additional data file 2
provides alignments of primers to precursor miRNAs. Double
strands of precursors are shown, with mature miRNA indi-
cated as lower case embedded in the sense strand, which is
otherwise uppercase. Note that reverse primers are shown in
the 3' to 5' direction, to show alignment to the sense strand.
Additional data file 3 provides qPCR expression results from
gel-purified 18-30 nt RNA extractions from pooled tissues
(head, thorax, and abdomen from queens and workers, and
whole bodies from queen and worker prepupae). The ID col-
umn corresponds to gel lanes in part b in Additional data file
9. C
T
is a predetermined threshold at which fluorescence from
PCR products exceeds background fluorescence. Additional
data file 4 provides mean expression values for queen and
worker honey bee tissue-specific samples. Additional data file
5 provides the primers employed in expression analyses, and
expression estimates for pooled samples. Additional data file
6 provides miRNA tiling array probes with hybridization sig-
nal in the top 10% of tiling array results in two independent
experiments. The RNA sample from array B had a higher con-
centration of bee brain and thorax than the first. Additional
data file 7 provides GO analysis of genes located within 10, 20,
50 and 100 Kb of miRNAs. There is a different worksheet con-
taining the results of 10 replicates each, for honey bee and
Drosophila. Each worksheet provides E-score, Bonferroni
Corrected E-score, and GO term. Additional data file 8 shows
folded hairpins for precursors of novel honey bee miRNAs.
Additional data file 9 provides two figures: Figure A shows a
15% PAGE separation of small-enriched RNAs from honey
bee queen head, thorax, and abdomen, and worker head, tho-
rax, and abdomen. RNA sized at 18-30 nt was excised from
the gel and purified for qPCR as described in the text. The left
lane shows a 10 nt RNA size marker, with the 10 nt band at
bottom left. Figure B shows the size variation of PCR products
generated from small-enriched RNA pools and candidate
primers. Most products were approximately 75-90 bp in
length. Alphanumeric label refers to sample ID as described
in Additional data file 3. Additional data file 10 shows nor-
malized expression across worker and queen samples for
additional miRNA candidates. Values indicate relative
expressions levels as log
10
scale, with SD for three sample rep-
licates, as described in the text.
Additional data file 1Complete listing of candidate miRNAsIncludes miR designation, the sequence of the putative mature honey bee miRNA, the sequences 110 bp up- and downstream of each mature miRNA candidate (putative precursor region), the genomic coordinates of each occurrence of mature and putative precursor miRNA sequences within the bee genome assembly release 4, whether the candidate miRNA is intergenic, intronic, or overlapping a CDS, the GC content of the GC content domain in which the miRNA is embedded (described in [15]), and folding energy.Click here for fileAdditional data file 2Alignments of primers to precursor miRNAsDouble strands of precursors are shown, with mature miRNA indi-cated as lower case embedded in the sense strand, which is other-wise uppercase. Note that reverse primers are shown in the 3' to 5' direction, to show alignment to the sense strand.Click here for fileAdditional data file 3qPCR expression results from gel-purified 18-30 nt RNA extrac-tions from pooled tissues (head, thorax, and abdomen from queens and workers, and whole bodies from queen and worker prepupae)The ID column corresponds to gel lanes in part b of Additional data file 9. C
T
is a predetermined threshold at which fluorescence from PCR products exceeds background fluorescence.Click here for fileAdditional data file 4Mean expression values for queen and worker honey bee tissue-specific samplesMean expression values for queen and worker honey bee tissue-specific samples.Click here for fileAdditional data file 5Primers employed in expression analyses, and expression esti-mates for pooled samplesPrimers employed in expression analyses, and expression esti-mates for pooled samples.Click here for fileAdditional data file 6MiRNA tiling array probes with hybridization signal in the top 10% of tiling array results in two independent experimentsThe RNA sample from array B had a higher concentration of bee brain and thorax than the first.Click here for fileAdditional data file 7GO analysis of genes located within 10, 20, 50 and 100 Kb of miRNAsThere is a different worksheet containing the results of 10 replicates each, for honey bee and Drosophila. Each worksheet provides E-score, Bonferroni corrected E-score, and GO term.Click here for fileAdditional data file 8Folded hairpins for precursors of novel honey bee miRNAsFolded hairpins for precursors of novel honey bee miRNAs.Click here for fileAdditional data file 9PAGE separation of small-enriched RNAs from honey bee and size variation of PCR products generated from small-enriched RNA pools and candidate primersFigure A shows a 15% PAGE separation of small-enriched RNAs from honey bee queen head, thorax, and abdomen, and worker head, thorax, and abdomen. RNA sized at 18-30 nt was excised from the gel and purified for qPCR as described in the text. The left lane shows a 10 nt RNA size marker, with the 10 nt band at bottom left. Figure B shows the size variation of PCR products generated from small-enriched RNA pools and candidate primers. Most prod-ucts were approximately 75-90 bp in length. Alphanumeric label refers to sample ID as described in Additional data file 3.Click here for fileAdditional data file 10Normalized expression across worker and queen samples for addi-tional miRNA candidatesValues indicate relative expressions levels as log
10
scale, with SD for three sample replicates, as described in the text.Click here for file
Acknowledgements
We acknowledge funding from NIH 5-P41-HG000739-13, USDA ARS Spe-
cial Cooperative Agreement 58-6204-6-039 and Bee Weaver Apiaries, Inc.
References
1. Lagos-Quintana M, Rauhut R, Lendeckel W, Tuschl T: Identification
of novel genes coding for small expressed RNAs. Science 2001,
294:853-858.
2. Lau NC, Lim LP, Weinstein EG, Bartel DP: An abundant class of
tiny RNAs with probable regulatory roles in Caenorhabditis
elegans. Science 2001, 294:858-862.
3. Lee RC, Ambros V: An extensive class of small RNAs in
Caenorhabditis elegans. Science 2001, 294:862-864.
4. Aboobaker A, Tomancak P, Patel N, Rubin GM, Lai EC: Drosophila
microRNAs exhibit diverse spatial expression patterns dur-
ing embryonic development. Proc Natl Acad Sci USA 2005,
102:18017-18022.
5. Giraldez AJ, Cinalli RM, Glasner ME, Enright AJ, Thomson JM, Basker-
ville S, Hammond SM, Bartel DP, Schier AF: MicroRNAs regulate
brain morphogenesis in zebrafish. Science 2005, 308:833-838.
6. Boehm M, Slack F: A developmental timing microRNA and its
target regulate life span in C. elegans. Science 2005,
310:1954-1957.
7. Brennecke J, Stark A, Russell RB, Cohen SM: Principles of micro-
RNA-target recognition. PLOS Biol 2005, 3:e85.
8. Krek A, Grun D, Poy MN, Wolf R, Rosenberg L, Epstein EJ, MacMe-
namin P, da Piedade I, Gunsalus KC, Stoffel M, Rajewsky N: Combi-
natorial microRNA target predictions. Nat Genet 2005,
37:495-500.
9. Fahr KK, Grimson A, Jan C, Lewis BP, Johnston WK, Lim LP, Burge
CB, Bartel DP: The widespread impact of mammalian micro-
RNAs on mRNA repression and evolution. Science 2005,
310:1817-1821.
10. Stark A, Brenneke J, Bushati N, Russel RB, Cohen SM: Animal
microRNAs confer robustness to gene expression and have
a significant impact on 3'UTR evolution. Cell 2005,
123:1133-1146.
11. Bartel DP: MicroRNAs: genomics, biogenesis, mechanism and
function. Cell 2004, 116:
281-297.
12. Lim LP, Lau NC, Garrett-Engele P, Grimson A, Schelter JM: Micro-
array analysis shows that some microRNAs downregulate
large numbers of target mRNAs. Nature 2005, 433:769-773.
13. Grun D, Wang YL, Langenberger D, Gunsalus KC, Rajewsky N:
MicroRNA target predictions across seven Drosophila spe-
cies and comparison to mammalian targets. PLoS Comput Biol
2005, 1:e13.
14. Lai EC, Tam B, Rubin GM: Pervasive regulation of Drosophila
notch target genes by GY-box-, Brd-box-, and K-box-class
microRNAs. Genes Dev 2005, 19:1067-1080.
15. Honey Bee Genome Sequencing Consortium: Insights into social
insects from the genome of the honeybee Apis mellifera.
Nature 2006, 443:931-949.
16. Griffiths-Jones S, Grocock RJ, van Dongen S, Bateman A, Enright AJ:
miRBase: microRNA sequences, targets and gene
nomenclature. Nucleic Acids Res 2006, 34:D140-144.
17. Tran T, Havlak P, Miller J: MicroRNA enrichment among short
'ultraconserved' sequences in insects. Nucleic Acids Res 2006,
34:e65.
18. Elsik CG, Mackey AJ, Reese JT, Milshina NV, Weinstock GM: Creat-
ing a honey bee consensus gene set. Genome Biol 2007, 8:R13.
19. Berezikov E, Cuppen E, Plasterk HA: Approaches to microRNA
discovery. Nat Genet 2006, 38:S2-S7.
20. Shi R, Chang VL: Facile means for quantifying microRNA
expression by real-time PCR. BioTechniques 2005, 39:519-525.
21. Stolc V, Samanta MP, Tongprasit W, Sethi H, Liang S, Nelson DC,
Hegeman A, Nelson C, Rancour D, Bednarek S, et al.: Identification
of transcribed sequences in Arabidopsis thaliana by using
high-resolution genome tiling arrays. Proc Natl Acad Sci USA
2005, 102:4453-4458.
22. Sempere LF, Sokol NS, Dubrovsky EB, Berger EM, Ambros V: Tem-
poral regulation of microRNA expression in Drosophila mel-
anogaster mediated by hormonal signals and broad-Complex
gene activity. Dev Biol 2003, 259:9-18.
23. Baskerville S, Bartel DP: Microarray profiling of microRNAs
reveals frequent coexpression with neighboring miRNAs and
R97.12 Genome Biology 2007, Volume 8, Issue 6, Article R97 Weaver et al. />Genome Biology 2007, 8:R97
host genes. RNA 2005, 11:241-247.
24. Ashburner M, Ball CA, Blake JA, Botstein D, Butler H, Cherry JM,
Davis AP, Dolinski K, Dwight SS, Eppig JT, et al.: Gene ontology:
tool for the unification of biology. The Gene Ontology
Consortium. Nat Genet 2000, 25:25-29.
25. Castillo-Davis CI, Hartl DL: GeneMerge - post-genomic analysis,
data mining, and hypothesis testing. Bioinformatics 2003,
19:891-892.
26. Evans JD, Wheeler DE: Expression profiles during honeybee
caste determination. Genome Biol 2000, 2:research0001.1-0001.6.
27. Evans JD, Wheeler DE: Gene expression and the evolution of
insect polyphenisms. Bioessays 2001, 23:62-68.
28. Hornstein E, Shomron N: Canalization of development by
microRNAs. Nat Genet 2006, 38:S20-S24.
29. Li Y, Wang F, Lee J-A, Gao F-B: MicroRNA-9a ensures the pre-
cise specification of sensory organ precursors in Drosophila.
Genes Dev 2006, 20:2793-2805.
30. Bajpai R, Sambrani N, Stadelmayer B, Shashidhara LS: Identification
of a novel target of D/V signaling in Drosophila wing disc: Wg-
independent function of the organizer. Gene Expression Patterns
2004, 5:113-121.
31. Rao PK, Kumar RM, Farkhondeh M, Baskerville S, Lodish HF: Myo-
genic factors that regulate expression of muscle-specific
microRNAs. Proc Natl Acad Sci USA 2006, 103:8721-8726.
32. Denman RB: Using RNAFOLD to predict the activity of small
catalytic RNAs. Biotechniques 1993,
15:1090-1095.
33. Ambros V, Bartel B, Bartel DP, Burge CB, Carrington JC, Chen X,
Dreyfuss G, Eddy SR, Griffiths-Jones S, Marshall M, et al.: A uniform
system for microRNA annotation. RNA 2003, 9:277-279.
34. Hofacker IL, Priwitzer B, Stadler PF: Prediction of locally stable
RNA secondary structures for genome-wide surveys. Bioinfor-
matics 2004, 20:186-190.
35. Zuker M: On finding all suboptimal foldings of an RNA
molecule. Science 1989, 244:48-52.
36. FlyBase []
37. Gene Ontology Consortium []