Báo cáo y học: "Evolution of the core and pan-genome of Streptococcus: positive selection, recombination, and genome composition" pdf
Bạn đang xem bản rút gọn của tài liệu. Xem và tải ngay bản đầy đủ của tài liệu tại đây (1.74 MB, 17 trang )
Genome Biology 2007, 8:R71
comment reviews reports deposited research refereed research interactions information
Open Access
2007Lefébure and StanhopeVolume 8, Issue 5, Article R71
Research
Evolution of the core and pan-genome of Streptococcus: positive
selection, recombination, and genome composition
Tristan Lefébure and Michael J Stanhope
Address: Department of Population Medicine and Diagnostic Sciences, College of Veterinary Medicine, Cornell University, Ithaca, NY 14853,
USA.
Correspondence: Michael J Stanhope. Email:
© 2007 Lefébure and Stanhope; licensee BioMed Central Ltd.
This is an open access article distributed under the terms of the Creative Commons Attribution License ( which
permits unrestricted use, distribution, and reproduction in any medium, provided the original work is properly cited.
Streptococcus genome evolution<p>Comparative evolutionary analyses of 26 <it>Streptococcus </it>genomes show that recombination and positive selection have both had important roles in the adaptation of different species to different hosts.</p>
Abstract
Background: The genus Streptococcus is one of the most diverse and important human and
agricultural pathogens. This study employs comparative evolutionary analyses of 26 Streptococcus
genomes to yield an improved understanding of the relative roles of recombination and positive
selection in pathogen adaptation to their hosts.
Results: Streptococcus genomes exhibit extreme levels of evolutionary plasticity, with high levels of
gene gain and loss during species and strain evolution. S. agalactiae has a large pan-genome, with
little recombination in its core-genome, while S. pyogenes has a smaller pan-genome and much more
recombination of its core-genome, perhaps reflecting the greater habitat, and gene pool, diversity
for S. agalactiae compared to S. pyogenes. Core-genome recombination was evident in all lineages
(18% to 37% of the core-genome judged to be recombinant), while positive selection was mainly
observed during species differentiation (from 11% to 34% of the core-genome). Positive selection
pressure was unevenly distributed across lineages and biochemical main role categories. S. suis was
the lineage with the greatest level of positive selection pressure, the largest number of unique loci
selected, and the largest amount of gene gain and loss.
Conclusion: Recombination is an important evolutionary force in shaping Streptococcus genomes,
not only in the acquisition of significant portions of the genome as lineage specific loci, but also in
facilitating rapid evolution of the core-genome. Positive selection, although undoubtedly a slower
process, has nonetheless played an important role in adaptation of the core-genome of different
Streptococcus species to different hosts.
Background
Microbial pathogens show surprising capacity for adaptation
to new hosts, antibiotics, or immune systems. Three principal
mechanisms are regarded as important in this adaptive
potential: Darwinian, or positive selection, favoring the fixa-
tion of advantageous mutations; acquisition of new genetic
material by lateral DNA exchange (that is, recombination);
and gene regulation. Several studies have suggested that
recombination might be the key factor in adaptation of path-
ogens and that the recombination rates of bacteria might be
higher than their mutation rates [1-4]. At the same time, there
is a portion of the genome - the core-genome - that is thought
Published: 2 May 2007
Genome Biology 2007, 8:R71 (doi:10.1186/gb-2007-8-5-r71)
Received: 28 November 2006
Revised: 24 April 2007
Accepted: 2 May 2007
The electronic version of this article is the complete one and can be
found online at />R71.2 Genome Biology 2007, Volume 8, Issue 5, Article R71 Lefébure and Stanhope />Genome Biology 2007, 8:R71
to be representative of bacterial taxa, at various taxonomic
levels [5]. Recent molecular evolution analyses of Escherichia
coli and Salmonella enterica [6,7] have identified genes
under positive selection pressure in the core-genome of these
enteric bacteria. Genome sequence data are now available for
numerous species of several genera of bacteria, providing the
possibility of using comparative evolutionary genomic
approaches to assess positive selection pressure and the role
of horizontal gene transfer in the evolution of the core-
genome of a bacterial genus.
One such important bacterial genus is Streptococcus, which
includes some of the most important human and agricultural
pathogens, causing a wide range of different diseases, and
inflicting significant morbidity and mortality throughout the
world, as well as resulting in significant economic burden.
Twenty six genomes of Streptococcus are available on public
databases belonging to six different species, including S.
pneumoniae, S. agalactiae, S. pyogenes, S. thermophilus, S.
mutans and S. suis. S. pyogenes (Group A Streptococcus;
GAS), is responsible for a wide range of human diseases,
including pharyngitis, impetigo, puerperal sepsis, necrotizing
fasciitis ('flesh-eating disease'), scarlet fever, the postinfec-
tion sequelae glomerulonephritis and rheumatic fever. In
addition, S. pyogenes has recently been associated with
Tourette's syndrome and movement and attention deficit dis-
orders [8]. A resurgence of S. pyogenes infections has been
observed since the mid-1980s. S. agalactiae is another
important human pathogen and is the leading cause of bacte-
rial sepsis, pneumonia, and meningitis in US and European
neonates [9]. Although S. agalactiae normally behaves as a
commensal organism that colonizes the genital or gastroin-
testinal tract of healthy adults, it can cause life threatening
invasive infection in susceptible hosts, such as newborns,
pregnant women, and nonpregnant adults with chronic ill-
nesses [10]. S. agalactiae was first recognized as a pathogen
in bovine mastitis [11]. S. pneumoniae is the leading cause of
human bacterial infection worldwide [12], although paradox-
ically, is primarily carried asymptomatically. It has been an
object of medical study and scrutiny for over a century. S.
mutans is implicated as the principal causative agent of
human dental caries (tooth decay) [13]. S. thermophilus is a
non-pathogenic, food microorganism, widely used in the
dairy product industry. S. suis is responsible for a variety of
diseases in pigs, including meningitis, septicemia, arthritis,
and pneumonia [14]. It is also a zoonotic pathogen that causes
occasional cases of meningitis and sepsis in humans, but has
recently also been implicated in outbreaks of streptococcal
toxic shock syndrome [15].
A recent comparative genomic analysis of five of these above
mentioned streptococcal species (S. suis not included),
focused on understanding the role of lateral gene transfer in
shaping the genomes of each of these lineages, and analyzed
some of the species specific genes for potential adaptive evo-
lution [16]. Species or strain specific loci are often the focus of
attempts to understand adaptive differences in bacteria.
However, with the exception of the Chen et al. [7] study on E.
coli, assessments of adaptive evolution in the core-genome
components of other bacterial species have not been thor-
oughly explored. In addition to individual genome sequences
for several species of Streptococcus, there are also complete
genome sequences available for multiple strains of S. agalac-
tiae, S. pyogenes, and S. thermophilus. Genome wide molec-
ular selection analyses, designed to assess selection pressure
across the entire core-genome of different species and strains
of Streptococcus have not been reported, and also no pub-
lished reports have attempted to address the relative role of
selection versus recombination in the diversification of the
core-genome of Streptococcus.
Along with the burgeoning increase in microbial genome
sequence data there has been a concomitant development of
sophisticated methods for detecting positive selection in pro-
tein coding genes. These methods can be used to compare
orthologous DNA sequence data across the entire genomes of
the available species within the genus Streptococcus. Ziheng
Yang, Rasmus Nielsen and colleagues [17-21] have developed
powerful statistical methods for detecting adaptive molecular
evolution. Their methods compare synonymous and nonsyn-
onymous substitution rates in protein coding genes and
regard a nonsynonymous rate elevated above the synony-
mous rate as evidence for positive or Darwinian selection.
Positive natural selection leads to the fixation of advanta-
geous mutations driven by natural selection, and is the funda-
mental process behind adaptive changes in genes and
genomes, leading to evolutionary innovations and species dif-
ferences. A significant advancement on many earlier meth-
ods, which averaged over sites and time, their methods are
designed to detect positive selection at individual sites and
lineages [20]. Our study employs these powerful selection
methods to assess positive selection pressure across the core-
genome components of the genus Streptococcus, as well as
several species of Streptococcus, while concomitantly assess-
ing levels of recombination within the core-genome.
Concomitant with the identification of bacterial core-
genomes, it has become evident that there is an apparently
dispensable portion of bacterial genomes, consisting of par-
tially shared and strain-specific genes that can, even within a
particular species, represent a surprisingly large proportion
(for example, [22]). The concept of dispensable portions of
genomes implies that genes have been lost and gained since
separation from common ancestors, which in turn implies
that this loss and gain can be estimated from reconstructed
genome composition. This sort of approach has been under-
taken previously, including for a few species of Streptococcus
[23], with one of the resulting conclusions being that gene
gain tends to be much greater than gene loss. An additional
purpose of this paper is to compare gene gain and loss within
and between Streptococcus species, making use of the larger
comparative data set of species and strains now available, and
Genome Biology 2007, Volume 8, Issue 5, Article R71 Lefébure and Stanhope R71.3
comment reviews reports refereed researchdeposited research interactions information
Genome Biology 2007, 8:R71
to compare that history with histories of positive selection
and recombination in the core-genome.
Results
Pan-genome, core-genome, and evolution of genome
composition
The number of protein coding genes per genome within the
various strains and species of Streptococcus is relatively sim-
ilar (ranging from 1,697 to 2,376; Table 1), but the gene com-
position of these genomes is much more variable. Based on
the gene content table obtained by OrthoMCL (Additional
data file 1), three strains of S. agalactiae, S. pyogenes or S.
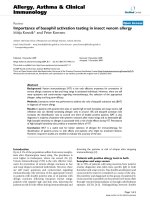
thermophilus share about 75% of their genes, and three dif-
ferent species of Streptococcus share only around half of their
genes (Figure 1). This latter result appears to be independent
of the particular strains or species involved in the comparison
and of their phylogenetic affinities. Even with the inclusion of
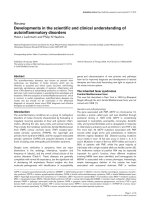
26 genomes, the total number of possible genes - the pan-
genome - of Streptococcus appears not to have been reached,
as depicted in the gene accumulation curve (Figure 2), and we
estimate the Streptococcus pan-genome probably surpasses
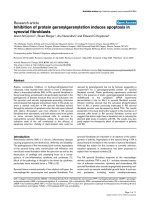
6,000 genes. A surprising 21% of the genes in the pan-
genome of the genus Streptococcus (based on these 26
genome sequences), were represented in only one lineage,
suggesting a remarkable degree of lateral gene transfer in
shaping the genomes of each of these taxa (Figure 3). Within
species, the pan-genome size also remains uncertain,
although our estimates suggest that the pan-genome size of S.
pyogenes is smaller, and better estimated with the currently
available data, than that of S. agalactiae (Figure 2).
In contrast to the pan-genome estimates, the number of genes
in common between the different species within the genus
Streptococcus - the core-genome - appears to reach a plateau
around 600 genes (Figures 2 and 3). Next to the genome spe-
cific genes and the genes shared by only two genomes, the
genes of the core-genome were the third most common genes
(11%; Figure 3), suggesting they form a coherent group. Sim-
ilarly, the estimated core-genome for S. pyogenes, based on
the 11 available strains, plateaus around 1,400 genes. The pat-
tern was less clear for S. agalactiae, where the estimate of
Table 1
Genomes analyzed
Species Strain Refseq accession number Status CDS Serotype References
S. pyogenes MGAS10270 GenBank:NC_008022 Complete 1,987 M2 [46]
S. pyogenes MGAS10750 GenBank:NC_008024
Complete 1,979 M4 [46]
S. pyogenes MGAS2096 GenBank:NC_008023
Complete 1,898 M12 [46]
S. pyogenes MGAS9429 GenBank:NC_008021
Complete 1,877 M12 [46]
S. pyogenes M1 GAS GenBank:NC_002737
Complete 1,697 M1 [76]
S. pyogenes MGAS5005 GenBank:NC_007297
Complete 1,865 M1 [77]
S. pyogenes MGAS8232 GenBank:NC_003485
Complete 1,845 M18 [78,79]
S. pyogenes MGAS6180 GenBank:NC_007296
Complete 1,894 M28 [80]
S. pyogenes MGAS315 GenBank:NC_004070
Complete 1,865 M3 [79]
S. pyogenes SSI-1 GenBank:NC_004606
Complete 1,861 M3 [81]
S. pyogenes MGAS10394 GenBank:NC_006086
Complete 1,886 M6 [82]
S. pneumoniae R6 GenBank:NC_003098
Complete 2,043 [83]
S. pneumoniae TIGR4 GenBank:NC_003028
Complete 2,094 [84]
S. mutans UA159 GenBank:NC_004350
Complete 1,960 [85]
S. agalactiae 2603V/R GenBank:NC_004116
Complete 2,124 [86]
S. agalactiae A909 GenBank:NC_007432
Complete 1,996 [22]
S. agalactiae NEM316 GenBank:NC_004368
Complete 2,094 [9]
S. agalactiae 515 GenBank:NZ_AAJP00000000
WGS 2,275 [22]
S. agalactiae CJB111 GenBank:NZ_AAJQ00000000
WGS 2,197 [22]
S. agalactiae COH1 GenBank:NZ_AAJR00000000
WGS 2,376 [22]
S. agalactiae H36B GenBank:NZ_AAJS00000000
WGS 2,376 [22]
S. agalactiae 18RS21 GenBank:NZ_AAJO00000000
WGS 2,146 [22]
S. suis 89/1591 GenBank:NZ_AAFA00000000
WGS 1,896
S. thermophilus CNRZ1066 GenBank:NC_006449
Complete 1,915 [87]
S. thermophilus LMG 18311 GenBank:NC_006448
Complete 1,889 [87]
S. thermophilus LMD-9 GenBank:NZ_AAGS00000000
WGS 1,835
CDS, number of protein coding sequences; WGS, whole genome shotgun.
R71.4 Genome Biology 2007, Volume 8, Issue 5, Article R71 Lefébure and Stanhope />Genome Biology 2007, 8:R71
Venn diagram for six sets of three taxaFigure 1
Venn diagram for six sets of three taxa. Above are taxa of the same species and below are taxa of different species. The surfaces are approximately
proportional to the number of genes.
Accumulation curves for the total number of genes (left) or the number of genes in common (right) given a number of genomes analyzed for the different species of Streptococcus (in blue), the different strains of S. agalactiae (in red) and S. pyogenes (in green)Figure 2
Accumulation curves for the total number of genes (left) or the number of genes in common (right) given a number of genomes analyzed for the different
species of Streptococcus (in blue), the different strains of S. agalactiae (in red) and S. pyogenes (in green). The vertical bars correspond to standard deviations
after repeating one hundred random input orders of the genomes.
Pan-genome size
5,000
4,000
3,000
2,000
1,000
0
0 5 10 15 20 25
Core-genome size
2,000
1,500
1,000
500
0
0 5 10 15 20 25
Number of genomes Number of genomes
Genome Biology 2007, Volume 8, Issue 5, Article R71 Lefébure and Stanhope R71.5
comment reviews reports refereed researchdeposited research interactions information
Genome Biology 2007, 8:R71
core-genome size does not level out, and appears as though it
might still be influenced by the inclusion of new genome
sequences. On the whole, these analyses suggest that it is pos-
sible to delineate a core-genome at both genus and species
level. We analyzed four such core-genome data sets: the
Streptococcus core-genome (611 genes), and the core-
genomes of S. agalactiae (1,472 genes), S. pyogenes (1,376
genes) and S. thermophilus (1,487 genes). To save computa-
tion time, the Streptococcus core-genome data set was
reduced to ten taxa by keeping only two strains per species for
S. agalactiae, S. pyogenes, S. thermophilus (strains A909
and NEM316, MGAS9429 and M1 GAS, and CNRZ1066 and
LMG 18311, respectively). After discarding clusters of genes
containing paralogs (that is, clusters containing more than
one gene per taxon), and alignments with uncertain site
homologies, we obtained four data sets containing 260, 1,297,
1,212 and 1,365 genes representing the alignable core-
genomes of Streptococcus, S. pyogenes, S. agalactiae, and S.
thermophilus, respectively.
Determinations of the number of genes gained and lost on
each of the lineages shows considerable variation (Figure 4)
and, in agreement with earlier studies, gene gain was gener-
ally considerably greater than gene loss, as well as being par-
ticularly evident on external branches [23]. The lineage in the
interspecific analysis showing the greatest gene gain was S.
suis, followed closely by S. pneumoniae and S. mutans. Even
within a species, between strains, the numbers of genes
gained and lost were very high, reaching, for example, values
in excess of 150 for gene gain in S. agalactiae strain H36B.
High levels of gene gain and loss were evident, even for closely
related isolates of the same serotype in S. pyogenes (for
example, M1 GAS/MGAS5005; SSI-1/MGAS315;
MGAS9429/MGAS2096). Branch lengths of the S. pyogenes
Frequency of genes within the 26 genomes included in this analysisFigure 3
Frequency of genes within the 26 genomes included in this analysis. Genes
present in a single genome represent lineage specific genes, while at the
opposite end of the scale, genes found in all 26 genomes represent the
Streptoccocus core-genome.
1 5 10 15 20 25
Number of genomes
1,000
800
600
400
200
0
Number of genes
21%
15%
11%
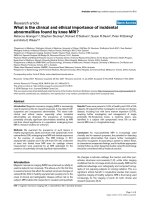
Gene gain, loss and duplication, and positive selectionFigure 4
Gene gain, loss and duplication, and positive selection. Core-genome phylogenies of Streptococcus (left), S. agalactiae (middle), and S. pyogenes (right) based
on concatenated genes. Dashed lines correspond to unresolved branches. Numbers adjacent to angle brackets facing the branch refer to genes gained,
opposite direction - genes lost, and '×' refers to duplicated loci. Values correspond to the most parsimonious unambiguous changes, following an equally
penalized model (that is, gain, loss and duplication events cost the same numbers of changes). Numbers adjacent to the red dot correspond to the number
of genes under positive selection within the core-genome, on a particular lineage.
R71.6 Genome Biology 2007, Volume 8, Issue 5, Article R71 Lefébure and Stanhope />Genome Biology 2007, 8:R71
concatenated tree were much longer than those for S. agalac-
tiae, suggesting the lineages might be much older; however,
despite this there was generally more gene gain on the S. aga-
lactiae branches than on S. pyogenes branches. Large values
for duplications were also a feature of the lineage specific evo-
lution (Figure 4). Phylogenetic analysis of several of these
cases suggests this is a combination of lineage specific dupli-
cations as well as LGT events involving homologous
sequences from other species of Streptococcus. When gene
gain was penalized with respect to gene loss (for example,
[24]), not surprisingly, it globally decreased the number of
gene gains and increased the number of gene losses (Addi-
tional data file 3) and, as a consequence, increased the
number of genes in the pan-genomes of ancestral nodes (data
not shown). Nevertheless, even with a penalty, gene gain
remained in excess of gene loss on some lineages (Additional
data file 3).
Recombination
Between species of Streptococcus
The results of the approximately unbiased (AU) test indicated
that 39 out of 260 genes rejected the concatenated tree. The p
value heatmap (Figure 5a) indicates that some gene trees
showed the same or very similar histories, depicted by groups
of topologies with a similar p value pattern (for example,
topologies 1 to 47, and 48 to 65). On the other hand, a small
group of genes rejected most topologies (that is, genes 230 to
260, read horizontally in Figure 5a), and at the same time,
their trees were rejected by most of the genes (that is, topolo-
gies 230 to 260, read vertically in Figure 5a). Although differ-
ent topologies were supported by various groups of genes, the
majority of genes did not reject the concatenated tree and
only a small subset of genes proposed significantly different
trees. The analysis of bipartitions (Figure 5b) demonstrated
that the vast majority of genes supported three distinct
bipartitions, corresponding to the monophyly of S. pyogenes,
S. pneumoniae and S. thermophilus (bipartitions 28, 29, and
30, respectively). Also generally supported were the mono-
phyly of S. agalactiae, the monophyly of the group S. pneu-
moniae + S. suis, and the monophyly of the group S.
agalactiae + S. pyogenes (bipartitions 27, 26 and 25, respec-
tively). Several other bipartitions were only supported by
some genes (for example, bipartition 19, corresponding to the
grouping of S. pneumoniae with S. thermophilus), while oth-
ers were only supported by one or a few genes (for example,
bipartition 10 and 11). The well supported conflicting biparti-
tions figure (Figure 5c) is a summary of the p value heatmap
(Figure 5a) and bipartition analyses (Figure 5b). A majority of
the genes (around 150 out of 260) show no conflict with each
other. Most of them support the monophyly of the different
species and the lineage S. pneumoniae + S. suis, and most of
them do not reject the concatenated gene tree. Another set of
genes showed some instances of conflict with the aforemen-
tioned set of 150, but most of them were in conflict with each
other. They tend to support the same principal groups as the
set of 150, with a few additional bipartitions that are conflict-
ing. A final group of genes conflict with the first and the sec-
ond group, as well as with each other, corresponding to genes
that rejected most of the other gene trees in the AU test (Fig-
ure 5a) and that provide support for rare bipartitions; genes
of this set have strongly incongruent histories with the other
genes (for a detailed list, see Additional data file 4). The topol-
ogies used to test for positive selection were the concatenated
gene tree for the genes that don't reject it, and individual gene
trees for those loci that do reject the concatenated tree.
Within S. agalactiae
The concatenated gene tree was rejected by 750 genes of the
core-genome of S. agalactiae. On the whole, most genes
rejected most of the other gene trees (Figure 6a), although
there were also some genes that did not reject the majority of
gene trees. There were no commonly well supported biparti-
tions across the genes (Figure 6b). Around half of the genes
provided either no, or only weak, bootstrap support for any
bipartition (genes 1 to 560; Figure 6b), while the rest of the
genes supported different sets of bipartitions. The most com-
monly supported groups of strains were 515+NEM316,
A909+H36B, 515+NEM316+COH1, A909+CJB111+H36B,
A909+CJB111+H36B, and 515+COH1 (bipartitions 75 to 70,
respectively; Figure 6b). Additional, numerous bipartitions
were supported by only one or a few genes. Because they pos-
sessed a too limited phylogenetic signal, around half of the
genes (genes 1 to 560) showed no conflict with any of the
other genes (Figure 6c). Although the AU test suggested that
some of these genes have different histories, it is difficult to
reach any definitive conclusions about the congruence of
these gene histories since phylogenetic signal was so limited
or absent (genes with no sequence divergence between
strains).
The second half of the core-genome can be split into two
groups. The first group contains genes that have some conflict
with each other, and that tend to support the six bipartitions
described earlier, plus three additional ones. The second
group contained genes that were largely in conflict with each
other, and with the preceding group. This latter group pro-
vided support for a number of rarely supported bipartitions.
While the first group contained genes that had only partly
incongruent histories (only a few bipartitions in conflict),
genes of the last group had more incongruent gene histories
(greater number of bipartitions in conflict). Given these
results, and the ambiguity of defining which genes had the
same history, we analyzed each gene with its own gene tree in
the subsequent positive selection analyses.
Within S. pyogenes
As for S. agalactiae, while a few genes rejected nothing, the
majority of genes rejected the other gene trees (Figure 7a).
Three bipartitions were generally supported, although not
always, and with various bootstrap scores, corresponding
with serotype groupings: MGAS5005+M1 GAS,
MGAS315+SSI-1, and MGAS2096+MGAS9429 (bipartitions
Genome Biology 2007, Volume 8, Issue 5, Article R71 Lefébure and Stanhope R71.7
comment reviews reports refereed researchdeposited research interactions information
Genome Biology 2007, 8:R71
131 to 129, respectively; Figure 7b). A total of 434 genes
tended to also provide support for various unique biparti-
tions. Around half of the genes had weak or no phylogenetic
signal, and, as a consequence, had no conflict with any other
trees (Figure 7b). A set of around 200 genes, most of which
Streptococcus recombination heatmapsFigure 5
Streptococcus recombination heatmaps. Heatmaps of the (a) AU test, (b) bipartitions bootstrap scores and (c) well supported conflicting bipartitions on the
core-genome of Streptococcus. Topologies are ordered from the less rejected (on the left) to the most rejected (on the right). Bipartitions are ordered
from the less supported (on the left) to the most supported (on the right), and only bipartitions supported by at least a 70% bootstrap score are
represented. Genes are ordered from the less conflicting (left and top) to the most conflicting (right and bottom). The well supported conflicting
bipartitions heatmap represents a symmetrical distances matrix, where each cell corresponds to the number of well supported (that is, bootstrap ≥90)
conflicting bipartitions between two genes. A color key is given on the right side, and gradations correspond to p values, bootstrap percentages, and
number of conflicting bipartitions, left to the right respectively. The arrow locates the concatenated tree.
(a)
(b) (c)
(a)
(b) (c)
S. agalactiae recombination heatmapsFigure 6
S. agalactiae recombination heatmaps. The layout is the same as Figure 5 but for the core-genome of S. agalactiae.
(a)
(b) (c)
(a)
(b) (c)
R71.8 Genome Biology 2007, Volume 8, Issue 5, Article R71 Lefébure and Stanhope />Genome Biology 2007, 8:R71
supported the three bipartitions detailed above, tended not to
conflict with each other, but occasionally with the final group-
ing of genes. This latter group was composed of the 434 genes
mentioned above, which supported variously different bipar-
titions, and thus tended to be in conflict with each other.
Overall, the S. pyogenes core-genome is composed of genes
that are largely congruent for a portion of relatively recent
history (that is, the serotype monophyly), while one-third of
the core-genome appears to have strongly incongruent histo-
ries for older events. Because it appeared difficult to define
which genes were likely to have the same history, we analyzed
each gene with its own gene tree in the subsequent positive
selection analyses.
Substitution analysis of recombination
The pairwise homoplasy index (PHI) approach suggested that
around 20% of the genes were recombinant within the core-
genome of Streptococcus and S. pyogenes, while within S.
agalactiae only about 3% of the genes were recombinant
(Table 2). Employing a more conservative approach that con-
siders as recombinant only those genes found by three differ-
ent substitution approaches (PHI, MaxChi and neighbor
similarity score (NSS)), these proportions were reduced, but
the relative differences between the data sets remained (Table
2). With the phylogenetic approach detailed above, numerous
genes had weak phylogenetic signal, and several groups of
genes were only partially incongruent; therefore, it can be dif-
ficult to define clearly which genes have different histories. It
is, however, possible to adopt a conservative approach that
considers as putative recombinants only those genes with
strong phylogenetic incongruence (SPI), with most of the
other genes. Nevertheless, only a small proportion of genes
was identified by both PHI and SPI approaches as putative
recombinants (Table 2), suggesting that each approach tends
to identify different types of recombination event. We there-
fore propose that an estimate of the complete set of putative
recombinants can best be considered as the set of genes iden-
tified by SPI plus the genes identified by all three substitution
recombination methods (Table 2). This yields an estimate of
18% of the core-genome for S. agalactiae as putative
recombinants, 19% for the genus Streptococcus, and 37% for
S. pyogenes.
S. pyogenes recombination heatmapsFigure 7
S. pyogenes recombination heatmaps. The layout is the same as Figure 5 but for the core-genome of S. pyogenes.
(a)
(b) (c)
(a)
(b) (c)
Table 2
Number of genes showing evidence of recombination
1. SPI 2. PHI 3. PHI ∩ MaxChi ∩
NSS
1 ∩ 21 ∩ 3
Between species 26 (10.0%) 54 (20.8%) 35 (13.5%) 11 (4.2%) 53 (19.2%)
S. pyogenes 434 (33.5%) 284 (21.9%) 168 (12.9%) 186 (14.3%) 477 (36.8%)
S. agalactiae 222 (18.3%) 34 (2.8%) 7 (0.6%) 18 (1.5%) 223 (18.4%)
Genome Biology 2007, Volume 8, Issue 5, Article R71 Lefébure and Stanhope R71.9
comment reviews reports refereed researchdeposited research interactions information
Genome Biology 2007, 8:R71
Positive selection analysis
The number of genes that showed evidence for positive selec-
tion was particularly high within the Streptococcus core-
genome (between 10% and 40%; Table 3). The S. pneumoniae
and S. suis lineages, and the ancestral lineage leading to these
two species, exhibited the greatest proportion of the core-
genome evolving under positive selection (28%, 34% and
32%, respectively; Table 3). Approximately one-third of the
genes showed positive selection on only one lineage, and no
gene was selected in all possible lineages (Figure 8). There
were, however, many examples of genes selected on multiple
lineages, including several genes selected on as many as 5 (12
genes) or 6 (4 genes) different lineages (Figures 8 and 9; see
Additional data file 5 for a complete list of all genes and
lineages under positive selection). A significant proportion of
positively selected genes for S. suis, S. pneumoniae, and S.
thermophilus was uniquely selected on each of these lineages
(21%, 19%, and 24%, respectively), in contrast to that for S.
agalactiae, S. pyogenes, and S. mutans, which had either no
uniquely selected loci (S. agalactiae), or a very small
proportion (Figure 9). Analysis of variance of genes under
positive selection pressure supported a significant effect of
both lineage and biochemical main role category (Table 4).
Post hoc multiple comparisons showed that the main effect
was due to two categories, 'DNA metabolism' and 'Transcrip-
tion'. Less strongly supported, but still significant, was the
interaction between lineages and main role categories (Table
4). This interaction appeared mainly due to an increase of
genes under positive selection for loci involved in transcrip-
tion, protein fate, protein synthesis and DNA metabolism for
Table 3
Genes under positive selection
Data set Lineage n PS %
Streptococcus S. mutans 260 33 12.69
S. pneumoniae 260 73 28.08
S. suis 260 89 34.23
S. thermophilus 260 61 23.46
S. agalactiae 260 28 10.77
S. pyogenes 260 44 16.92
(S. pneumoniae, S. suis) 221 71 32.13
S. agalactiae COH1 1,212 7 0.58
18RS21 1,212 0 0.00
NEM316 1,212 1 0.08
H36B 1,212 1 0.08
A909 1,212 0 0.00
2603V/R 1,212 1 0.08
CJB111 1,212 1 0.08
515 1,212 0 0.00
S. pyogenes MGAS10270 1,297 7 0.54
MGAS10394 1,297 3 0.23
MGAS10750 1,297 1 0.08
MGAS2096 1,297 1 0.08
MGAS315 1,297 0 0.00
MGAS5005 1,297 1 0.08
MGAS6180 1,297 2 0.15
MGAS8232 1,297 4 0.31
MGAS9429 1,297 2 0.15
M1 GAS 1,297 0 0.00
SSI-1 1,297 0 0.00
(MGAS9429, MGAS2096) 925 2 0.22
(MGAS5005, M1 GAS) 978 4 0.41
(SSI-1, MGAS315) 983 9 0.92
S. thermophilus CNRZ1066 1,365 3 0.22
LGM 18311 1,365 3 0.22
LMD-9 1,365 14 1.03
PS, positive selection.
R71.10 Genome Biology 2007, Volume 8, Issue 5, Article R71 Lefébure and Stanhope />Genome Biology 2007, 8:R71
the S. pneumoniae-S. suis ancestral lineage and the S. suis
lineage.
In addition to identifying genes and lineages under positive
selection, the branch-site test also identifies sites using a
Bayes empirical Bayes approach [25]. For 91% of the genes
under positive selection, specific sites were proposed
(posterior probability >0.95). Interestingly, when a gene was
independently selected on different lineages, the sites under
positive selection were generally not the same across lineages,
arguing for different selection pressure located at different
sites. In contrast to the interspecific comparisons, positive
selection was evident for only a few genes within the core-
genome, across strains of the different Streptococcus species
(Table 3, Additional data file 5), including a few lineages that
showed slightly increased levels of positive selection relative
to the rest. For S. agalactiae the exceptional lineage was
COH1, for S. pyogenes the exceptional lineages were
MGAS10270 and that leading to SSI-1/MGAS315, and for S.
thermophilus it was LMD-9. A significant number of genes
evolving under positive selection were also judged as putative
recombinants (Table 5). This was particularly true for the S.
pyogenes genome, where 78% of the genes under positive
selection were putative recombinants. Approximately half of
these genes were identified as recombinants by the substitu-
tion based recombination methods, and the other half by the
phylogenetic approach.
Discussion
Core-genome, pan-genome, and recombination
We estimate that the pan-genome of the genus Streptococcus
probably exceeds at least three times the average genome size
of a typical Streptococcus species. This huge variability in
gene content between species is also evident in comparisons
across strains of the same species. Our prediction for the S.
agalactiae pan-genome is in general agreement with that of
Tettelin et al. [22]. The marked difference in estimated pan-
genome size for these two species may be a reflection of their
habitat differences. The human oral-nasal mucosa is the pri-
mary habitat for S. pyogenes, whereas S. agalactiae was first
identified as a bacteria linked to bovine mastitis, and later in
humans, where it colonizes the lower gastrointestinal tract
and vaginal epithelium of healthy adults. This apparent
broader habitat range for S. agalactiae, and presumably,
therefore, a greater available gene pool for lateral gene trans-
fer, could explain the difference in pan-genome size of these
two species.
The pronounced evolutionary flexibility of these bacterial
genomes is further evident in the determinations of gene
gain, loss and duplication on each of the respective lineages.
Gene gain figures were generally higher for S. agalactiae than
for S. pyogenes, despite the fact that branch lengths suggest
the S. pyogenes lineages may be older, and is likely a conse-
quence of the overall smaller pan-genome size for S. pyo-
genes. For some species, gene gain figures exceeded 20% of
the total gene content for the organism. Our results in this
regard are in general agreement with those of Hao and Gold-
ing [23], while also extending the estimates to additional taxa
of Streptococcus, and lineages of S. agalactiae and S. pyo-
genes, and we would certainly concur with these authors that
much of this gene gain likely reflects species specific adapta-
tion. In our opinion, a plausible explanation of the discrep-
Table 4
Analysis of variance for the effect of the lineages and role categories
Df Sum Sq Mean Sq F value p value
Lineage 6 2,954 492 23.9 <0.0001
Main role 10 1,086 109 5.27 <0.0001
Interaction 60 1,974 33 1.6 0.003
Residuals 1,699 35,005 21
Df, degree of freedom.
Frequency of positive selectionFigure 8
Frequency of positive selection. Numbers of genes showing evidence of
positive selection in 1-7 lineages.
150
100
50
0
1234567
Number of lineages
Frequency
Genome Biology 2007, Volume 8, Issue 5, Article R71 Lefébure and Stanhope R71.11
comment reviews reports refereed researchdeposited research interactions information
Genome Biology 2007, 8:R71
ancy between gene gain and loss is that much of the pan-
genome remains unsampled, and, therefore, we simply can-
not detect many gene loss events, resulting in an underesti-
mate of that category. In several genome reconstruction
analyses, gene gain is penalized with respect to gene loss (for
example, [24,26-28]). This procedure logically results in an
increase of gene loss relative to gene gain. It has the direct
consequence of increasing ancestral genome sizes, and reduc-
ing the importance of LGT events to the benefit of genome
reduction processes. Nevertheless, this approach is question-
able when one attempts to reconstruct genome composition,
and in particular, for the case of Streptococcus. First, because
the genome size is relatively stable in Streptococcus, the
ancestral genome sizes were arguably of the same order. Sec-
ond, the number of genome specific genes is so common that
there is little reason to postulate that gene gain is less proba-
ble than gene loss. Therefore, at least in the case of Strepto-
coccus, we question the validity of an approach that favors
genome reduction processes over LGT. In that regard, the
development of probabilistic models will be highly valuable to
estimate rates of gene gain and loss (for example, [16,29]).
In contrast to the pan-genome, the core-genome size of the
taxonomic groups included in our analysis are much better
estimated. Within Streptococcus, we characterized several
core-genomes, the composition of which depended on the
taxonomic level considered. Our prediction of core-genome
composition for S. agalactiae was in general agreement with
Tettelin et al. [22] and Brochet et al. [30]. The slight differ-
ences in the absolute numbers between the three studies are
due to differences in methodology used to define orthology
[22], or the use of DNA microarray hybridization data [30]. At
the genus level, the core-genome corresponded to 25% of a
typical Streptococcus genome, while at the species level it
represented around 60% of the genome. Earlier studies
involving other groups of bacteria have suggested that such
core-genomes may be relatively free of recombination [31-
33]. If you consider the union of both substitution based
methods and phylogenetic based methods we estimate that
around 18% of the core genome of the genus Streptococcus is
recombinant and as much as 35% of the genome of S. pyo-
genes. In addition to the fact that we are analyzing a different
group of taxa, and thus levels of recombination might well be
expected to be different, our results differ from these earlier
estimates, also because of approach. We concur with the
comments of Susko et al. [34] that attempts to evaluate phyl-
ogenetic congruence of core-genes need to involve compari-
sons with as many relevant topologies as possible, and not
just that favored by the concatenated topology, some variants
of it, or particular canonical markers such as the small subu-
nit rRNA. In doing this, however, we think it is important to
keep in mind that topologies may be rejected as being congru-
ent, even though the genes may provide little phylogenetic
signal, and, thus, only that proportion of the gene trees that is
rejected based on strongly supported conflicting nodes
should be regarded as incongruent. This was particularly evi-
dent in our analysis of S. pyogenes, where the vast majority of
topologies reject one another despite the fact that at least half
of these genes have little or no phylogenetic signal. Further-
more, our assessment of core genome recombination also dif-
fers from some of these earlier studies by the inclusion of
substitution based approaches to recombination detection.
There was little overlap in the loci identified as putative
recombinants using both the phylogenetic and the substitu-
Positive selection occurrence per genes and lineagesFigure 9
Positive selection occurrence per genes and lineages. A black dot indicates positive selection. The genes and lineages were ordered following a
correspondence analysis.
Table 5
Total number of genes showing evidence of positive selection and recombination
Data set PS PS and R PS and SPI PS and IR
Between species 175 43 (25%) 20 (8%) 29 (11%)
S.agalactiae 10 4 (40%) 4 (40%) 0 (0%)
S.pyogenes 32 25 (78%) 21 (65%) 17 (53%)
PS, positive selection; R, recombination.
R71.12 Genome Biology 2007, Volume 8, Issue 5, Article R71 Lefébure and Stanhope />Genome Biology 2007, 8:R71
tion based approaches, suggesting they were identifying very
different types of recombination. The substitution based
approaches are likely to detect homologous recombination of
smaller pieces of DNA that could be missed by a phylogenetic
approach. The more restricted habitat distribution for S. pyo-
genes may also be an explanation for the elevated amounts of
recombination in the core-genome of that species. A more
reduced gene pool for possible recombination would not only
result in a smaller pan-genome size (as suggested above for S.
pyogenes), but it would also result in the propensity for more
homologous recombination of core-genome components, at
least partly because the relative proportion of conspecific
donor pieces of DNA are likely to be greater.
Positive selection in the core-genome
A logical surmise often made in studying pathogen evolution
is that much of the host specific adaptation that a bacterial
species exhibits will be associated with its species specific
genes. Perhaps as a consequence of this common sense view-
point, adaptation within the core genome has received much
less attention. Our analysis reveals that during the
diversification of the genus Streptococcus there has been sig-
nificant amounts of positive selection pressure on core
genome components and that this selection pressure has
occurred disproportionately in certain lineages, and bio-
chemical categories. Such an important positive selection sig-
nature within the core-genome of Streptococcus is perhaps
somewhat surprising, as these predominately housekeeping
genes might be expected to evolve under strong purifying
selection. At the same time, we would argue that many of
these genes are undoubtedly related to the colonization, per-
sistence, survival, and propensity to cause disease in these
organisms and thus are associated with the adaptive specifics
of the bacteria.
Based on currently available phylogenies for the genus Strep-
tococcus [35], there appears to be a rough correlation with the
relative divergence of taxa and the level of positive selection
detected in different lineages. For example, S. pyogenes and
S. agalactiae are both members of the Pyogenes taxonomic
group and there are fewer numbers of genes selected on these
lineages than for taxa from different taxonomic groups. Sev-
eral genomes also tend to resemble one another in relation to
the genes that were positively selected, while others, such as
S. suis and S. thermophilus, exhibit higher levels of specific
adaptation. S. suis was also the species with the largest
number of positively selected genes in its core-genome, rela-
tive to the other lineages, and the genome that had the great-
est amount of gene gain and loss incurred since the
separation of the S. pneumoniae-S. suis common ancestor.
This suggests a lineage that has been under strong selection
pressure, both with regard to acquiring new genes and with
regard to the sequence characteristics of the core genome
components. This selection pressure is undoubtedly corre-
lated with particular characteristics of the host species, swine.
Current phylogenies support S. acidominimus as the sister
group to S. suis [35], a species associated with bovine vagina,
the skin of calves, and raw milk, suggesting the possibility of
host divergence in one or another (or possibly both) lineage,
subsequent to their split from a common ancestor. S. suis is
also known as an occasional zoonotic pathogen of humans,
causing septicemia, meningitis, endocarditis [36], and, most
recently, streptococcal toxic shock syndrome [15]. Our analy-
sis suggests an apparent evolutionary flexibility of the S. suis
genome that could perhaps be related to this propensity for
host jumping.
In addition to the lineage effect in the interspecific selection
analysis, there was also an effect of biochemical roles, with
DNA metabolism and transcription significantly different
from the majority of the other categories and correlated with
higher incidence of positive selection. An excess of positive
selection in the genes related to transcription is perhaps sur-
prising, as these genes are generally well conserved and are
known to be particularly recalcitrant to recombination. Fur-
thermore, the S. suis and S. pneumoniae-S. suis ancestral lin-
eages showed a disproportionate amount of positively
selected genes for several biochemical categories. Thus, the
extent of adaptive molecular evolution varies across lineages
and gene roles, undoubtedly reflecting the habitat heteroge-
neity of the genus Streptococcus. Our results also reveal that
positive selection was partly linked to recombination. Recom-
bination can create artifactual positive selection results [37],
particularly for genes showing evidence of intragenic recom-
bination. This is less probable for genes identified as recom-
binant using the phylogenetic recombination detection
procedure, because these loci were analyzed for positive
selection with their own phylogenies, thereby taking into
account possible LGT events. It is possible that many LGT loci
could also be positively selected because of strong selective
forces that might be expected to act on newly acquired genes.
Marri et al. [16] found that many species specific genes within
the Streptococcus genus showed evidence of adaptive
evolution, and concluded that LGT played an important adap-
tive role.
Although a good deal of positive selection pressure was evi-
dent in the analysis of different lineages within the genus
Streptococcus, there was much less evidence for positive
selection between the different lineages of S. agalactiae, S.
pyogenes, and S. thermophilus. Nevertheless, these absolute
numbers of genes under positive selection are not corrected
for depth of ancestry. In other words, they do not reflect rates
of adaptative mutations for specific lineages; instead, they
represent the core-genome fraction that has participated in
the adaptation of a specific taxon. There were, however, sev-
eral lineages in each of these species that had slightly elevated
levels of selection relative to the rest. In S. pyogenes, for
example, the lineage leading to the M3 serotype had nine
genes under positive selection, while the majority of other lin-
eages had two or less (see Additional data file 5 for a complete
description of these genes). Compared to other M types, sero-
Genome Biology 2007, Volume 8, Issue 5, Article R71 Lefébure and Stanhope R71.13
comment reviews reports refereed researchdeposited research interactions information
Genome Biology 2007, 8:R71
type M3 strains cause more cases of invasive disease, such as
necrotizing fasciitis, bacteremia, and streptococcal toxic
shock syndrome [38-42], a higher rate of lethal infections [41-
43], and exhibit occasional epidemic tendency [38]. The nine
genes we identified as positively selected included loci impli-
cated as virulence determinants in other species of Strepto-
coccus, such as adenylosuccinate lyase, a homotetramer that
catalyzes two discrete reactions in the de novo synthesis of
purines, and has recently been implicated as a virulence fac-
tor for infective endocarditis, a serious endovascular infection
caused by Streptococcus sanguinis [44], as well as genes
involved in cell envelope, such as UDP-N-acetylmuramoyla-
lanyl-D-glutamyl-2,6-diaminopimelate-D-alanyl-D-alanyl
ligase, demonstrated to be integral to peptidoglycan
biosynthesis and cell growth [45]. In addition to the evalua-
tion of genes unique to M3 strains (for example, [46]), we
suggest that these nine core-genome loci uniquely under
positive selection pressure in this M3 lineage should be con-
sidered as putatively important in the unique pathogenic fea-
tures of M3 strains.
In the case of S. agalactiae, the lineage that stood out from
the rest with regard to levels of positive selection pressure was
COH1, which is serotype III, ST17, significantly associated
with neonatal invasive disease [47], and is hypothesized to
have recently arisen from a bovine ancestor [48]. The seven
genes selected on this lineage include a number of loci either
already implicated in virulence in other bacteria, or for which
there is some reason to suspect them as candidate virulence
loci (see Additional data file 5 for a full description of these
genes). For example, adenylosuccinate lyase, discussed
above with regard to S. pyogenes, was also positively selected
in this lineage. Phosphate acetyltransferase was uniquely
selected along this COH1 lineage, and has recently been
implicated in virulence in Salmonella enterica [49]. Also
selected were a protein involved in the cell envelope, as well
as two different ABC transporters. The cell envelope is a key
overall component of virulence in S. agalactiae [50]. ABC
transporters have been known for some time to be efflux
mechanisms of drug resistance, although such efflux pumps
are now also known to have physiological roles, conferring
resistance to natural substances produced by the host, as well
as possible roles in pathogenicity [51]. Perhaps the proposed
recent shift in host preference from bovine to human for this
lineage [48] is facilitated by molecular adaptation of ABC
transporters that confer resistance to natural substances of
the new host.
Conclusion
The research presented here employs a comparative genom-
ics approach to define the core-genome component of the
genus Streptococcus, as well as that of S. agalactiae, S. pyo-
genes, and S. thermophilus. We then assess levels of recombi-
nation and positive selection pressure in this core-genome for
each of these taxonomic groups. Concomitant with these
assessments of core-genome were estimates of the pan-
genome size of each of these groups, and levels of gene gain,
loss and duplication on each of the lineages.
The pan-genome size of S. pyogenes appears to be quite well
estimated with the 11 sequences currently available, and is
approximately 2,500 genes. The pan-genome size of S. aga-
lactiae is less well estimated with available sequence data and
is in excess of 2,800 genes. Similarly, the pan-genome size of
the genus Streptococcus is not accurately estimated with the
26 genomes analyzed here, and is in excess of 5,300 genes.
We suggest that the broader habitat range for S. agalactiae
may provide a greater available gene pool for lateral gene
transfer, and could explain the difference in pan-genome size
of S. agalactiae and S. pyogenes.
The core-genome components of each of these taxonomic
groups is much better represented, and contrary to some ear-
lier studies involving other groups of bacteria, which have
suggested that such core-genomes may be relatively free of
recombination, we estimate that around 18% of the core-
genome of the genus Streptococcus is recombinant and as
much as 35% of the genome of S. pyogenes. An explanation
for the greater amount of recombination in S. pyogenes may
be related to the more restricted habitat distribution for S.
pyogenes, which would result in the propensity for more
homologous recombination of core-genome components
because the relative proportion of conspecific donor pieces of
DNA is likely to be greater. Positive selection across the core-
genome was particularly evident in the analysis of the differ-
ent species within the genus Streptococcus, and it occurred
disproportionately in certain lineages, as well as biochemical
categories. S. suis was the lineage that showed the greatest
positive selection pressure, the largest number of loci
uniquely selected, and the lineage that had the greatest
amount of gene gain and loss. In addition to the lineage effect
in the interspecific selection analysis, there was also an effect
of biochemical role, with genes related to DNA metabolism
and transcription showing a significantly higher number of
genes under positive selection. Contrary to the interspecific
analysis, the selection analysis on individual species sup-
ported much less evidence for positive selection, but sug-
gested there were particular lineages in each species that had
experienced more core-genome selection pressure than the
others. In the case of S. pyogenes this was the lineage leading
to the M3 serotype, and we suggest that the nine genes iden-
tified as positively selected should be considered as putatively
important in the unique pathogenic features of M3 strains. In
the case of S. agalactiae the lineage with the disproportionate
selection pressure was COH1, which is known to be signifi-
cantly associated with neonatal invasive disease, and is
hypothesized to have recently arisen from a bovine ancestor.
We suggest that this proposed recent host jump from bovine
to human for this lineage could be the explanation for the
greater amount of selection pressure observed in this
genome.
R71.14 Genome Biology 2007, Volume 8, Issue 5, Article R71 Lefébure and Stanhope />Genome Biology 2007, 8:R71
Overall, this study indicates that there has been considerable
recombination and positive selection pressure in the diversi-
fication of the Streptococcus core-genome, particularly at the
interspecific level. Positive selection seems to be of principal
importance in species differentiation and adaptation to new
hosts, while it plays a less important role during strain evolu-
tion, where the process may be too slow to facilitate rapid
strain adaptation. On the other hand, the process of recombi-
nation, through either LGT or homologous intragenic recom-
bination, involving both the core-genome and the pan-
genome, appeared to be of main importance at a variety of
evolutionary time scales. It seems likely that recombination is
a more efficient means of change, ultimately making it the
more universal process of Streptococcus adaptation.
Although the cause-effect explanations are not necessarily
clear for many of the genes that we identify as positively
selected, it is nonetheless important to realize that positive
selection of these genes indicates such loci have important
functions, which in many instances may be integral to the
unique adaptive features of each lineage. Several recent
studies have harnessed the power of modern molecular selec-
tion analyses to direct functional experimentation based on
the resulting molecular evolutionary hypotheses (see for
example, [52-54]). It is our hope and intention that the iden-
tification and cataloging of these loci (Additional data file 5)
for this and other groups of bacteria will serve as an evolu-
tionary shortcut for others to design laboratory mutation
experiments to assess the specific functional significance of
these genes.
Materials and methods
Ortholog retrieval
Twenty six genomes of Streptococcus were downloaded from
GenBank (Table 1), representing six different species. Coding
sequences were extracted from GenBank files, and orthologs
were determined using OrthoMCL [43]. This program first
makes an all-against-all BLASTp, and then defines putative
pairs of orthologs or recent paralogs based on reciprocal
BLAST. Recent paralogs are identified as genes within the
same genome that are reciprocally more similar to each other
than any sequence from another genome. OrthoMCL then
converts the reciprocal BLAST p values to a normalized simi-
larity matrix that is analyzed by a Markov Cluster algorithm
(MCL) [55]. In return, the MCL yields a set of clusters, with
each cluster containing a set of orthologs and/or recent para-
logs. OrthoMCL was run with a BLAST E-value cut-off of 1e-
5, and an inflation parameter of 1.5. We used the OrthoMCL
output to construct a table describing genome gene content
(Additional data file 1). Genes that were not included in a
cluster were considered taxon specific genes only if they were
at least 50 amino acids long and had no BLAST hit with any
other protein (E-value ≤ 1e-10). Preliminary analysis indi-
cated that many truncated proteins found at the ends of con-
tigs of the incomplete genomes, although exhibiting clear
evidence of homology, were not included in any cluster
because they had weak or no reciprocal BLAST hit. This table
was used to plot venn diagrams with R 2.2.1 [56] and to con-
struct four core-genome data-sets corresponding to the fol-
lowing taxa: genus Streptococcus, S. agalactiae, S. pyogenes,
and S. thermophilus.
Gene loss, acquisition, and duplication were determined on
all branches of trees involving these taxa using the parsimony
criterion with the DelTran option, implemented in Paup
4.0b10 [57]. Ancestral gene state reconstruction was run with
two different step-matrices: the first one assesses gene gain,
loss and duplication as being equally likely (for example,
[23]), while the second penalizes gene gain by assuming a
double cost compared to loss and duplication (for example,
[24]). The gene content table was also used to perform gene
accumulation curves using R, which describe the number of
new genes and genes in common, with the addition of new
comparative genomes. The procedure was repeated 100 times
by randomly modifying genome insertion order to obtain
means and standard errors.
Alignments
Orthologs were first aligned at the DNA level with ClustalW
1.82 [58]. To ensure homology, alignments that contained
less than 35% conserved sites for the Streptococcus genus
data set, and 50% for the Streptococcus species data sets,
were discarded. A preliminary analysis of the data revealed
that many sequences identified as under positive selection
contained frameshifts that disrupted the reading frame (a
single insertion or deletion that modified the reading frame),
resulting in high non-synonymous substitution rates. Unfor-
tunately, it is not possible to accurately discriminate sequenc-
ing errors from actual insertions or deletions; however, most
of these frameshifts were found within the unclosed genomes
and appeared at the beginning or end of the contigs, where
sequencing errors are more probable. As described by
Perrodou et al. [59], most of these frameshifts are probably
sequencing errors, although it is possible that some are not
[60]. We chose the conservative approach of removing all
codons appearing before or after the frameshift when located
at the beginning or end of the coding sequence, respectively.
For that purpose, Perl scripts were developed to find
frameshifts on the DNA alignments, and the sequences were
edited manually. A second alignment step was then used to
refine all alignments by translating sequences to amino acids,
aligning them with ClustalW, and then back-translating to
DNA, using the script transAlign [61]. Finally, amino acid
alignments showing a low percentage of conserved sites were
manually inspected, and removed if the alignment was
ambiguous.
Recombination detection
Both phylogenetic and substitution pattern methods were use
to detect recombination events. The phylogenetic methods
rely on the examination of phylogenetic congruence among
genes (for example, [62,63]). If a gene has been laterally
Genome Biology 2007, Volume 8, Issue 5, Article R71 Lefébure and Stanhope R71.15
comment reviews reports refereed researchdeposited research interactions information
Genome Biology 2007, 8:R71
transferred, the phylogenetic relationships depicted by this
gene will be different from the species tree. We first applied
the method suggested by Susko et al. [34], which tests for the
rejection of a set of topologies by a set of orthologous genes
using the AU test [64]. When possible (that is, the number of
taxa ≤ 7), the trees tested are all the possible unrooted trees
(for example, [65]). When a gene rejects a tree that is sup-
ported by the majority of the other genes, this gene is consid-
ered to have been laterally transferred. We applied this
approach to our data sets (except for S. thermophilus, which
contains only three taxa), by using as tested topologies the
individual gene trees obtained by phyML (general time
reversible (GTR) +Γ4+I model of evolution with a BIONJ
starting tree) [66], with the addition of the tree obtained with
Paup (GTR+Γ4+I model of evolution, neighbor-joining (NJ)
starting tree, and a tree-bisection-reconnection (TBR)
branch-swapping algorithm) reconstructed from the concate-
nation of all genes. The site likelihood of each tree was than
computed by the program baseml (PAML package) [67] using
a GTR+Γ4 model of evolution. The AU test was then applied
using Consel [68].
As suggested by Susko et al. [34], results (p values for the
rejection of each tree) were plotted using heatmaps obtained
with R. This approach has the disadvantage of been devel-
oped with a test (the AU test) that assesses the rejection of a
tree by a gene and not for its acceptance [34]. As a result it is
not possible to say if a tree is not rejected because it is not sig-
nificantly different or because it is simply unresolved. This
sort of situation is particularly expected with weakly diver-
gent alignments, and at the opposite spectrum, with
saturated alignments. We thus developed and performed a
second set of analyses to complement the Susko approach and
intended to quantify the amount of supported and incongru-
ent phylogenetic signal between two gene trees. This
approach relies on the discovery of well supported conflicting
bipartitions (that is, branches that can not be observed in the
same tree), as measured by non-parametric bootstrap analy-
sis [69], thus revealing incongruence between gene histories.
Support for each bipartition was obtained by bootstrapping a
maximum likelihood (ML) tree search using Paup
(GTR+Γ4+I model of evolution). Custom-made scripts were
then used to find and count well supported (≥90% bootstrap
support) conflicting bipartitions between gene trees. Addi-
tional to phylogenetic recombination detection, we employed
methods specifically developed to detect homologous intra-
genic recombination. We used the compatibility approach
between site histories, based on the pairwise homoplasy
index (PHI), developed by Bruen et al. [70] and implemented
within the program PhiPack [71]. Bruen et al. have suggested
PHI is a more robust and sensitive method than many of the
earlier approaches. Additional to the PHI statistic, for com-
parative purposes, we computed MaxChi [72] and NSS [73]p
values for recombination using PhiPack (employing 1,000
permutations).
Positive selection analysis
We employed the branch-site test of Yang and Nielsen [20,74]
implemented in the program Codeml of the package PAML
[67] to assess positive selection at particular sites and line-
ages. Briefly, the likelihood of a model that does not allow
positive selection is compared to one allowing positive selec-
tion on some specified lineages. The model allowing positive
selection is tested using a likelihood ratio test (LRT) that is
compared to a χ
2
statistic with two degrees of freedom. Like-
lihoods were estimated on the genes or species trees. For the
Streptococcus data set each lineage leading to the six different
species was tested. For the species analyses each of the line-
ages corresponding with the different strains was tested, as
well as several internal branches supported by the majority of
genes. Finally, p values were corrected for multiple hypothe-
sis testing using the Benjamini and Yekutieli method [75].
The effect of lineages, and genes' TIGR main role categories,
and their interaction were tested using an analysis of variance
on the LRT, using R. Role categories containing less than ten
genes were merged. If F-statistic was significant, Tukey's
'honest significant difference' multi-comparison method was
used to discriminate lineages and role categories associated
with different LRTs.
Additional data files
The following data are available with the online version of this
paper. Additional data file 1 is a gene content table that
describes the presence and absence of gene clusters per
genome. Additional data file 2 is a CSV text file listing the
composition of the clusters, with links to GenBank protein
accession numbers. Additional data file 3 contains several
tables detailing the gene gain, loss and duplication parsimony
reconstruction for the Streptococcus, S. pyogenes and S. aga-
lactiae pan-genomes. Results are presented for equal weights
as well as following a model that penalized gene gain with
respect to gene loss. Additional data file 4 is a table listing the
genes showing evidence of recombination and positive selec-
tion. Additional data file 5 is a table listing the genes and lin-
eages under positive selection for the four analyzed core-
genomes, with gene annotation from NCBI and TIGR.
Additional data file 1Gene content table describing the presence and absence of gene clusters per genomeGene content table describing the presence and absence of gene clusters per genomeClick here for fileAdditional data file 2Composition of the clusters, with links to GenBank protein acces-sion numbersComposition of the clusters, with links to GenBank protein acces-sion numbersClick here for fileAdditional data file 3Gene gain, loss and duplication parsimony reconstruction for the Streptococcus, S. pyogenes and S. agalactiae pan-genomesResults are presented for equal weights as well as following a model that penalized gene gain with respect to gene lossClick here for fileAdditional data file 4Genes showing evidence of recombination and positive selectionGenes showing evidence of recombination and positive selectionClick here for fileAdditional data file 5Genes and lineages under positive selection for the four analyzed core-genomes, with gene annotation from NCBI and TIGRGenes and lineages under positive selection for the four analyzed core-genomes, with gene annotation from NCBI and TIGRClick here for file
Acknowledgements
We thank Qi Sun and Robert Bukowsky for their help with the paralleliza-
tion of the analyses on a Windows cluster at the Computational Biology
Service Unit of Cornell University, Adam Siepel for helpful comments
regarding the frameshift problem, and Paulina Pavinski Bitar for help regard-
ing the manual frameshift check. This work was supported by Cornell Uni-
versity start-up funds and USDA grant 2006-35204-17422, awarded to MJS.
References
1. Awadalla P: The evolutionary genomics of pathogen
recombination. Nat Rev Genet 2003, 4:50-60.
2. Feil EJ, Holmes EC, Bessen DE, Chan MS, Day NP, Enright MC, Gold-
stein R, Hood DW, Kalia A, Moore CE, et al.: Recombination
within natural populations of pathogenic bacteria: short-
term empirical estimates and long-term phylogenetic
consequences. Proc Natl Acad Sci USA 2001, 98:182-187.
R71.16 Genome Biology 2007, Volume 8, Issue 5, Article R71 Lefébure and Stanhope />Genome Biology 2007, 8:R71
3. Spratt BG, Hanage WP, Feil EJ: The relative contributions of
recombination and point mutation to the diversification of
bacterial clones. Curr Opin Microbiol 2001, 4:602-606.
4. Hao W, Golding GB: The fate of laterally transferred genes: life
in the fast lane to adaptation or death. Genome Res 2006,
16:636-643.
5. Ochman H, Lerat E, Daubin V: Examining bacterial species
under the specter of gene transfer and exchange. Proc Natl
Acad Sci USA 2005, 102(Suppl 1):6595-6599.
6. Charlesworth J, Eyre-Walker A: The rate of adaptive evolution
in enteric bacteria. Mol Biol Evol 2006, 23:1348-1356.
7. Chen SL, Hung CS, Xu J, Reigstad CS, Magrini V, Sabo A, Blasiar D,
Bieri T, Meyer RR, Ozersky P, et al.: Identification of genes sub-
ject to positive selection in uropathogenic strains of
Escherichia coli: a comparative genomics approach. Proc Natl
Acad Sci USA 2006, 103:5977-5982.
8. Snider LA, Swedo SE: PANDAS: current status and directions
for research. Mol Psychiatry 2004, 9:900-907.
9. Glaser P, Rusniok C, Buchrieser C, Chevalier F, Frangeul L, Msadek
T, Zouine M, Couve E, Lalioui L, Poyart C, et al.: Genome sequence
of Streptococcus agalactiae, a pathogen causing invasive
neonatal disease. Mol Microbiol 2002, 45:1499-1513.
10. Farley MM: Group B streptococcal disease in nonpregnant
adults. Clin Infect Dis 2001, 33:556-561.
11. Lancefield RC: A serological differenciation of specific types of
bovine hemolytic streptococci (group B). J Exp Med 1934,
59:441-458.
12. O'Brien KL, Nohynek H: Report from a WHO Working Group:
standard method for detecting upper respiratory carriage of
Streptococcus pneumoniae. Pediatr Infect Dis J 2003, 22:1-11.
13. Loesche WJ: Role of Streptococcus mutans in human dental
decay. Microbiol Rev 1986, 50:353-380.
14. Smith HE, Buijs H, Wisselink HJ, Stockhofe-Zurwieden N, Smits MA:
Selection of virulence-associated determinants of Strepto-
coccus suis serotype 2 by in vivo. Infect Immun 2001,
69:1961-1966.
15. Tang J, Wang C, Feng Y, Yang W, Song H, Chen Z, Yu H, Pan X, Zhou
X, Wang H, et al.: Streptococcal toxic shock syndrome caused
by Streptococcus suis serotype 2. PLoS Med 2006, 3:e151.
16. Marri P, Hao W, Golding G: Gene gain and gene loss in Strepto-
coccus: is it driven by habitat? Mol Biol Evol 2006, 23:2379-2391.
17. Nielsen R, Yang Z: Likelihood models for detecting positively
selected amino acid sites and applications to the HIV-1 enve-
lope gene. Genetics 1998, 148:929-936.
18. Yang Z, Nielsen R: Estimating synonymous and nonsynony-
mous substitution rates under realistic evolutionary models.
Mol Biol Evol 2000, 17:32-43.
19. Yang Z, Nielsen R, Goldman N, Pedersen AM: Codon-substitution
models for heterogeneous selection pressure at amino acid
sites. Genetics 2000, 155:431-449.
20. Yang Z, Nielsen R: Codon-substitution models for detecting
molecular adaptation at individual sites along specific
lineages. Mol Biol Evol 2002, 19:908-917.
21. Yang Z, Wong WSW, Nielsen R: Bayes empirical bayes infer-
ence of amino acid sites under positive selection. Mol Biol Evol
2005, 22:1107-1118.
22. Tettelin H, Masignani V, Cieslewicz MJ, Donati C, Medini D, Ward
NL, Angiuoli SV, Crabtree J, Jones AL, Durkin AS, et al.: Genome
analysis of multiple pathogenic isolates of Streptococcus
agalactiae: implications for the microbial "pan-genome".
Proc Natl Acad Sci USA 2005, 102:13950-13955.
23. Hao W, Golding GB: Patterns of bacterial gene movement. Mol
Biol Evol 2004, 21:1294-1307.
24. Makarova K, Slesarev A, Wolf Y, Sorokin A, Mirkin B, Koonin E, Pav-
lov A, Pavlova N, Karamychev V, Polouchine N, et al.: Comparative
genomics of the lactic acid bacteria. Proc Natl Acad Sci USA 2006,
103:15611-15616.
25. Anisimova M, Bielawski J, Yang Z: Accuracy and power of Bayes
prediction of amino acid sites under positive selection. Mol
Biol Evol 2002, 19:950-958.
26. Boussau B, Karlberg EO, Frank AC, Legault BA, Andersson SGE:
Computational inference of scenarios for alpha-proteobac-
terial genome evolution. Proc Natl Acad Sci USA 2004,
101:9722-9727.
27. Snel B, Bork P, Huynen MA: Genomes in flux: the evolution of
archaeal and proteobacterial gene content. Genome Res 2002,
12:17-25.
28. Kunin V, Ouzounis CA: The balance of driving forces during
genome evolution in prokaryotes. Genome Res 2003,
13:1589-1594.
29. Csurös M, Miklós I: A probabilistic model for gene content evo-
lution with duplication, loss and horizontal transfer. In
Research in Computational Molecular Biology Edited by: Apostolico A,
Guerra C, Istrail S, Pevzner P, Waterman M. Berlin: Springer;
2006:206-220. [Kanade T, Kittler J, Kleinberg JM, Mattern F, Mitchell
JC, Nierstrasz O, Noar M, Rangan CP, Steffen B, Sudan M, et al.
(Series Editors): Lecture Notes in Computer Science, vol. 3909]
30. Brochet M, Couvé E, Zouine M, Vallaeys T, Rusniok C, Lamy MC,
Buchrieser C, Trieu-Cuot P, Kunst F, Poyart C, et al.: Genomic
diversity and evolution within the species Streptococcus
agalactiae. Microbes Infect 2006, 8:1227-1243.
31. Daubin V, Moran NA, Ochman H: Phylogenetics and the cohe-
sion of bacterial genomes. Science 2003, 301:829-832.
32. Lerat E, Daubin V, Moran NA: From gene trees to organismal
phylogeny in prokaryotes: the case of the gamma-Proteo-
bacteria. PLoS Biol 2003, 1:E19.
33. Lerat E, Daubin V, Ochman H, Moran NA: Evolutionary origins of
genomic repertoires in bacteria. PLoS Biol 2005, 3:e130.
34. Susko E, Leigh J, Doolittle WF, Bapteste E: Visualizing and assess-
ing phylogenetic congruence of core gene sets: a case study
of the gamma-proteobacteria. Mol Biol Evol 2006, 23:1019-1030.
35. Täpp J, Thollesson M, Herrmann B: Phylogenetic relationships
and genotyping of the genus Streptococcus by sequence
determination of the RNase P RNA gene, rnpB. Int J Syst Evol
Microbiol 2003, 53:1861-1871.
36. Arends JP, Zanen HC: Meningitis caused by Streptococcus suis in
humans. Rev Infect Dis 1988, 10:131-137.
37. Anisimova M, Nielsen R, Yang Z: Effect of recombination on the
accuracy of the likelihood method for detecting positive
selection at amino acid sites. Genetics 2003, 164:1229-1236.
38. Davies HD, McGeer A, Schwartz B, Green K, Cann D, Simor AE, Low
DE: Invasive group A streptococcal infections in Ontario,
Canada. Ontario Group A Streptococcal Study Group. N
Engl J Med 1996, 335:547-554.
39. Kaul R, McGeer A, Low DE, Green K, Schwartz B: Population-
based surveillance for group A streptococcal necrotizing fas-
ciitis: Clinical features, prognostic indicators, and microbio-
logic analysis of seventy-seven cases. Ontario Group A
Streptococcal Study. Am J Med 1997, 103:18-24.
40. Li Z, Sakota V, Jackson D, Franklin AR, Beall B: Array of M protein
gene subtypes in 1064 recent invasive group A streptococcus
isolates recovered from the active bacterial core
surveillance. J Infect Dis 2003, 188:1587-1592.
41. O'Brien KL, Beall B, Barrett NL, Cieslak PR, Reingold A, Farley MM,
Danila R, Zell ER, Facklam R, Schwartz B, et al.: Epidemiology of
invasive group A Streptococcus disease in the United States,
1995-1999. Clin Infect Dis 2002, 35:268-276.
42. Sharkawy A, Low DE, Saginur R, Gregson D, Schwartz B, Jessamine P,
Green K, McGeer A: Severe group a streptococcal soft-tissue
infections in Ontario: 1992-1996. Clin Infect Dis 2002,
34:454-460.
43. Li L, Stoeckert CJJ, Roos DS: OrthoMCL: identification of
ortholog groups for eukaryotic genomes. Genome Res 2003,
13:2178-2189.
44. Paik S, Senty L, Das S, Noe JC, Munro CL, Kitten T: Identification
of virulence determinants for endocarditis in Streptococcus
sanguinis by signature-tagged mutagenesis. Infect Immun 2005,
73:6064-6074.
45. Mengin-Lecreulx D, Falla T, Blanot D, van Heijenoort J, Adams DJ,
Chopra I: Expression of the Staphylococcus aureus UDP-N-
acetylmuramoyl-L-alanyl-D-glutamate:L-lysine ligase in
Escherichia coli and effects on peptidoglycan biosynthesis and
cell growth. J Bacteriol 1999, 181:5909-5914.
46. Beres SB, Richter EW, Nagiec MJ, Sumby P, Porcella SF, DeLeo FR,
Musser JM: Molecular genetic anatomy of inter- and intrasero-
type variation in the human bacterial pathogen group A
Streptococcus. Proc Natl Acad Sci USA 2006, 103:7059-7064.
47. Luan SL, Granlund M, Sellin M, Lagergard T, Spratt BG, Norgren M:
Multilocus sequence typing of Swedish invasive group B
streptococcus isolates indicates a neonatally associated
genetic lineage and capsule switching. J Clin Microbiol 2005,
43:3727-3733.
48. Bisharat N, Crook DW, Leigh J, Harding RM, Ward PN, Coffey TJ,
Maiden MC, Peto T, Jones N: Hyperinvasive neonatal group B
streptococcus has arisen from a bovine ancestor. J Clin Microbiol
2004, 42:2161-2167.
Genome Biology 2007, Volume 8, Issue 5, Article R71 Lefébure and Stanhope R71.17
comment reviews reports refereed researchdeposited research interactions information
Genome Biology 2007, 8:R71
49. Kim YR, Brinsmade SR, Yang Z, Escalante-Semerena J, Fierer J: Muta-
tion of phosphotransacetylase but not isocitrate lyase
reduces the virulence of Salmonella enterica serovar Typh-
imurium in mice. Infect Immun 2006, 74:2498-2502.
50. Lindahl G, Stalhammar-Carlemalm M, Areschoug T: Surface pro-
teins of Streptococcus agalactiae and related proteins in other
bacterial pathogens. Clin Microbiol Rev 2005, 18:102-127.
51. Piddock LJV: Multidrug-resistance efflux pumps - not just for
resistance. Nat Rev Microbiol 2006, 4:629-636.
52. Bielawski JP, Dunn KA, Sabehi G, Beja O: Darwinian adaptation of
proteorhodopsin to different light intensities in the marine
environment. Proc Natl Acad Sci USA 2004, 101:14824-14829.
53. Ivarsson Y, Mackey AJ, Edalat M, Pearson WR, Mannervik B: Identi-
fication of residues in glutathione transferase capable of driv-
ing functional diversification in evolution. A novel approach
to protein redesign. J Biol Chem 2003, 278:8733-8738.
54. Sawyer SL, Wu LI, Emerman M, Malik HS: Positive selection of pri-
mate TRIM5alpha identifies a critical species-specific retro-
viral restriction domain. Proc Natl Acad Sci USA 2005,
102:2832-2837.
55. VanDongen S: Graph clustering by flow simulation. In PhD thesis
University of Utrecht, The Netherlands; 2000.
56. The R Project for Statistical Computing [http://www.r-
project.org/]
57. Swofford DL: PAUP*. Phylogenetic Analysis Using Parsimony (*and Other
Methods). Version 4 Sunderland, Massachusetts: Sinauer Associates;
2002.
58. Thompson J, Higgins D, Gibson T: CLUSTAL W: improving the
sensitivity of progressive multiple sequence alignment
through sequence weighting, positions-specific gap penalties
and weight matrix choice. Nucleic Acids Res Suppl 1994,
22:4673-4680.
59. Perrodou E, Deshayes C, Muller J, Schaeffer C, VanDorsselaer A, Ripp
R, Poch O, Reyrat JM, Lecompte O: ICDS database: interrupted
CoDing sequences in prokaryotic genomes. Nucleic Acids Res
Suppl 2006, 34(Database issue):D338-D343.
60. Medigue C, Rose M, Viari A, Danchin A: Detecting and analyzing
DNA sequencing errors: toward a higher quality of the Bacil-
lus subtilis genome sequence. Genome Res 1999, 9:1116-1127.
61. Bininda-Emonds ORP: transAlign: using amino acids to facili-
tate the multiple alignment of protein-coding DNA
sequences. BMC Bioinformatics 2005, 6:156.
62. Holmes EC, Urwin R, Maiden MC: The influence of recombina-
tion on the population structure and evolution of the human
pathogen Neisseria meningitidis. Mol Biol Evol 1999, 16:741-749.
63. Feil EJ, Holmes EC, Bessen DE, Chan MS, Day NP, Enright MC, Gold-
stein R, Hood DW, Kalia A, Moore CE, et al.: Recombination
within natural populations of pathogenic bacteria: short-
term empirical estimates and long-term phylogenetic
consequences. Proc Natl Acad Sci USA 2001, 98:182-187.
64. Shimodaira H: An approximately unbiased test of phylogenetic
tree selection. Syst Biol 2002, 51:492-508.
65. Filée J, Bapteste E, Susko E, Krisch HM: A selective barrier to hor-
izontal gene transfer in the T4-type bacteriophages that has
preserved a core genome with the viral replication and
structural genes. Mol Biol Evol 2006, 23:1688-1696.
66. Guindon S, Gascuel O: A simple, fast, and accurate algorithm
to estimate large phylogenies by maximum likelihood. Syst
Biol 2003, 52:696-704.
67. Yang Z: PAML: a program package for phylogenetic analysis
by maximum likelihood. Comput Appl Biosci 1997, 13:555-556.
68. Shimodaira H, Hasegawa M: CONSEL: for assessing the confi-
dence of phylogenetic tree selection. Bioinformatics 2001,
17:1246-1247.
69. Felsenstein J: Confidence limits on phylogenies: An approach
using the bootstrap. Evolution Int J Org Evolution 1985, 39:783-791.
70. Bruen TC, Philippe H, Bryant D: A simple and robust statistical
test for detecting the presence of recombination. Genetics
2006, 172:2665-2681.
71. Trevor's Bruen homepage [ />72. MaynardSmith J: Analyzing the mosaic structure of genes. J Mol
Evol 1992, 34:126-129.
73. Jakobsen IB, Easteal S: A program for calculating and displaying
compatibility matrices as an aid in determining reticulate
evolution in molecular sequences. Comput Appl Biosci 1996,
12:291-295.
74. Zhang J, Nielsen R, Yang Z: Evaluation of an improved branch-
site likelihood method for detecting positive selection at the
molecular level. Mol Biol Evol 2005, 22:2472-2479.
75. Benjamini Y, Yekutieli D: The control of the false discovery rate
in multiple testing under dependency. Ann Stat 2001,
29:1165-1188.
76. Ferretti JJ, McShan WM, Ajdic D, Savic DJ, Savic G, Lyon K, Primeaux
C, Sezate S, Suvorov AN, Kenton S, et al.: Complete genome
sequence of an M1 strain of Streptococcus pyogenes. Proc Natl
Acad Sci USA 2001, 98:4658-4663.
77. Sumby P, Porcella SF, Madrigal AG, Barbian KD, Virtaneva K, Ricklefs
SM, Sturdevant DE, Graham MR, Vuopio-Varkila J, Hoe NP, et al.:
Evolutionary origin and emergence of a highly successful
clone of serotype M1 group a Streptococcus involved multiple
horizontal gene transfer events. J Infect Dis 2005, 192:771-782.
78. Smoot JC, Barbian KD, VanGompel JJ, Smoot LM, Chaussee MS, Sylva
GL, Sturdevant DE, Ricklefs SM, Porcella SF, Parkins LD, et al.:
Genome sequence and comparative microarray analysis of
serotype M18 group A Streptococcus strains associated with
acute rheumatic fever outbreaks. Proc Natl Acad Sci USA 2002,
99:4668-4673.
79. Beres SB, Sylva GL, Barbian KD, Lei B, Hoff JS, Mammarella ND, Liu
MY, Smoot JC, Porcella SF, Parkins LD, et al.: Genome sequence of
a serotype M3 strain of group A Streptococcus: phage-
encoded toxins, the high-virulence phenotype, and clone
emergence. Proc Natl Acad Sci USA 2002, 99:10078-10083.
80. Green NM, Zhang S, Porcella SF, Nagiec MJ, Barbian KD, Beres SB,
LeFebvre RB, Musser JM: Genome sequence of a serotype M28
strain of group a Streptococcus: potential new insights into
puerperal sepsis and bacterial disease specificity. J Infect Dis
2005, 192:760-770.
81. Nakagawa I, Kurokawa K, Yamashita A, Nakata M, Tomiyasu Y, Oka-
hashi N, Kawabata S, Yamazaki K, Shiba T, Yasunaga T, et al.:
Genome sequence of an M3 strain of Streptococcus pyogenes
reveals a large-scale genomic rearrangement in invasive
strains and new insights into phage evolution. Genome Res
2003, 13:1042-1055.
82. Banks DJ, Porcella SF, Barbian KD, Beres SB, Philips LE, Voyich JM,
DeLeo FR, Martin JM, Somerville GA, Musser JM: Progress toward
characterization of the group A Streptococcus metagenome:
complete genome sequence of a macrolide-resistant sero-
type M6 strain. J Infect Dis 2004, 190:727-738.
83. Hoskins J, Alborn WEJ, Arnold J, Blaszczak LC, Burgett S, DeHoff BS,
Estrem ST, Fritz L, Fu DJ, Fuller W, et al.: Genome of the bacte-
rium Streptococcus pneumoniae strain R6. J Bacteriol 2001,
183:5709-5717.
84. Tettelin H, Nelson KE, Paulsen IT, Eisen JA, Read TD, Peterson S, Hei-
delberg J, DeBoy RT, Haft DH, Dodson RJ, et al.: Complete
genome sequence of a virulent isolate of Streptococcus
pneumoniae. Science 2001, 293:498-506.
85. Ajdic D, McShan WM, McLaughlin RE, Savic G, Chang J, Carson MB,
Primeaux C, Tian R, Kenton S, Jia H, et al.: Genome sequence of
Streptococcus mutans UA159, a cariogenic dental pathogen.
Proc Natl Acad Sci USA 2002, 99:14434-14439.
86. Tettelin H, Masignani V, Cieslewicz MJ, Eisen JA, Peterson S, Wessels
MR, Paulsen IT, Nelson KE, Margarit I, Read TD, et al.: Complete
genome sequence and comparative genomic analysis of an
emerging human pathogen, serotype V Streptococcus
agalactiae. Proc Natl Acad Sci USA 2002, 99:12391-12396.
87. Bolotin A, Quinquis B, Renault P, Sorokin A, Ehrlich SD, Kulakauskas
S, Lapidus A, Goltsman E, Mazur M, Pusch GD, et al.: Complete
sequence and comparative genome analysis of the dairy bac-
terium Streptococcus thermophilus. Nat Biotechnol 2004,
22:1554-1558.