INTRODUCTION TO KNOWLEDGE DISCOVERY AND DATA MINING - CHAPTER 5 docx
Bạn đang xem bản rút gọn của tài liệu. Xem và tải ngay bản đầy đủ của tài liệu tại đây (194.98 KB, 19 trang )
61
Chapter 5
Automatic Clustering Detection
When human beings try to make sense of complex questions, our natural tendency is
to break the subject into smaller pieces, each of which can be explained more simply.
Clustering is a technique used for combining observed objects into groups or clusters
such that:
Each group or cluster is homogeneous or compact with respect to certain
characteristics. That is, objects in each group are similar to each other.
Each group should be different from other groups with respect to the same
characteristics; that is, objects of one group should be different from the ob-
jects of other groups.
5.1 Searching for Clusters
For most data mining tasks, we start out with a pre-classified training set and attempt
to develop a model capable of predicting how a new record will be classified. In clus-
tering, there is no pre-classified data and no distinction between independent and de-
pendent variables. Instead, we are searching for groups of recordsthe clustersthat
are similar to one another, in the expectation that similar records represent similar
customers or suppliers or products that will behave in similar ways.
Automatic cluster detection is rarely used in isolation because finding clusters is not
an end in itself. Once clusters have been detected, other methods must be applied in
order to figure out what the clusters mean. When clustering is successful, the results
can be dramatic: One famous early application of cluster detection led to our current
understanding of stellar evolution.
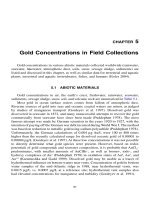
Star Light, Star Bright. Early in this century, astronomers trying to understand the
relationship between the luminosity (brightness) of stars and their temperatures, made
scatter plots like the one in Figure 5.1. The vertical scale measures luminosity in mul-
tiples of the brightness of our own sun. The horizontal scale measures surface tem-
perature in degrees Kelvin (degrees centigrade above absolute 0, the theoretical cold-
est possible temperature where molecular motion ceases). As you can see, the stars
plotted by astronomers, Hertzsprung and Russell, fall into three clusters. We now
understand that these three clusters represent stars in very different phases in the stel-
lar life cycle.
Knowledge Discovery and Data Mining
62
Figure 5.1 The Hertzsprung-Russell diagram clusters stars.
The relationship between luminosity and temperature is consistent within each cluster,
but the relationship is different in each cluster because a fundamentally different
process is generating the heat and light. The 80 percent of stars that fall on the main
sequence are generating energy by converting hydrogen to helium through nuclear
fusion. This is how all stars spend most of their life.
But after 10 billion years or so, the hydrogen gets used up. Depending on the star’s
mass, it then begins fusing helium or the fusion stops. In the latter case, the core of
the star begins to collapse, generating a great deal of heat in the process. At the same
time, the outer layer of gasses expands away from the core. A red giant is formed.
Eventually, the outer layer of gasses is stripped away and the remaining core begins
to cool. The star is now a white dwarf. A recent query of the Alta Vista web index us-
ing the search terms “HR diagram” and “main sequence” returned many pages of
links to current astronomical research based on cluster detection of this kind. This
simple, two-variable cluster diagram is being used today to hunt for new kinds of
stars like “brown dwarfs” and to understand main sequence stellar evolution.
Fitting the Troops. We chose the Hertzsprung-Russell diagram as our introductory
example of clustering because with only two variables, it is easy to spot the clusters
visually. Even in three dimensions, it is easy to pick out clusters by eye from a scatter
plot cube. If all problems had so few dimensions, there would be no need for auto-
matic cluster detection algorithms. As the number of dimensions (independent vari-
ables) increases, our ability to visualize clusters and our intuition about the distance
between two points quickly break down.
When we speak of a problem as having many dimensions, we are making a geometric
analogy. We consider each of the things that must be measured independently in or-
der to describe something to be a dimension. In other words, if there are N variables,
63
we imagine a space in which the value of each variable represents a distance along
the corresponding axis in an N-dimensional space. A single record containing a value
for each of the N variables can be thought of as the vector that defines a particular
point in that space.
5.2 The K-means method
The K-means method of cluster detection is the most commonly used in practice. It
has many variations, but the form described here was first published by J.B. Mac-
Queen in 1967. For ease of drawing, we illustrate the process using two-dimensional
diagrams, but bear in mind that in practice we will usually be working in a space of
many more dimensions. That means that instead of points described by a two-element
vector (x
1
, x
2
), we work with points described by an n-element vector (x
1
, x
2
, , x
n
).
The procedure itself is unchanged.
In the first step, we select K data points to be the seeds. MacQueen’s algorithm sim-
ply takes the first K records. In cases where the records have some meaningful order,
it may be desirable to choose widely spaced records instead. Each of the seeds is an
embryonic cluster with only one element. In this example, we use outside information
about the data to set the number of clusters to 3.
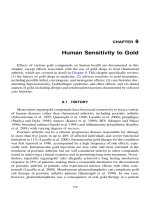
In the second step, we assign each record to the cluster whose centroid is nearest. In
Figure 5.2 we have done the first two steps. Drawing the boundaries between the
clusters is easy if you recall that given two points, X and Y, all points that are equi-
distant from X and Y fall along a line that is half way along the line segment that
joins X and Y and perpendicular to it. In Figure 5.2, the initial seeds are joined by
dashed lines and the cluster boundaries constructed from them are solid lines. Of
course, in three dimensions, these boundaries would be planes and in N dimensions
they would be hyper-planes of dimension N-1.
Figure 5.2: The initial sets determine the initial cluster boundaries
Knowledge Discovery and Data Mining
64
As we continue to work through the K-means algorithm, pay particular attention to
the fate of the point with the box drawn around it. On the basis of the initial seeds, it
is assigned to the cluster controlled by seed number 2 because it is closer to that seed
than to either of the others.
At this point, every point has been assigned to one or another of the three clusters
centered about the original seeds. The next step is to calculate the centroids of the
new clusters. This is simply a matter of averaging the positions of each point in the
cluster along each dimension. If there are 200 records assigned to a cluster and we are
clustering based on four fields from those records, then geometrically we have 200
points in a 4-dimensional space. The location of each point is described by a vector of
the values of the four fields. The vectors have the form (X
1
, X
2
, X
3
, X
4
). The value of
X
1
for the new centroid is the mean of all 200 X
l
s and similarly for X
2
, X
3
and X
4
.
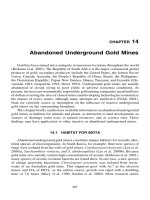
Figure 5.3: Calculating the centroids of the new clusters
In Figure 5.3 the new centroids are marked with a cross. The arrows show the motion
from the position of the original seeds to the new centroids of the clusters formed
from those seeds. Once the new clusters have been found, each point is once again
assigned to the cluster with the closest centroid. Figure 5.4 shows the new cluster
boundariesformed, as before, by drawing lines equidistant between each pair of
centroids. Notice that the point with the box around it, which was originally assigned
to cluster number 2, has now been assigned to cluster number 1. The process of as-
signing points to cluster and then recalculating centroids continues until the cluster
boundaries stop changing.
5.2.1 Similarity, Association, and Distance
After reading the preceding description of the K-means algorithm, we hope you agree
that once the records in a database have been mapped to points in space, automatic
cluster detection is really quite simplea little geometry, some vector means, and
that’s all! The problem, of course, is that the databases we encounter in marketing,
sales, and customer support are not about points in space. They are about purchases,
65
phone calls, airplane trips, car registrations, and a thousand other things that have no
obvious connection to the dots in a cluster diagram. When we speak of clustering re-
cords of this sort, we have an intuitive notion that members of a cluster have some
kind of natural association; that they are more similar to each other than to records in
another cluster. Since it is difficult to convey intuitive notions to a computer, we must
translate the vague concept of association into some sort of numeric measure of the
degree of similarity. The most common method, but by no means the only one, is to
translate all fields into numeric values so that the records may be treated as points in
space. Then, if two points are close in the geometric sense, we assume that they rep-
resent similar records in the database. Two main problems with this approach are:
1. Many variable types, including all categorical variables and many numeric
variables such as rankings, do not have the right behavior to properly be
treated as components of a position vector.
2. In geometry, the contributions of each dimension are of equal importance, but
in our databases, a small change in one field may be much more important
than a large change in another field.
Figure 5.4: At each iteration all cluster assignments are reevaluated
A Variety of Variables. Variables can be categorized in various ways—by mathe-
matical properties (continuous, discrete), by storage type (character, integer, floating
point), and by other properties (quantitative, qualitative). For this discussion, how-
ever, the most important classification is how much the variable can tell us about its
placement along the axis that corresponds to it in our geometric model. For this pur-
pose, we can divide variables into four classes, listed here in increasing order of suit-
ability for the geometric model: Categories, Ranks, Intervals, True measures.
Categorical variables only tell us to which of several unordered categories a thing
belongs. We can say that this ice cream is pistachio while that one is mint-cookie, but
we cannot say that one is greater than the other or judge which one is closer to black
cherry. In mathematical terms, we can tell that X Y, but not whether X > Y or Y <
X.
Ranks allow us to put things in order, but don’t tell us how much bigger one thing is
than another. The valedictorian has better grades than the salutatorian, but we don’t
Knowledge Discovery and Data Mining
66
know by how much. If X, Y, and Z are ranked 1, 2, and 3, we know that X > Y > Z,
but not whether (X-Y) > (Y- Z).
Intervals allow us to measure the distance between two observations. If we are told
that it is 56 in San Francisco and 78 in San Jose, we know that it is 22 degrees
warmer at one end of the bay than the other.
True measures are interval variables that measure from a meaningful zero point. This
trait is important because it means that the ratio of two values of the variable is mean-
ingful. The Fahrenheit temperature scale used in the United States and the Celsius
scale used in most of the rest of the world do not have this property. In neither system
does it make sense to say that a 30 day is twice as warm as a 15 day. Similarly, a
size 12 dress is not twice as large as a size 6 and gypsum is not twice as hard as talc
though they are 2 and 1 on the hardness scale. It does make perfect sense, however, to
say that a 50-year-old is twice as old as a 25-year-old or that a 10-pound bag of sugar
is twice as heavy as a 5-pound one. Age, weight, length, and volume are examples of
true measures.
Geometric distance metrics are well-defined for interval variables and true measures.
In order to use categorical variables and rankings, it is necessary to transform them
into interval variables. Unfortunately, these transformations add spurious information.
If we number ice cream flavors 1 through 28, it will appear that flavors 5 and 6 are
closely related while flavors 1 and 28 are far apart. The inverse problem arises when
we transform interval variables and true measures into ranks or categories. As we go
from age (true measure) to seniority (position on a list) to broad categories like “vet-
eran” and “new hire”, we lose information at each step.
5.2.2 Formal Measures of Association
There are dozens if not hundreds of published techniques for measuring the similarity
of two records. Some have been developed for specialized applications such as com-
paring passages of text. Others are designed especially for use with certain types of
data such as binary variables or categorical variables. Of the three we present here,
the first two are suitable for use with interval variables and true measures while the
third is suitable for categorical variables.
The Distance between Two Points. Each field in a record becomes one element in a
vector describing a point in space. The distance between two points is used as the
measure of association. If two points are close in distance, the corresponding records
are considered similar. There are actually a number of metrics that can be used to
measure the distance between two points (see aside), but the most common one is the
Euclidean distance we all learned in high school. To find the Euclidean distance be-
tween X and Y, we first find the differences between the corresponding elements of
X and Y (the distance along each axis) and square them.
67
Distance Metrics. Any function that takes two points and produces a single
number describing a relationship between them is a candidate measure of asso-
ciation, but to be a true distance metric, it must meet the following criteria:
Distance(X,Y) = 0 if and only if X = Y
Distance(X,Y) 0 for all X and all Y
Distance(X,Y) = Distance(Y,X)
Distance(X,Y) Distance(X,Z) + Distance(X,Y)
The Angle between Two Vectors. Sometimes we would like to consider two records
to be closely associated because of similarities in the way the fields within each re-
cord are related. We would like to cluster minnows with sardines, cod, and tuna,
while clustering kittens with cougars, lions, and tigers even though in a database of
body-part lengths, the sardine is closer to the kitten than it is to the tuna.
The solution is to use a different geometric interpretation of the same data. Instead of
thinking of X and Y as points in space and measuring the distance between them, we
think of them as vectors and measure the angle between them. In this context, a vec-
tor is the line segment connecting the origin of our coordinate system to the point de-
scribed by the vector values. A vector has both magnitude (the distance from the ori-
gin to the point) and direction. For our purposes, it is the direction that matters.
If we take the values for length of whiskers, length of tail, overall body length, length
of teeth, and length of claws for a lion and a house cat and plot them as single points,
they will be very far apart. But if the ratios of lengths of these body parts to one an-
other are similar in the two species, than the vectors will be nearly parallel. The angle
between vectors provides a measure of association that is not influenced by differ-
ences in magnitude between the two things being compared (see Figure 5.5). Actually,
the sine of the angle is a better measure since it will range from 0 when the vectors
are closest (most nearly parallel) to 1 when they are perpendicular without our having
to worry about the actual angles or their signs.
Figure 5.5: The angle between vectors as a measure of association
Knowledge Discovery and Data Mining
68
The Number of Features in Common. When the variables in the records we wish to
compare are categorical ones, we abandon geometric measures and turn instead to
measures based on the degree of overlap between records. As with the geometric
measures, there are many variations on this idea. In all variations, we compare two
records field by field and count the number of fields that match and the number of
fields that don’t match. The simplest measure is the ratio of matches to the total num-
ber of fields. In its simplest form, this measure counts two null fields as matching
with the result that everything we don’t know much about ends up in the same cluster.
A simple improvement is to not include matches of this sort in the match count. If, on
the other hand, the usual degree of overlap is low, you can give extra weight to
matches to make sure that even a small overlap is rewarded.
5.2.3 What K-Means
Clusters form some subset of the field variables tend to vary together. If all the vari-
ables are truly independent, no clusters will form. At the opposite extreme, if all the
variables are dependent on the same thing (in other words, if they are co-linear), then
all the records will form a single cluster. In between these extremes, we don’t really
know how many clusters to expect. If we go looking for a certain number of clusters,
we may find them. But that doesn’t mean that there aren’t other perfectly good clus-
ters lurking in the data where we could find them by trying a different value of K. In
his excellent 1973 book, Cluster Analysis for Applications, M. Anderberg uses a deck
of playing cards to illustrate many aspects of clustering. We have borrowed his idea
to illustrate the way that the initial choice of K, the number of cluster seeds, can have
a large effect on the kinds of clusters that will be found. In descriptions of K-means
and related algorithms, the selection of K is often glossed over. But since, in many
cases, there is no a priori reason to select a particular value, we always need to per-
form automatic cluster detection using one value of K, evaluating the results, then
trying again with another value of K.
A A A A
K K K K
Q Q Q Q
J J J J
10 10 10 10
9 9 9 9
8 8 8 8
7 7 7 7
6 6 6 6
5 5 5 5
4 4 4 4
3 3 3 3
2 2 2 2
Figure 5.6: K=2 clustered by color
69
A A A A
K K K K
Q Q Q Q
J J J J
10 10 10 10
9 9 9 9
8 8 8 8
7 7 7 7
6 6 6 6
5 5 5 5
4 4 4 4
3 3 3 3
2 2 2 2
Figure 5.7: K=2 clustered by Old Maid rules
After each trial, the strength of the resulting clusters can be evaluated by comparing
the average distance between records in a cluster with the average distance between
clusters, and by other procedures described later in this chapter. But the clusters must
also be evaluated on a more subjective basis to determine their usefulness for a given
application.
As shown in Figures 5.6, 5.7, 5.8, 5.9, and 5.10, it is easy to create very good clusters
from a deck of playing cards using various values for K and various distance meas-
ures. In the case of playing cards, the distance measures are dictated by the rules of
various games. The distance from Ace to King, for example, might be 1 or 12 de-
pending on the game.
A A A A
K K K K
Q Q Q Q
J J J J
10 10 10 10
9 9 9 9
8 8 8 8
7 7 7 7
6 6 6 6
5 5 5 5
4 4 4 4
3 3 3 3
2 2 2 2
Figure 5.8. K=2 clustered by rules for War, Beggar My Neighbor, and other games
Knowledge Discovery and Data Mining
70
A A A A
K K K K
Q Q Q Q
J J J J
10 10 10 10
9 9 9 9
8 8 8 8
7 7 7 7
6 6 6 6
5 5 5 5
4 4 4 4
3 3 3 3
2 2 2 2
Figure 5.9: K=3 clustered by rules of Hearts
K = N?. Even with playing cards, some values of K don’t lead to good clustersat
least not with distance measures suggested by the card games known to the authors.
There are obvious clustering rules for K = 1, 2, 3, 4, 8, 13, 26, and 52. For these val-
ues we can come up with “perfect” clusters where each element of a cluster is equi-
distant from every other member of the cluster, and equally far away from the mem-
bers of some other cluster. For other values of K, we have the more familiar situation
that some cards do not seem to fit particularly well in any cluster.
A A A A
K K K K
Q Q Q Q
J J J J
10 10 10 10
9 9 9 9
8 8 8 8
7 7 7 7
6 6 6 6
5 5 5 5
4 4 4 4
3 3 3 3
2 2 2 2
Figure 5.10: K=4 clustered by suit
71
5.2.4 The Importance of Weights
It is important to differentiate between the notions of scaling and weighting. They are
not the same, but they are often confused. Scaling deals with the problem that differ-
ent variables are measured in different units. Weighting deals with the problem that
we care about some variables more than others.
In geometry, all dimensions are equally important. Two points that differ by 2 in di-
mensions X and Y and by 1 in dimension Z are the same distance from one another as
two other points that differ by 1in dimension X and by 2 in dimensions Y and Z. We
don’t even ask what units X, Y, and Z are measured in; it doesn’t matter, so long as
they are the same.
But what if X is measured in yards, Y is measured in centimeters, and Z is measured
in nautical miles? A difference of 1 in Z is now equivalent to a difference of 185,200
in Y or 2,025 in X. Clearly, they must all be converted to a common scale before dis-
tances will make any sense. Unfortunately, in commercial data mining there is usu-
ally no common scale available because the different units being used are measuring
quite different things. If we are looking at plot size, house-hold size, car ownership,
and family income, we cannot convert all of them to acres or dollars. On the other
hand, it seems bothersome that a difference of 20 acres in plot size is indistinguish-
able from a change of $20 in income. The solution is to map all the variables to a
common range (often 0 to 1 or -1 to 1). That way, at least the ratios of change be-
come comparabledoubling plot size will have the same effect as doubling income.
We refer to this re-mapping to a common range as scaling. But what if we think that
two families with the same income have more in common than two families on the
same size plot, and we want that to be taken into consideration during clustering?
That is where weighting comes in.
There are three common ways of scaling variables to bring them all into comparable
ranges:
1. Divide each variable by the mean of all the values it takes on.
2. Divide each variable by the range (the difference between the lowest and high-
est value it takes on) after subtracting the lowest value.
3. Subtract the mean value from each variable and then divide by the standard de-
viation. This is often called “converting to z scores.”
Use Weights to Encode Outside Information. Scaling takes care of the problem
that changes in one variable appear more significant than changes in another simply
because of differences in the speed with which the units they are measured in get in-
cremented. Many books recommend scaling all variables to a normal form with a
mean of zero and a variance of one. That way, all fields contribute equally when the
distance between two records is computed. We suggest going farther. The whole
point of automatic cluster detection is to find clusters that make sense to you. If, for
your purposes, whether people have children is much more important than the num-
Knowledge Discovery and Data Mining
72
ber of credit cards they carry, there is no reason not to bias the outcome of the clus-
tering by multiplying the number of children field by a higher weight than the num-
ber of credit cards field.
After scaling to get rid of bias that is due to the units, you should use weights to in-
troduce bias based on your knowledge of the business context. Of course, if you want
to evaluate the effects of different weighting strategies, you will have to add yet an-
other outer loop to the clustering process. In fact, choosing weights is one of the op-
timization problems that can be addressed with genetic algorithms.
5.2.5 Variations on the K-Means Method
The basic K-means algorithm has many variations. It is likely that the commercial
software tools you find to do automatic clustering will incorporate some of these
variations. Among the differences you are likely to encounter are:
Alternate methods of choosing the initial seeds
Alternate methods of computing the next centroid
Using probability density rather than distance to associate records with clusters.
Of these, only the last is important enough to merit further discussion here.
Gaussian Mixture Models. The K-means method as we have described it has some
drawbacks.
It does not do well with overlapping clusters.
The clusters are easily pulled off center by outliers.
Figure 5.11: In the estimation step, each Gaussian is assigned some responsibility for
each point. Thicker indicate greater responsibility.
73
Each record is either in or out of a cluster; there is no notion of some records
being more or less likely than others to really belong to the cluster to which
they have been assigned.
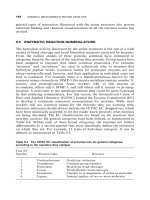
Gaussian mixture models are a probabilistic variant of K-means. Their name comes
from the Gaussian distribution, a probability distribution often assumed for high-
dimensional problems. As before, we start by choosing K seeds. This time, however,
we regard the seeds as means of Gaussian distributions. We then iterate over two
steps called the estimation step and the maximization step. In the estimation step, we
calculate the responsibility that each Gaussian has for each data point (see Figure
5.11). Each Gaussian has strong responsibility for points that are close to it and weak
responsibility for points that are distant. The responsibilities will be used as weights
in the next step. In the maximization step, the mean of each Gaussian is moved to-
wards the centroid of the entire data set, weighted by the responsibilities as illustrated
in Figure 5.12.
Figure 5.12: Each Gaussian mean is moved to the centroid of all the data points
weighted by the responsibilities for each point. Thicker arrows indicate higher
weights
These steps are repeated until the Gaussians are no longer moving. The Gaussians
themselves can grow as well as move, but since the distribution must always integrate
to one, a Gaussian gets weaker as it gets bigger. Responsibility is calculated in such a
way that a given point may get equal responsibility from a nearby Gaussian with low
variance and from a more distant one with higher variance. The reason this is called a
“mixture model” is that the probability at each data point is the sum of a mixture of
several distributions. At the end of the process, each point is tied to the various clus-
ters with higher or lower probability. This is sometimes called soft clustering.
5. 3 Agglomerative Methods
In the K-means approach to clustering, we start out with a fixed number of clusters
and gather all records into them. There is another class of methods that work by ag-
glomeration. In these methods, we start out with each data point forming its own
Knowledge Discovery and Data Mining
74
cluster and gradually merge clusters until all points have been gathered together in
one big cluster. Towards the beginning of the process, the clusters are very small and
very purethe members of each cluster are few, but very closely related. Towards
the end of the process, the clusters are large and less well-defined. The entire history
is preserved so you can choose the level of clustering that works best for your appli-
cation.
5.3.1 The Agglomerative Algorithm
The first step is to create a similarity matrix. The similarity matrix is a table of all the
pair-wise distances or degrees of association between points. As before, we can use
any of a large number of measures of association between records, including the
Euclidean distance, the angle between vectors, and the ratio of matching to non-
matching categorical fields. The issues raised by the choice of distance measures are
exactly the same as previously discussed in relation to the K-means approach.
Figure 5.13: Three methods of measuring the distance between clusters
At first glance you might think that if we have N data points we will need to make N2
measurements to create the distance table, but if we assume that our association
measure is a true distance metric, we actually only need half that because all true dis-
tance metrics follow the rule that Distance (X,Y) = Distance(Y,X). In the vocabulary of
mathematics, the similarity matrix is lower triangular. At the beginning of the process
there are N rows in the table, one for each record.
Next, we find the smallest value in the similarity matrix. This identifies the two clus-
ters that are most similar to one another. We merge these two clusters and update the
similarity matrix by replacing the two rows that described the parent cluster with a
new row that describes the distance between the merged cluster and the remaining
clusters. There are now N-1 clusters and N-1 rows in the similarity matrix.
We repeat the merge step N-1 times, after which all records belong to the same large
cluster. At each iteration we make a record of which clusters were merged and how
far apart they were. This information will be helpful in deciding which level of clus-
tering to make use of.
75
Distance between Clusters. We need to say a little more about how to measure dis-
tance between clusters. On the first trip through the merge step, the clusters to be
merged consist of single records so the distance between clusters is the same as the
distance between records, a subject we may already have said too much about. But on
the second and subsequent trips around the loop, we need to update the similarity ma-
trix with the distances from the new, multi-record cluster to all the others. How do we
measure this distance? As usual, there is a choice of approaches. Three common ones
are:
Single linkage
Complete linkage
Comparison of centroids
In the single linkage method, the distance between two clusters is given by the dis-
tance between their closest members. This method produces clusters with the prop-
erty that every member of a cluster is more closely related to at least one member of
its cluster than to any point outside it.
In the complete linkage method, the distance between two clusters is given by the dis-
tance between their most distant members. This method produces clusters with the
property that all members lie within some known maximum distance of one another.
In the third method, the distance between two clusters is measured between the cen-
troids of each. The centroid of a cluster is its average element. Figure 5.13 gives a
pictorial representation of all three methods.
Clusters and Trees. The agglomeration algorithm creates hierarchical clusters. At
each level in the hierarchy, clusters are formed from the union of two clusters at the
next level down. Another way of looking at this is as a tree, much like the decision
trees except that cluster trees are built by starting from the leaves and working to-
wards the root.
Clustering People by Age: An Example of Agglomerative Clustering. To illus-
trate agglomerative clustering, we have chosen an example of clustering in one di-
mension using the single linkage measure for distance between clusters. These
choices should enable you to follow the algorithm through all its iterations in your
head without having to worry about squares and square roots.
The data consists of the ages of people at a family gathering. Our goal is to cluster the
participants by age. Our metric for the distance between two people is simply the dif-
ference in their ages. Our metric for the distance between two clusters of people is the
difference in age between the oldest member of the younger cluster and the youngest
member of the older cluster. (The one dimensional version of the single linkage
measure.)
Knowledge Discovery and Data Mining
76
Because the distances are so easy to calculate, we dispense with the similarity matrix.
Our procedure is to sort the participants by age, then begin clustering by first merging
clusters that are 1 year apart, then 2 years, and so on until there is only one big cluster.
Figure 5.14 shows the state of the clusters after six iterations, with three clusters re-
maining. This is the level of clustering that seems the most useful. The algorithm ap-
pears to have clustered the population into three generations.
5.4 Evaluating Clusters
When using the K-means approach to cluster detection, we need a way to determine
what value of K finds the best clusters. Similarly, when using a hierarchical approach,
we need a test for which level in the hierarchy contains the best clusters. But what
does it mean to say that a cluster is good?
In general terms, we want clusters whose members have a high degree of similar-
ityor in geometric terns, are close to each otherand we want the clusters them-
selves to be widely spaced.
A standard measure of the within-cluster similarity is the variancethe sum of the
squared differences of each element from the mean, so we might simply look for the
solutions that produce the clusters with the lowest variance. But for hierarchical clus-
tering, this does not make sense since we always start out with clusters of one that
have no variance at all.
Figure 5.14: Single linkage clustering by age.
A good measure to use with hierarchical clusters is the difference between the dis-
tance value at which it was formed and the distance value at which it is merged into
the next level. Strong clusters, like the one linking 1 to 13-year-olds at distance 3 in
Figure 5.14, last a long time.
77
A general-purpose measure that works with any form of cluster detection is to take
whatever similarity measure or distance metric you used to form the clusters and use
it to compare the average distance within clusters to the average distance between
clusters. This can be done for each cluster individually and for the entire collection of
clusters.
If you find that there are one or two good clusters along with a number of weaker
ones, you may be able to improve your results by removing all members of the strong
clusters. You will want to isolate the strong clusters for further analysis anyway, and
removing their strong pull may allow new clusters to be detected in the records left
behind.
Inside the Cluster. Once you have found a strong cluster, you will want to analyze
what makes it special. What is it about the records in this cluster that causes them to
be lumped together? Even more importantly, is it possible to find rules and patterns
within this cluster now that the noise from the rest of the database has been elimi-
nated?
The easiest way to approach the first question is to take the mean of each variable
within the cluster and compare it to the mean of the same variable in the parent popu-
lation. Rank order the variables by the magnitude of the difference. Looking at the
variables that show the largest difference between the cluster and the rest of the data-
base will go a long way towards explaining what makes the cluster special. As for the
second question, that is what all the other data mining techniques are for!
Outside the Cluster. Clustering can be useful even when only a single cluster is
found. When screening for a very rare defect, there may not be enough examples to
train a directed data mining model to detect it. One example is testing electric motors
at the factory where they are made. Cluster detection methods can be used on a sam-
ple containing only good motors to determine the shape and size of the “normal”
cluster. When a motor comes along that falls outside the cluster for any reason, it is
suspect. This approach has been used in medicine to detect the presence of abnormal
cells in tissue samples.
5. 5 Other Approaches to Cluster Detection
In addition to the two approaches to automatic cluster detection described in this
chapter, there are two other approaches that make use of variations of techniques of
decision trees and neural networks.
Divisive Methods. We have already noted the similarity between the tree formed by
the agglomerative clustering techniques and the ones formed by decision tree algo-
rithms such as C4.5. Although the agglomerative methods work from the leaves to
the root, while the decision tree algorithms work from the root to the leaves, they
both create a similar hierarchical structure. The hierarchical structure reflects another
Knowledge Discovery and Data Mining
78
similarity between the methods. Decisions made early on in the process are never re-
visited, which means that some fairly simple clusters will not be detected if an early
split or agglomeration destroys the structure.
Seeing the similarity between the trees produced by the two methods, it is natural to
ask whether the algorithms used for decision trees may also be used for clustering.
The answer is yes. A decision tree algorithm starts with the entire collection of re-
cords and looks for a way to spit it into clusters that are purer, in some sense defined
by a diversity function. All that is required to turn this into a clustering algorithm is
to supply a diversity function chosen to either minimize the average intra-cluster dis-
tance or maximize the inter-cluster distances.
Self-Organizing Maps. Self-organizing maps are a variant of neural networks that
have been used for many years in applications such as feature detection in two-
dimensional images. More recently, they have been applied successfully for more
general clustering applications. There is a discussion of self-organizing neural net-
works.
5.6 Strengths and Weaknesses of Automatic Cluster Detection
5.6.1 The strengths of automatic cluster detection
The main strengths of automatic cluster detection are:
Automatic cluster detection is an unsupervised knowledge discovery
Automatic cluster detection works well with categorical, numeric, and textual
data
Easy to apply.
Automatic Cluster Detection Is Unsupervised. The chief strength of automatic
cluster detection is that it is undirected. This means that it can be applied even when
you have no prior knowledge of the internal structure of a database. Automatic clus-
ter detection can be used to uncover hidden structure that can be used to improve the
performance of more directed techniques.
Clustering Can Be Performed on Diverse Data Types. By choosing different dis-
tance measures, automatic clustering can be a plied to almost any kind of data. It is as
easy to find clusters in collections of new stories or insurance claims as in astronomi-
cal or financial data.
Automatic Cluster Detection Is Easy to Apply. Most cluster detection techniques
require very little massaging of the input data and there is no need to identify particu-
lar fields as inputs and others as outputs.
79
5.6.2 The weaknesses of automatic cluster detection
The main weaknesses of automatic cluster detection are:
It can be difficult to choose the right distance measures and weights.
Sensitivity to initial parameters.
It can be hard to interpret the resulting clusters.
Difficulty with Weights and Measures. The performance of automatic cluster detec-
tion algorithms is highly dependent on the choice of a distance metric or other simi-
larity measure. It is sometimes quite difficult to devise distance metrics for data that
contains a mixture of variable types. It can also be difficult to determine a proper
weighting scheme for disparate variable types.
Sensitivity to Initial Parameters. In the K-means method, the original choice of a
value for K determines the number of clusters that will be found. If this number does
not match the natural structure of the data, the technique will not obtain good results.
Difficulty Interpreting Results. A strength of automatic cluster detection is that it is
an unsupervised knowledge discovery technique. The flip side is that when you don’t
know what you are looking for, you may not recognize it when you find it! The clus-
ters you discover are not guaranteed to have any practical value.