Materials for the Hydrogen Economy (2007) Episode 9 pot
Bạn đang xem bản rút gọn của tài liệu. Xem và tải ngay bản đầy đủ của tài liệu tại đây (2.02 MB, 30 trang )
216 Materials for the Hydrogen Economy
The stability of Bi
2
O
3
was reported to improve by forming solid solution with
vanadium, which can be partially substituted with Co, Ni, or Cu. A so-called
BIMEVOX (bismuth metal–ion vanadium oxide) consists of oxygen vacancies in a
perovskite-like V-O layer, which possesses extremely high oxygen ion conductivity.
For instance, ionic conductivity reaches ~3 × 10
–3
S/cm at 300°C, which is nearly two
orders higher than any other oxygen ion conductors. The high reactivity and instabil
-
ity, however, hinder its further application in fuel cells as an electrolyte.
10.3 PEROVSKITES
10.3.1 l
aGaO
3
The perovskite structure is basically cubic with the general formula of ABO
3
, in
which A, the large cation site, is an alkali, alkaline earth, or rare earth ion, and B,
the small cation site, is a transition metal cation. The large cations are in 12-fold
coordination with oxygen, while the small cations t into octahedral positions. The
occupancy of these sites by different cations is determined primarily by ionic radius
rather than the valence. This opens the door for the materials scientists to substitute
selectively for either the A or B ion by introducing isovalent or aliovalent cations.
An oxygen ion conductor can be tailored because of the geometrical and chemi
-
cal exibility of the perovskite structure. This is borne out by (La,Sr)(Mg,Ga)O
3
(LSMG),
47–51
which has attracted great attention since its discovery.
52
There exist,
however, two drawbacks for LSMG electrolytes: (1) the uncertainty in the cost of Ga
sources and (2) the chemical and mechanical stability of LSMG. It is apparent that
ordering occurs (sometimes at specic temperatures) that signicantly decreases
the oxygen ionic conductivity because of lower defect mobility and reduced effec
-
tive vacancy concentration. Stevenson et al. studied the role of microstructure and
nonstoichiometry on ionic conductivity of LSMG.
53–55
The electrical conductivity of
sintered LSGM tends to decrease with increasing A/B cation nonstoichiometry. The
exural strength of LSGM with an A/B cation ratio of 1.00 was also measured and
found to be closer to 150 MPa at room temperature, and the strength decreased to
100 MPa at higher temperatures (600 to 1,000°C). The fracture toughness, as mea
-
sured by notched beam analysis, was closer to 2.0 to 2.2 MPa at room temperature,
with similar reduction to 1.0 MPa at 1,000°C.
10.3.2 Other phaSeS
There are many other solid-state oxide ion conductors, primarily derived from either
uorite or perovskite structures. The perovskite-related oxide ion conductors include
(1) Ln(Al,In,Sc,Y)O
3
-based materials, (2) the doped and undoped brownmillerite
Ba
2
In
2
O
5
, and (3) La
2
Mo
2
O
9
. The transference number of doped La
2
Mo
2
O
9
can be
higher than 0.99 in an oxidant environment. The drawbacks of La
2
Mo
2
O
9
-based
materials are instability in reducing conditions, a relatively large thermal expansion
coefcient (>16 ppm/K for La
1.7
Bi
0.3
Mo
2
O
9
), and the order of the anion sublattice.
Doped LaAlO
3
has reasonable ionic conductivity (~0.006 S/cm at 800°C) and excel-
lent thermal expansion coefcient (TEC) match with other components (~11 ppm/
K); however, it is rather challenging to sinter LaAlO
3
-based oxides and to prevent the
formation of highly insulating grain boundary phases (Al
2
O
3
).
5024.indb 216 11/18/07 5:53:37 PM
The Electrolytes for Solid-Oxide Fuel Cells 217
10.4 DISCUSSION
10.4.1 S
Olid SOlutiOn OF ZrO
2
-CeO
2
Bi-layers of Y-stabilized ZrO
2
and doped CeO
2
have been used to further improve
either the electrolyte stability or the electrode performance. For example, a thin layer
of YSZ (<0.5 µm) has been used between the doped CeO
2
electrolyte and the anode
to prevent the reduction of doped CeO
2
.
56
A thin CeO
2
layer placed between the YSZ
electrolyte and the cathode prevents interaction between them.
57
Also, mixtures of
the above two phases have been used as electrolyte layers. The objective for build
-
ing these structures has been to utilize the best properties for each component. As
has been reported in the literature, however, considerable interdiffusion between
ZrO
2
- and CeO
2
-based materials occurs at elevated temperatures (>1,400°C).
58–61
Solid solutions between ZrO
2
and CeO
2
are formed during high-temperature sinter-
ing, which can result in several problems. For example, the dimensional stability and
the electrical conductivity may be altered, which can affect the successful opera
-
tion of SOFCs. It has been shown that the overall electrical conductivity exhibited a
minimum when the fraction of Gd-doped CeO
2
(CGO) was about 50% in the system
of CGO
x
YSZ
1–x
.
60
10.4.1.1 Reaction between CGO Film and YSZ
62
CGO lm has been used as the protective layer to reduce the reaction between YSZ
and the La- and Sr-containing cathodes, which can form La
2
Zr
2
O
7
and SrZrO
3
. These
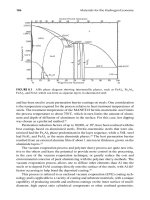
compounds exhibit a much higher resistance than YSZ. Figure 10.5 illustrates a plot
of d spacing of the YSZ phase and CGO phase as a function of annealing tempera
-
ture. Over the composition ranges used in this study, all of the sintered compositions
800 900 1000 1100 1200 1300 1400
5.10
5.15
5.20
5.25
5.30
5.35
5.40
28 29 30 31
YSZ
(111)
CGO
(111)
CGO 50mol%
YSZ 50mol%
Mixing powders
No calcining
1200°C
1300°C
1400°C
1500°C
Relative intensity
2 angle
CGO
YSZ
d spacing (nm)
Annealing temperature (°C)
FIGURE 10.5 A plot of d spacing for CGO lms on YSZ substrates as a function of anneal-
ing temperature. The inset illustrates the XRD of CGO and YSZ powders annealed at various
temperatures.
62
5024.indb 217 11/18/07 5:53:38 PM
218 Materials for the Hydrogen Economy
were single phase with a uorite structure. The lattice parameter followed Vegard’s
rule for solid solution.
58,62
The lattice parameter for YSZ was nearly constant when
the annealing temperature (T
a
) was less than 1,300°C, whereas peaks for the CGO
phase started to shift to higher angles when T
a
> 1,000°C. This indicates a decreas-
ing lattice parameter for CGO, as shown in gure 10.5. Diffusion of Y and Zr into
the CGO lattice was attributed to a decreasing lattice parameter for CGO because
Zr
4+
is smaller than Ce
4+
. Since the YSZ substrates in this study were dense tapes
with an average grain size of ~5 µm, it can be concluded that CGO thin lms pos
-
sessed a higher reactivity than YSZ substrates at T
a
< 1,300°C, which allowed Y and
Zr to diffuse into the thin lm.
10.4.1.2 Reaction between CGO and YSZ Powders
The mixing of CGO and YSZ powders with a similar average particle size enabled
the study of interdiffusion by simply annealing the mixture at an elevated tempera
-
ture, then studying powder diffraction results. Figure 10.5 illustrates X-ray diffrac
-
tion (XRD) patterns for a mixture of CGO and YSZ powders annealed from 1,200 to
1,500°C. The (111) peak for YSZ continuously shifted to a lower angle as the anneal
-
ing temperature increased, whereas the (111) peak for CGO was nearly constant.
Therefore, one can conclude that CGO diffuses into YSZ in powder mixtures at high
temperatures, which is contrary to what occurred for the system of CGO lms on a
YSZ substrate. Hence, an increase of lattice parameter for the composition of YSZ
can be attributed to the diffusion of Ce and Gd. On the other hand, if Ce and Gd did
diffuse into YSZ, the size of the CGO particles would become smaller during this
reaction process, which was conrmed by a line broadening of the (111) diffraction
peak of CGO.
10.4.1.3 Electrical Conductivity
Solid solutions of CGO-YSZ exhibited lower conductivity than that of either CGO
or YSZ. The activation energy (E
a
) and preexponential factor (σ
0
) can be obtained
by plotting ln(
σT) versus 1/T for CGO
x
YSZ
1–x
at high oxygen activity; the preex-
ponential factor,
σ
_
, appears to be independent of the CGO ratio. Therefore, the
observed decrease in conductivity, in particular at the intermediate-temperature
regime (~600°C), might be related to an increase in E
a
, which indicates a decrease in
the mobility of the oxide ion. Theoretical calculations by Butler et al.
63
showed that
the E
a
was dependent on the elastic strain energy on the association enthalpy for the
defect pair, which in turn was the effect of the ionic radius of the dopant.
11,64
Hence,
changes of E
a
in the system of CGO
x
YSZ
1–x
may be due to contributions by the ionic
radius difference between Ce
4+
and Zr
4+
.
Figure 10.6 shows the oxygen activity dependence of the conductivity of the
solid solutions containing 25, 50, and 75 mol% CGO. The conductivity values were
found to be independent of the processing methods. The oxygen activity–dependent
electronic conductivity behavior for the solid solution CGO
x
YSZ
1–x
is somewhat sur-
prising in that this system can still be considered an acceptor- (Y and Gd) doped
conductor. In the CeO
2
system, the electronic conduction is well known to be due to
5024.indb 218 11/18/07 5:53:39 PM
The Electrolytes for Solid-Oxide Fuel Cells 219
the redox reaction between Ce
4+
and Ce
3+
oxidation states, which are oxygen pres-
sure (activity) dependent. This reaction is expressed as
2Ce O 1 2O V Ce
Ce O 2 O Ce
'× × ∞∞
+ → + + 2
(Kröger–Vink notation)
65
(10.2)
The reduction energy has been calculated and found to be reduced by the introduc
-
tion of zirconia because of the formation of defect clusters, such as
Ce V Ce
Zr
'
O Zr
'
− −
∞∞
.
66
This type of defect cluster increases the electronic conductivity in two ways: (1) the
oxygen ion mobility decreases because of the trapping of oxygen vacancies, and (2) the
electronic conductivity increases since the carrier concentration, n = [Ce'
Ce
] increases
due to the decrease in the reduction energy.
10.4.2 SiZe eFFeCt On iOniC COnduCtiOn in ySZ
A large discrepancy exists in the electrical conductivity of nanocrystalline-doped
ZrO
2
thin lms. On one hand, enhanced electrical conductivity
67–70
and oxygen dif-
fusivity
71
are reported in the literature, whereas on the other hand, conductivity in
agreement with microcrystalline specimens,
72,73
or even a decreasing conductivity, is
reported in YSZ thin lms.
74
Kosacki et al.
67–69,75
studied the electrical conductivity of yttria- and scandia-
doped zirconia thin lms deposited onto either single-crystal alumina or magne
-
sia substrates. Their study showed that the electrical conductivity of YSZ can be
enhanced signicantly at thickness <60 nm
68
(gure 10.7). The highly textured YSZ
lms were deposited by pulsed laser ablation. After annealing, the lms were well
crystallized. Epitaxial growth of the YSZ lms on the MgO substrates was obtained,
which was not the case for Guo et al.’s lms.
74
When the lm thickness is reduced
from 2,000 nm to 60 nm, and both the current path length and lm width are kept
the same, the resistance of the lms is inversely proportional to lm thickness.
-20 -18 -16 -14 -12 -10 -8 -6 -4 -2 0
-3.0
-2.5
-2.0
-1.5
-1.0
-0.5
25mol% CGO
50mol% CGO
75mol% CGO
CGO
YSZ
800°C
log(
/(S·cm
-1
)
log(pO
2
/atm)
FIGURE 10.6 A plot of log(σ) vs. log(pO
2
) for CGO
x
YSZ
1–x
(x = 1, 0.75, 0.5, and 0.25) solid
solution measured at 800°C.
62
5024.indb 219 11/18/07 5:53:42 PM
220 Materials for the Hydrogen Economy
This scale effect indicates that the electrical conductivity is nearly constant for the
lms varying in thickness from 60 to 2,000 nm. The measured resistance, however,
decreased when the lm thickness further reduced. Both DC and AC conductivity
measurements indicated that there was an enhanced conductivity for lm thickness
of <60 nm. They further proposed three orders of magnitude larger conductivity in
1.6-nm-thick lms than lattice conductivity. Since the grain size was not provided,
68
it is unknown whether only the grain size plays a role when a lm’s thickness is less
than 60 nm. Guo et al.
74
deposited YSZ thin lms by pulsed laser deposition on MgO
substrates with thicknesses of 12 and 25 nm. The electrical conductivity was mea
-
sured in both dry and humid O
2
. The electrical conductivity in thin lms, however,
was found to be four times lower than ionic conductivity in microcrystalline speci
-
mens, as shown in gure 10.8. Furthermore, they found that there is not any remark
-
able proton conduction in the nanostructured lms when annealed in water vapor.
10.4.3 Grain SiZe and Grain bOundary thiCkneSS
Mondal and Hahn
72
used XRD to determine grain size. XRD line broadening pro-
vides a characteristic size of a material, as x-ray coherence length can be considered
the size for a single crystal in a specimen. In addition to obtaining the accurate XRD
line-broadening analysis, it is also considered that the x-ray coherence length may be
different from the grain size. Unfortunately, electron microscopy was not employed
to examine the microstructure. Moreover, the DC conductivity measurements were
not provided to compare with AC impedance results. It is therefore difcult to com
-
FIGURE 10.7 Electronic conductivity as a function of temperature for nanocrystalline YSZ
lms.
68
5024.indb 220 11/18/07 5:53:43 PM
The Electrolytes for Solid-Oxide Fuel Cells 221
pare their results with conductivities in thin lms. The activation energies for bulk
transport in Y
0.06
Zr
0.94
O
1.97
, however, are ~0.1 to 0.2 eV smaller than those from the
literature, indicating a possible enhanced conductivity in nanocrystalline materials.
Guo et al.
74
proposed that there exists a “de-doping” effect in nanometer-thick
YSZ lms, which results in a lower bulk conductivity in nanocrystalline YSZ (grain
size ~ 80 nm, thickness = 12 and 25 nm) than in the microcrystalline specimen.
They predicted that the conductivity of nanostructured YSZ (e.g., ≤5 nm) will be
even smaller, analyzing from a space charge model. Because XRD results were not
provided, neither the crystallinity nor the existence of the second phase is known in
YSZ lms grown by Pulsed Laser Deposition (PLD). However, electrical measure
-
ments were carefully carried out in both dry and wet O
2
, and the overall conductivity
in their YSZ lms is lower than that of bulk YSZ (grain size > 15 µm) by a factor of
4 (gure 10.8).
10.4.4 Stability OF CeO
2
FOr lOw-temperature OperatiOn
It is known that Gd-doped CeO
2
can be reduced at very low oxygen partial pres-
sures. Table 10.2 is a list of P
*
O
2
(atm) for various dopant levels, y, in Ce
1–y
Gd
y
O
1–y/2
at different temperatures.
76
P
*
O
2
represents the the oxygen partial pressure at which
the ionic transference number of the solid solution becomes 0.5. Because the elec
-
trons have a much higher mobility (~3 orders higher) than oxygen ions, a transfer
number of 0.5 only indicates that the electron concentration (Ce
3+
) is about 0.1% of
the oxygen vacancy concentration. However, further reduction will result in lattice
expansion due to the formation of a large number of Ce
3+
, as shown by Yasuda and
Hishinuma
77
(gure 10.9).
FIGURE 10.8 Conductivity as a function of 1/T for nanocrystalline YSZ lm.
74
5024.indb 221 11/18/07 5:53:45 PM
222 Materials for the Hydrogen Economy
10.4.5 Grain bOundary eFFeCtS
Lower-temperature operation does pose a problem due to the higher activation energy
of the grain boundary resistivity, ρ
gb
. A high ρ
gb
can be due to many factors, includ-
ing (1) amorphous phases, (2) dopant segregation, (3) an altered local defect chem
-
istry due to space charge effects, and (4) intergranular porosity (small effect). These
effects are all strongly related to grain size and the associated grain boundary area.
Among these, the rst factor is typically predominant, as impurities such as silicon
form insulating phases that tend to wet the grains, and hence effectively block the
ionic current. An example is that the lattice conductivity in Ce
0.90
Gd
0.10
O
1.95
(CGO10)
is higher than that in Ce
0.80
Gd
0.20
O
1.90
(CGO20); however, CGO20 often has higher
TABLE 10.2
P
*
O
2
(atm) for Various Dopant Levels, y, in Ce
1–y
Gd
y
O
1–y/2
at Different
Temperatures
y Temperature (°C)
700 750 800 850
0.1 1.3 × 10
-17
2.53 × 10
-16
2.43 × 10
-15
3.56 × 10
-14
0.2 1.24 × 10
-19
3.92 × 10
-18
9.2 × 10
-17
1.73 × 10
-15
0.3 3.16 × 10
-19
5.6 × 10
-18
8.5 × 10
-17
9.0 × 10
-16
0.4 9.3 × 10
-19
8.8 ×10
-18
6.3 × 10
-17
3.85 × 10
-16
0.5 1.46 × 10
-16
1.38 × 10
-15
1.12 × 10
-14
6.5 × 10
-14
CG020 1000°C
CG020 900°C
CG020 800°C
CG020 700°C
CG020 600°C
CG010 1000°C
CG010 900°C
CG010 800°C
CG010 700°C
CG010 600°C
-25 -20 -15 -10 -5 0
log (Po
2
/atm)
2.0
1.5
1.0
0.5
0.0
-0.5
6L/L [%]
log Po
2
in fuel (H
2
O/CH
4
=2)
600
700
800
900
1000
FIGURE 10.9 Relative expansion of GDC10 and GDC 20. (After Yasuda, I. and Hishinuma,
M., Electrochem. Soc. Proc., 97, 178, 1997.)
5024.indb 222 11/18/07 5:53:47 PM
The Electrolytes for Solid-Oxide Fuel Cells 223
total conductivity, likely due to the greater grain boundary conductivity in CGO20.
Moreover, in reducing environments, the electronic contribution to the overall con
-
ductivity in CGO10 is larger than that in CGO20, indicating that the cerium ions in
CGO10 can be reduced more easily than in CGO20.
The grain boundary resistance, shown in Figure 10.10, is a plot of R
gb
/R
t
as a
function of grain size for Ce
0.90
Gd
0.10
O
1.95
measured between 300 and 500ºC. A
reduction of the R
gb
/R
t
ratio is observed as the grain size increases. The raw materi-
als used for conductivity measurements were of high purity (99.95%), indicating low
levels of impurities (particularly Si). Hence, the insulating glassy phase is consid
-
ered negligible over the measuring temperature range. This behavior is explained
by a trapping phenomenon, which has been observed in the transport of oxide ions
in oxide conductors.
33
This phenomenon has been modeled for several oxygen ion
conductors at the temperature where acceptor dopant–oxygen vacancy complexes
dissociate. It is worth mentioning that the trend shown in Figure 10.10 is contrary
to undoped CeO
2
,
78
in which the grain boundary contribution to the total resistance
increases with increasing grain size.
10.5 CONCLUSIONS
In SOFCs, the difference in chemical potential or activity of oxygen across the elec-
trolyte surfaces provides the electromotive force, and thus the electrical potential.
Extensive research over the past decades has resulted in the development of cost-
effective processes for the fabrication of thin and dense electrolyte layers. YSZ has
been considered one of the best choices for high-temperature applications (>650°C)
because of its feasibility of fabrication of a thin membrane, reasonable ionic conduc
-
tivity, large ionic domain, and, most importantly, chemical and mechanical stability
0.0 0.5 1.0 1.5
0.00
0.05
0.10
0.15
0.20
0.25
0.30
Ce
0.90
Gd
0.10
O
1.95
500
o
C
300
o
C
400
o
C
R
gb
/(R
gb
+R
g
)
Grain Size ( m)
FIGURE 10.10 A plot of R
gb
/R
t
as a function of grain size for doped CeO
2
.
78
5024.indb 223 11/18/07 5:53:49 PM
224 Materials for the Hydrogen Economy
in an oxidizing and reducing environment. Doped CeO
2
, on the other hand, is a
leading candidate for the fuel cells operating at temperatures below 600°C, during
which the chemically induced expansion is negligible and its high ionic conductivity
is fully taken advantage of.
REFERENCES
1. U.S. DOE (Department of Energy), Fuel Cells: Power for the 21st Century, U.S. DOE,
Washingtn, DC. 2004.
2. Singh, P., Minh, N.Q., Solid oxide fuel cells: technology status,
International Journal
of Applied Ceramic Technology, 2004, 1, 5–15.
3. Steele, B.C.H., Material science and engineering: the enabling technology for the
commercialisation of fuel cell systems,
Journal of Materials Science, 2001, 36,
1053–1068.
4. Steele, B.C.H. and Heinzel, A., Materials for fuel-cell technologies,
Nature, 2001, 414,
345–352.
5. Badwal, S.P.S. and Foger, K., Solid oxide electrolyte fuel cell review,
Ceramics Inter-
national, 1996, 22, 257–265.
6. Stoukides, M., Solid-electrolyte membrane reactors: current experience and future out
-
look,
Catalysis Reviews: Science and Engineering, 2000, 42, 1–70.
7. Jiang, S.P., A review of wet impregnation: an alternative method for the fabrication of
high performance and nano-structured electrodes of solid oxide fuel cells,
Materials
Science and Engineering A: Structural Materials Properties Microstructure and Pro-
cessing, 2006, 418, 199–210.
8. Kharton, V.V., Marques, F.M.B., and Atkinson, A., Transport properties of solid oxide
electrolyte ceramics: a brief review,
Solid State Ionics, 2004, 174, 135–149.
9. Sammes, N.M., Tompsett, G.A., Nafe, H., and Aldinger, F., Bismuth based oxide elec
-
trolytes: structure and ionic conductivity,
Journal of the European Ceramic Society,
1999, 19, 1801–1826.
10. Shuk, P., Wiemhofer, H.D., Guth, U., Gopel, W., and Greenblatt, M., Oxide ion con
-
ducting solid electrolytes based on Bi
2
O
3
, Solid State Ionics, 1996, 89, 179–196.
11. Kilner, J.A. and Brook, R.J., A study of oxygen ion conductivity in doped nonstoichio
-
metric oxides,
Solid State Ionics, 1982, 6, 237–252.
12. Alcaide, F., Cabot, P.L., and Brillas, E., Fuel cells for chemicals and energy cogenera
-
tion,
Journal of Power Sources, 2006, 153, 47–60.
13. Paydar, M.H., Hadian, A.M., and Falek, G., A new look at oxygen pumping char
-
acteristics of BICUVOX.1 solid electrolyte,
Journal of Materials Science, 2006, 41,
1953–1957.
14. Kharton, V.V., Naumovich, E.N., Yaremchenko, A.A., and Marques, F.M.B., Research
on the electrochemistry of oxygen ion conductors in the former Soviet Union. IV.
Bismuth oxide-based ceramics,
Journal of Solid State Electrochemistry, 2001, 5,
160–187.
15. Simner, S.P., SuarezSandoval, D., Mackenzie, J.D., and Dunn, B., Synthesis, densica
-
tion, and conductivity characteristics of BICUVOX oxygen-ion-conducting ceramics,
Journal of the American Ceramic Society, 1997, 80, 2563–2568.
16. Iharada, T., Hammouche, A., Fouletier, J., Kleitz, M., Boivin, J.C., and Mairesse, G.,
Electrochemical characterization of BIMEVOX oxide-ion conductors,
Solid State Ion-
ics, 1991, 48, 257–265.
17. Corbel, G. and Lacorre, P., Compatibility evaluation between La
2
Mo
2
O
9
fast oxide-
ion conductor and Ni-based materials,
Journal of Solid State Chemistry, 2006, 179,
1339–1344.
5024.indb 224 11/18/07 5:53:50 PM
The Electrolytes for Solid-Oxide Fuel Cells 225
18. Yang, J.H., Wen, Z.Y., Gu, Z.H., and Yan, D.S., Ionic conductivity and micro structure
of solid electrolyte La
2
Mo
2
O
9
prepared by spark-plasma sintering, Journal of the Euro-
pean Ceramic Society, 2005, 25, 3315–3321.
19. Lacorre, P., Goutenoire, F., Bohnke, O., Retoux, R., and Laligant, Y., Designing fast
oxide-ion conductors based on La
2
Mo
2
O
9
, Nature, 2000, 404, 856–858.
20. Shlyakhtina, A.V., Abrantes, J.C.C., Levchenko, A.V., Stefanovich, S.Y., Knot’ko, A.V.,
Larina, L.L., and Shcherbakova, L.G., New oxide-ion conductors Ln(2 + x)Ti(2 – x)O(7
– X/2) (Ln = Dy-Lu; x = 0.096), in
Advanced Materials Forum III, Parts 1 and 2,
Vols. 514–516, Trans Tech Publications Ltd., Zurich-Uetikon, Switzerland, 2006, pp.
422–426.
21. Bae, J.M. and Steele, B.C.H., Properties of pyrochlore ruthenate cathodes for interme
-
diate temperature solid oxide fuel cells,
Journal of Electroceramics, 1999, 3, 37–46.
22. Shimura, T., Komori, M., and Iwahara, H., Ionic conduction in pyrochlore-type oxides
containing rare earth elements at high temperature,
Solid State Ionics, 1996, 86–88,
685–689.
23. Takamura, H. and Tuller, H.L., Ionic conductivity of Gd
2
GaSbO
7
-Gd
2
Zr
2
O7 solid solu-
tions with structural disorder,
Solid State Ionics, 2000, 134, 67–73.
24. Yu, T.H. and Tuller, H.L., Electrical conduction and disorder in the pyrochlore system
(Gd
1–x
Ca
x
)(2)Sn
2
O7, Journal of Electroceramics, 1998, 2, 49–55.
25. Yu, T.H. and Tuller, H.L., Ionic conduction and disorder in the Gd
2
Sn
2
O
7
pyrochlore
system,
Solid State Ionics, 1996, 86–88, 177–182.
26. Kramers, S.A. and Tuller, H.L., A novel titanate-based oxygen-ion conductor: Gd
2
Ti
2
O
7
,
Solid State Ionics, 1995, 82, 15–23.
27. Kramer, S., Spears, M., and Tuller, H.L., Conduction in titanate pyrochlores: role of
dopants,
Solid State Ionics, 1994, 72, 59–66.
28. Tuller, H.L., Mixed ionic electronic conduction in a number of uorite and pyrochlore
compounds,
Solid State Ionics, 1992, 52, 135–146.
29. Sansom, J.E.H., Najib, A., and Slater, P.R., Oxide ion conductivity in mixed Si/Ge-
based apatite-type systems,
Solid State Ionics, 2004, 175, 353–355.
30. Yaremchenko, A.A., Shaula, A.L., Kharton, V.V., Waerenborgh, J.C., Rojas, D.P.,
Patrakeev, M.V., and Marques, F.M.B., Ionic and electronic conductivity of La
9.83
-
xPrxSi
4.5
Fe
1.5
O
26
+/–delta apatites, Solid State Ionics, 2004, 171, 51–59.
31. Arachi, Y., Sakai, H., Yamamoto, O., Takeda, Y., and Imanishai, N., Electrical conduc
-
tivity of the ZrO
2
-Ln(2)O(3) (Ln = lanthanides) system, Solid State Ionics, 1999, 121,
133–139.
32. Steele, B.C.H., Materials for IT-SOFC stacks 35 years R&D: the inevitability of gradu
-
alness?
Solid State Ionics, 2000, 134, 3–20.
33. Steele, B.C.H., Appraisal of Ce
1–y
Gd
y
O
2–y/2
electrolytes for IT-SOFC operation at 500
degrees C,
Solid State Ionics, 2000, 129, 95–110.
34. Steele, B.C.H., Oxygen-transport and exchange in oxide ceramics.
Journal of Power
Sources, 1994, 49, 1–14.
35. Inaba, H. and Tagawa, H., Ceria-based solid electrolytes: review,
Solid State Ionics,
1996, 83, 1–16.
36. Shannon, R.D., Revised effective ionic-radii and systematic studies of interatomic
distances in halides and chalcogenides,
Acta Crystallographica Section A, 1976, 32,
751–767.
37. Azad, A.M., Larose, S., and Akbar, S.A., Bismuth oxide-based solid electrolytes for
fuel-cells,
Journal of Materials Science, 1994, 29, 4135–4151.
38. Wachsman, E.D., Effect of oxygen sublattice order on conductivity in highly defective
uorite oxides,
Journal of the European Ceramic Society, 2004, 24, 1281–1285.
39. Wachsman, E.D., Functionally gradient bilayer oxide membranes and electrolytes,
Solid State Ionics, 2002, 152, 657–662.
5024.indb 225 11/18/07 5:53:50 PM
226 Materials for the Hydrogen Economy
40. Jiang, N.X., Wachsman, E.D., and Jung, S.H., A higher conductivity Bi
2
O
3
-based elec-
trolyte,
Solid State Ionics, 2002, 150, 347–353.
41. Wachsman, E.D., Boyapati, S., Kaufman, M.J., and Jiang, N.X., Modeling of ordered
structures of phase-stabilized cubic bismuth oxides,
Journal of the American Ceramic
Society, 2000, 83, 1964–1968.
42. Wachsman, E.D., Ball, G.R., Jiang, N., and Stevenson, D.A., Structural and defect stud
-
ies in solid oxide electrolytes,
Solid State Ionics, 1992, 52, 213–218.
43. Jiang, N.X. and Wachsman, E.D., Structural stability and conductivity of phase-sta
-
bilized cubic bismuth oxides,
Journal of the American Ceramic Society, 1999, 82,
3057–3064.
44. Bogicevic, A., Wolverton, C., Crosbie, G.M., and Stechel, E.B., Defect ordering in
aliovalently doped cubic zirconia from rst principles,
Physical Review B, 2001, 64,
014106.
45. Boyapati, S., Wachsman, E.D., and Chakoumakos, B.C., Neutron diffraction study
of occupancy and positional order of oxygen ions in phase stabilized cubic bismuth
oxides,
Solid State Ionics, 2001, 138, 293–304.
46. Goff, J.P., Hayes, W., Hull, S., Hutchings, M.T., and Clausen, K.N., Defect structure of
yttria-stabilized zirconia and its inuence on the ionic conductivity at elevated tem
-
peratures,
Physical Review B, 1999, 59, 14202.
47. Huang, K.Q., Tichy, R.S., and Goodenough, J.B., Superior perovskite oxide-ion con
-
ductor; strontium- and magnesium-doped LaGaO
3
. I. Phase relationships and electrical
properties,
Journal of the American Ceramic Society, 1998, 81, 2565–2575.
48. Huang, K.Q., Tichy, R., and Goodenough, J.B., Superior perovskite oxide-ion conduc
-
tor; strontium- and magnesium-doped LaGaO
3
. III. Performance tests of single ceramic
fuel cells,
Journal of the American Ceramic Society, 1998, 81, 2581–2585.
49. Huang, K.Q., Feng, M., Goodenough, J.B., and Milliken, C., Electrode performance
test on single ceramic fuel cells using as electrolyte Sr- and Mg-doped LaGaO
3
, Jour-
nal of the Electrochemical Society, 1997, 144, 3620–3624.
50. Yan, J.W., Lu, Z.G., Jiang, Y., Dong, Y.L., Yu, C.Y., and Li, W.Z., Fabrication and test
-
ing of a doped lanthanum gallate electrolyte thin-lm solid oxide fuel cell,
Journal of
the Electrochemical Society, 2002, 149, A1132–A1135.
51. Lerch, M., Boysen, H., and Hansen, T., High-temperature neutron scattering investiga
-
tion of pure and doped lanthanum gallate,
Journal of Physics and Chemistry of Solids,
2001, 62, 445–455.
52. Ishihara, T., Matsuda, H., and Takita, Y., Doped LaGaO
3
perovskite-type oxide as
a new oxide ionic conductor,
Journal of the American Chemical Society, 1994, 116,
3801–3803.
53. Stevenson, J.W., Hasinska, K., Caneld, N.L., and Armstrong, T.R., Inuence of cobalt
and iron additions on the electrical and thermal properties of (La,Sr)(Ga,Mg)O
3
-delta,
Journal of the Electrochemical Society, 2000, 147, 3213–3218.
54. Baskaran, S., Lewinsohn, C.A., Chou, Y.S., Qian, M., Stevenson, J.W., and Armstrong,
T.R., Mechanical properties of alkaline earth-doped lanthanum gallate,
Journal of
Materials Science, 1999, 34, 3913–3922.
55. Stevenson, J.W., Armstrong, T.R., Pederson, L.R., Li, J., Lewinsohn, C.A., and Bas
-
karan, S., Effect of A-site cation nonstoichiometry on the properties of doped lantha
-
num gallate,
Solid State Ionics, 1998, 115, 571–583.
56. Kim, S G., Yoon, S.P., Nam, S.W., Hyun, S H., and Hong, S A., Fabrication and char
-
acterization of a YSZ/YDC composite electrolyte by a sol-gel coating method,
Journal
of Power Sources, 2002, 110, 222.
57. Simner, S.P., Bonnett, J.F., Caneld, N.L., Meinhardt, K.D., Sprenkle, V.L., and Ste
-
venson, J.W., Optimized lanthanum ferrite-based cathodes for anode-supported SOFCs,
Electrochemical Solid-State Letters, 2002, 5, A173.
5024.indb 226 11/18/07 5:53:51 PM
The Electrolytes for Solid-Oxide Fuel Cells 227
58. Eguchi, K., Akasaka, N., Mitsuyasu, H., and Nonaka, Y., Process of solid state reaction
between doped ceria and zirconia,
Solid State Ionics, 2000, 135, 589–594.
59. Lee, C.H. and Choi, G.M., Electrical conductivity of CeO
2
-doped YSZ, Solid State
Ionics, 2000, 135, 653–661.
60. Tsoga, A., Naoumidis, A., and Stover, D., Total electrical conductivity and defect
structure of ZrO
2
-CeO
2
-Y
2
O
3
-Gd
2
O
3
solid solutions, Solid State Ionics, 2000, 135,
403–409.
61. Xiong, Y.P., Yamaji, K., Sakai, N., Negishi, H., Horita, T., and Yokokawa, H., Elec
-
tronic conductivity of ZrO
2
-CeO
2
-YO
1.5
solid solutions, Journal of the Electrochemical
Society, 2001, 148, E489–E492.
62. Zhou, X.D., Scarno, B., and Anderson, H.U., Electrical conductivity and stability of
Gd-doped ceria/Y-doped zirconia ceramics and thin lms,
Solid State Ionics, 2004,
175 19–22.
63. Butler, V., Catlow, C.R.A., Fender, B.E.F., and Harding, J.H., Dopant ion radius and
ionic-conductivity in cerium dioxide,
Solid State Ionics, 1983, 8, 109–113.
64. Kilner, J.A., Fast oxygen transport in acceptor doped oxides,
Solid State Ionics, 2000,
129, 13–23.
65. Kroger, F.A. and Vink, H.J., Relationships between the concentration of imperfections
in crystalline solids, in
Solid State Physics: Advances in Research and Applications,
Vol. 3, Seitz, F., Turnbull, T., Eds. Academic Press, New York, 1957, p. 307.
66. Balducci, G., Kaspar, J., Fornasiero, P., Graziani, M., Islam, M.S., and Gale, J.D., Com
-
puter simulation studies of bulk reduction and oxygen migration in CeO
2
-ZrO
2
solid
solutions,
Journal of Physical Chemistry B, 1997, 101, 1750–1753.
67. Kosacki, I., Anderson, H.U., Mizutani, Y., and Ukai, K., Nonstoichiometry and electri
-
cal transport in Sc-doped zirconia,
Solid State Ionics, 2002, 152, 431–438.
68. Kosacki, I., Rouleau, C.M., Becher, P.F., Bentley, J., and Lowndes, D.H., Nanoscale
effects on the ionic conductivity in highly textured YSZ thin lms,
Solid State Ionics,
2005, 176, 1319–1326.
69. Kosacki, I., Suzuki, T., Petrovsky, V., and Anderson, H.U., Electrical conductiv
-
ity of nanocrystalline ceria and zirconia thin lms,
Solid State Ionics, 2000, 136,
1225–1233.
70. Zhang, Y.W., Jin, S., Yang, Y., Li, G.B., Tian, S.J., Jia, J.T., Liao, C.S., and Yan, C.H.,
Electrical conductivity enhancement in nanocrystalline (RE
2
O
3
)(0.08)(ZrO
2
)(0.92)
(RE = Sc, Y) thin lms,
Applied Physics Letters, 2000, 77, 3409–3411.
71. Knoner, G., Reimann, K., Rower, R., Sodervall, U., and Schaefer, H.E., Enhanced
oxygen diffusivity in interfaces of nanocrystalline ZrO
2
center dot Y
2
O
3
, Proceed-
ings of the National Academy of Sciences of the United States of America, 2003, 100,
3870–3873.
72. Mondal, P. and Hahn, H., Investigation of the complex conductivity of nanocrystal
-
line Y
2
O
3
-stabilized zirconia, Berichte Der Bunsen-Gesellschaft-Physical Chemistry
Chemical Physics, 1997, 101, 1765–1768.
73. Jiang, S.S., Schulze, W.A., Amarakoon, V.R.W., and Stangle, G.C., Electrical prop
-
erties of ultrane-grained yttria-stabilized zirconia ceramics,
Journal of Materials
Research, 1997, 12, 2374–2380.
74. Guo, X., Vasco, E., Mi, S.B., Szot, K., Wachsman, E., and Waser, R., Ionic conduction
in zirconia lms of nanometer thickness,
Acta Materialia, 2005, 53, 5161–5166.
75. Kosacki, I., Petrovsky, V., and Anderson, H.U., Band gap energy in nanocrystalline
ZrO
2
: 16%Y thin lms, Applied Physics Letters, 1999, 74, 341–343.
76. Mogensen, M., Sammes, N.M., and Tompsett, G.A., Physical, chemical and electro
-
chemical properties of pure and doped ceria,
Solid State Ionics, 2000, 129, 63–94.
5024.indb 227 11/18/07 5:53:52 PM
228 Materials for the Hydrogen Economy
77. Yasuda, I. and Hishinuma, M., Electrical conductivity, dimensional instability and
internal stresses of CeO
2
-Gd
2
O
3
solid solutions, Electrochemical Society Proceedings,
1997, 97, 178–187.
78. Zhou, X.D., Huebner, W., and Anderson, H.U., Size effect on the electronic properties
of doped and undoped ceria, in
Defects and Diffusion in Ceramics: An Annual Retro-
spective VII, Vols. 242–244, Trans Tech Publications Ltd., Zurich-Uetikon, Switzer-
land, 2005, pp. 277–289.
5024.indb 228 11/18/07 5:53:53 PM
229
11
Corrosion and
Protection of Metallic
Interconnects in Solid-
Oxide Fuel Cells
Zhenguo Yang, Jeffry W. Stevenson,
and Prabhakar Singh
CONTENTS
11.1 Introduction 229
11.2 Corrosion of Oxidation-Resistant Alloys under SOFC Interconnect
Exposure Conditions 232
11.2.1 Oxidation and Corrosion at Metal–Gas Interfaces 232
11.2.1.1 Oxidation in Air, Cathode-Side Environment 233
11.2.1.2 Oxidation and Corrosion in Fuel, Anode-Side
Environment 233
11.2.1.3 Oxidation/Corrosion under Air–Fuel Dual-Exposure
Conditions 235
11.2.2 Corrosion at Interfaces with Adjacent Components 239
11.3 Surface Modication for Improved Stability 241
11.4 Summary 245
References 245
11.1 INTRODUCTION
Energy security and increased concern over environmental protection have spurred
a dramatic worldwide growth in research and development of fuel cells, which elec-
trochemically convert incoming fuel into electricity with no or low pollution. Fuel
cell technology has become increasingly attractive to a number of sectors, including
utility, automotive, and defense industries. Among the various types of fuel cells,
solid-oxide fuel cells (SOFCs) operate at high temperature (typically 650 to 1,000°C)
and have advantages in terms of high conversion efciency and the exibility of
using hydrocarbon fuels, in addition to hydrogen.
1–5
The high-temperature opera-
tion, however, can lead to increased mass transport and interactions between the
surrounding environment and components that are required to be stable during a
lifetime of thousands of hours and up to hundreds of thermal cycles. For stacks with
relatively low operating temperatures (<800ºC), the interconnects that are used to
5024.indb 229 11/18/07 5:53:53 PM
230 Materials for the Hydrogen Economy
electrically connect a number of cells in series (see gure 11.1) are typically made
from cost-effective metals or alloys. The metallic interconnects must demonstrate
excellent stability in a very challenging environment during SOFC operation, as they
are simultaneously exposed to both an oxidizing (air) environment on the cathode
side and a reducing environment (hydrogen or a reformed hydrocarbon fuel) on the
anode side. Other challenges include the fact that water vapor is likely to be present
in both of these environments, and the fuel is likely to contain impurities, such as
suldes. Since the fuel is usually a reformed hydrocarbon fuel, such as natural gas,
coal gas, biogas, gasoline, etc., the interconnect is exposed to a wet carbonaceous
environment at the anode side. Finally, the interconnect must be stable toward any
adjacent components, such as electrodes, seals, and electrical contact materials, with
which it is in physical contact.
Until recently, the leading candidate material for the interconnect was doped
lanthanum chromite, La
x
Sr
1–x
CrO
3
, a ceramic that could easily withstand traditional
900 to 1,000°C operating temperatures. However, several issues remain, including
the high cost of raw materials and fabrication, difculties in obtaining high-density
}
}
Air or O
2
, H
2
O
H
2
, CO, H
2
O, CO
2
Seals
PEN
}
Interconnect
}
PEN
Air or O
2
, H
2
O
Seals
Electrical
contacts
H
2
, CO, H
2
O, CO
2
Repeating
Unit-PEN
air
Fuel
Current flow
FIGURE 11.1 Planar design of solid-oxide fuel cell: (a) a stack repeat unit and (b) details
of a possible design.
5024.indb 230 11/18/07 5:53:57 PM
Corrosion and Protection of Metallic Interconnects 231
chromite parts at reasonable sintering temperatures,
1,6–9
and the tendency of the
chromite interconnect to partially reduce at the fuel gas–interconnect interface,
causing the component to warp and the peripheral seal to break.
1,10
The recent trend
in developing lower-temperature (650 to 800°C), more cost-effective cells that
utilize anode-supported, thin electrolytes
11,12
or new electrolytes with improved
conductivity
13,14
makes it feasible for lanthanum chromite to be supplanted by cost-
effective metals or alloys as the interconnect materials.
15–18
The metals are typi-
cally those alloys that contain “active” constituents, mainly Cr, Al, or Si, which are
preferentially oxidized at the surface to form an oxide scale that minimizes further
environmental attack during high-temperature exposure.
19–21
Since alumina (Al
2
O
3
)
and silica (SiO
2
) are electrically insulating,
21,22
alloys that form a semiconductive
chromia scale (with a conductivity of ~1.0 × 10
–2
S-cm
–1
at 800°C in air
21,23–25
) are
the preferred candidates. (However, if an insulating scale can be excluded from the
electrical current path, alumina or silica formers, which usually demonstrate higher
oxidation resistance than chromia-forming alloys, can be considered for intercon
-
nect applications.
16
) Since thermal expansion matching is important, alloys such
as Fe-Cr-base ferritic stainless steels that have a coefcient of thermal expansion
(CTE) similar to that of the ceramic cells are usually selected instead of other
groups of alloys, including Ni(-Fe)-Cr base austenitic compositions.
Different groups of alloys that have been considered potential candidates are sche
-
matically represented in gure 11.2, and their suitability is summarized in table 11.1.
It should be noted that traditional chromia-forming oxidation-resistant alloys were
designed with an emphasis on surface and structural stability, but not the scale elec
-
trical conductivity, which is equally important for SOFC interconnect applications.
Thus, alloying practices used in the past to enhance surface and structural stability
may not be compatible with the desired high scale electrical conductivity. For exam
-
ple, Si, often a residual element in alloy substrates, may help improve alloy oxidation
resistance through formation of a silica subscale along the metal–scale interface.
(Silica is immiscible with chromia.) However, that subscale is electrically insulating
Ni
BCC
+
FC
C
BC
C
Cr
Fe
FS
S
AS
S
FC
C
F
eB
SA
Ni
BS
A
Cr
B
A
BCC
+
FC
C
BC
C
FS
S
AS
S
FC
C
Fe
BS
A
Ni
BS
A
Cr
B
A
CrBA: Cr-
base alloys
FSS: Ferritic
ASS: Austenitic
stainless steels
stainless steels
FeBSA: Fe-Ni
base superalloys
NiBSA: Ni-Fe
base superalloy
s
BCC
+
FC
C
BC
C
FS
S
AS
S
FC
C
F
eB
SA
Ni
BS
A
Cr
B
A
BCC
+
FC
C
BC
C
FS
S
AS
S
FC
C
Fe
BS
A
Ni
BS
A
Cr
B
A
FIGURE 11.2 Schematic of alloy options for SOFC applications.
5024.indb 231 11/18/07 5:54:00 PM
232 Materials for the Hydrogen Economy
and therefore increases electrical resistance, especially if the subscale is continuous.
Several new alloys such as Crofer 22 APU
26–37
and ZMG232
38,39
have been recently
developed specically for SOFC interconnect applications, with an improved scale
electrical conductivity. One remaining issue, however, is the long-term surface sta
-
bility that obviously needs further improvement. This is often accomplished by
application of protective layers or coatings on metallic interconnects.
This chapter will provide an overview of oxidation and corrosion behavior of can
-
didate oxidation-resistant alloys under SOFC operating conditions and discuss surface
modications for improved stability and performance of metallic interconnects.
11.2 CORROSION OF OXIDATION-RESISTANT ALLOYS
UNDER SOFC INTERCONNECT EXPOSURE CONDITIONS
During SOFC operation, interconnects interact with surrounding gaseous environ-
ments on both the cathode and anode side, as well as with adjacent components
such as sealing materials, electrodes, and electrical contact layers inserted between
interconnects and electrodes. These interactions potentially cause corrosion of
metallic interconnects and affect their stability and performance.
11.2.1 OxidatiOn and COrrOSiOn at metal–GaS interFaCeS
The oxidation and corrosion behavior of oxidation-resistant alloys has been widely
investigated in a range of environments for myriad applications.
19,21,40–44
Recently,
oxidation-resistant alloys have been studied particularly for SOFC interconnect
applications.
These studies were often carried out using single atmosphere exposure
conditions, either air (or moist air) representing the cathode-side environment
45–50
or
a reducing atmosphere simulating the anode-side environment.
29,32,38,48,54–72
Lately,
TABLE 11.1
Comparison of Key Properties of Different Alloy Groups for SOFC Applications
Alloys
Matrix
Structure
TEC
(10–6·K–1
Oxidation
Resistance
Mechanical
Strengths Manufacturability Cost
CrBA BCC 11.0–
12.5(RT
800°C)
Good High Difcult Very
expensive
FSS BCC 11.5–
14.0(RT
800°C)
Good Low Fairly easy Cheap
ASS FCC 18.0–
20.0(RT
800°C)
Good Fairly high Easy Cheap
FeBSA FCC 15.0–
20.0(RT
800°C)
Good High Easy Fairly
expensive
NiBSA FCC 14.0–
19.0(RT
800°C)
Good High Easy Expensive
5024.indb 232 11/18/07 5:54:01 PM
Corrosion and Protection of Metallic Interconnects 233
studies have also been performed to determine the oxidation/corrosion behavior
of metal and alloys under dual-atmosphere exposure conditions that closely simu
-
late the actual interconnect exposure conditions during SOFC operation.
31,64–69
The
alloys studied include both Fe-Cr-base ferritic stainless steels
29,32,38,52,53,56,59–62
and Ni
or Ni-Cr-base heat-resistant alloys,
46,47,49,50,54,59–61
as well as Cr or Cr base alloys.
71,72
11.2.1.1 Oxidation in Air, Cathode-Side Environment
During high-temperature exposure in air, active elements, e.g., Cr, in alloy substrates
are preferentially oxidized, forming an oxide scale on the alloy surface. The scale
growth is often modeled with a parabolic relationship with time t:
40
( ) .∆w k t
p
2
=
(11.1)
where ∆w is the weight gain and k
p
is the parabolic rate constant.
However, due to the complexity of the scale growth, which involves factors such as
scale vaporization and grain boundary diffusion, deviation from the parabolic law
is often observed.
15,73,74
Nevertheless, oxidation behavior can frequently be approxi-
mated by the parabolic relationship, and the parabolic growth rate is thus often used
to report oxidation resistance of different alloys. In general, alloys with higher Cr%
possess higher oxidation resistance, and therefore exhibit a lower scale growth rate.
To remain capable of self-healing and prevent breakaway oxidation, alloy substrates
must maintain a Cr reservoir with Cr% above a critical value that marks the transition
from external to internal oxidation. For example, Fe-Cr-base alloys require a critical
Cr% of 17 to 20%, depending on temperature, minor alloy additions, impurities (S,
P, C), etc.
15,21
A recent study also examined the effect of thickness on the stability
of Fe-Cr substrates, indicating potential occurrence of breakaway oxidation when
the Fe-Cr substrate becomes too thin.
75–77
Also, it has been established that reactive
elements such as rare earth metals in a trace amount (a few hundredths or tenths of
a percent) can signicantly increase alloy oxidation resistance by improving scale
adherence and suppressing scale growth by Cr outward diffusion.
15,78–81
Most (if not
all) newly developed alloys for the interconnect application contain reactive element
additions, e.g., La in Crofer 22 APU.
15
11.2.1.2 Oxidation and Corrosion in Fuel, Anode-Side Environment
In comparison to the oxidizing, cathode-side environment, the reducing, anode-side
environment is more complex, particularly when a hydrocarbon fuel is used. The pres
-
ence of high water vapor partial pressure, carbon activity, and residual components
such as sulfur makes metallic interconnects susceptible to varied forms of corrosion.
Though the oxygen partial pressure (10
–18
~ 10
–12
bar) at the anode side is much lower
than that at the cathode side, formation of oxides such as chromia and (Mn,Cr)
3
O
4
is
nevertheless still thermodynamically favored. In moist hydrogen, Fe-Cr-base stain
-
less steels exhibit a scale growth rate that is comparable to that in air.
32,38,57,61,62
The
scale grown in the hydrogen fuel is usually comprised of the same major phases as
5024.indb 233 11/18/07 5:54:02 PM
234 Materials for the Hydrogen Economy
found in air, although their morphology and minor components can be different.
X-ray diffraction analysis on scales grown on Crofer 22 APU in either moist hydro
-
gen or moist air indicated that both scales were comprised of Cr
2
O
3
and (Mn,Cr)
3
O
4
phases.
31,32,65
Additionally, amorphous phases such as silica and MnO that could not
be detected by x-ray diffraction formed in the fuel environment, as revealed by trans
-
mission electron microscopy analyses.
31
The spinel phase tended to grow with a large
aspect ratio in moist hydrogen, in comparison to well-dened, equiaxed crystallites
in air. For Ni-Cr-base alloys, NiO formation is suppressed in the scales since oxida
-
tion of nickel is thermodynamically unfavorable in low oxygen partial pressure fuels.
Overall, it appears Ni-Cr base alloys exhibit higher oxidation resistance in moist
hydrogen than in air, and even those with a relatively low Cr% appear to be promis
-
ing for interconnect applications in terms of oxidation resistance.
48,58
Further differences in oxidation resistance between Fe-Cr base and Ni(-Fe)-Cr-
base alloys are also observed in high water vapor environments. For Fe-Cr-base
alloys, exposure to high water vapor environments potentially leads to breakaway
oxidation through formation of Fe or Fe-rich oxides.
82–85
For example, Shen et al.
85
reported that during oxidation in an oxygen stream containing 2 to 10% H
2
O at
900 to 1,000°C, Fe-Cr alloys (with 15 and 20% Cr) exhibited an initial protective
behavior due to formation of a Cr-rich scale, which was followed by nonprotective
breakaway oxidation due to the formation of a scale containing Fe
2
O
3
and (Fe,Cr)
3
O
4
phases. The breakaway oxidation was sensitive to the water vapor content in the
atmosphere and %Cr in the Fe-Cr alloys: the higher the water vapor content or the
lower the Cr%, the earlier the breakaway oxidation took place. In contrast, Ni(-Fe)-
Cr-base alloys exhibited enhanced scale adherence and suppressed formation of NiO
in the scale after exposure to high vapor environments.
86,87
Similarly, Cr or Cr base
alloys exhibited enhanced chromia scale adherence to the metal or alloy substrate
in Ar/H
2
O/H
2
.
71,72
When a hydrocarbon fuel is fed, either directly or after reformation, into the
anode chamber, metallic interconnects are exposed to an environment with a carbon
activity, and therefore potentially could suffer carbon-induced corrosion. It has been
found that in carbon-bearing gas environments, alloys, including Fe(-Ni)-Cr- and
Ni-Fe-Cr-base alloys, are susceptible to metal dusting at temperatures in the 400
~850°C range, which leads to alloy degradation by disintegration of the metal matrix
into tiny particles.
88–90
For Fe base alloys, the proposed mechanism involves satura-
tion of the alloy substrate with carbon and the subsequent formation of Fe
3
C that
decomposes into metal particles and carbon when the carbon activity approaches
unity.
91,92
A different mechanism was proposed for Ni-base alloys that also starts
with carbon saturation, but in which the saturated substrate directly decomposes into
metal particles and graphite when the internal carbon activity approaches unity.
93,94
Recently, several publications reported and discussed the danger of encountering
carbon-induced corrosion for oxidation-resistant alloys under SOFC interconnect
exposure conditions at the anode side.
59,60
Overall, it appears that metal dusting
is likely to occur in a hydrocarbon fuel with a carbon activity of ≥1. Toh et al.
60
reported metal dusting of some selected oxidation-resistant alloys tested in CO–26%
H
2
–6% H
2
O (vol%), corresponding to a carbon activity of 2.9, at 650°C under ther-
mal cycling. The resistance to metal dusting depended on alloy composition. For
5024.indb 234 11/18/07 5:54:03 PM
Corrosion and Protection of Metallic Interconnects 235
example, with electro-polished surfaces, chromia-forming austenitic alloys, includ-
ing Alloy 800, Inconel 601, 690, and 693, and Alloy 602CA, suffered a rapid metal
dusting, which did not occur until after about 50 one-hour cycles for the ferritic steel
Fe–27 Cr–0.0001 Y. The alloy with the best performance was Inconel 625, which
was still protected by its Cr
2
O
3
scale after 500 cycles. Zeng and Natesan
59
evaluated
a number of high-temperature oxidation-resistant alloys at 593°C in carbonaceous
gases of high carbon activity (>7.0) and found pit formation and metal dusting in
tested alloys. In comparison, Ni-base alloys, which developed scales with less spinel
content, performed better than the Fe-base alloys, which formed scales with more
spinel content. When exposed to a carbonaceous environment with a carbon activity
less than unity, oxidation-resistant alloys are much less likely to suffer metal dusting
or carbon-induced corrosion. Horita et al.
61
examined both Fe-Cr- and Ni-Cr-base
alloys at 800°C in a CH
4
-H
2
O atmosphere with an equilibrium carbon activity of 0.8
and found no carbide formation after nearly 300 h.
In addition to bulk alloys, Jian et al.
63
investigated a clad structure that had Ni lay-
ers at both sides of a ferritic stainless steel substrate. After testing at 750°C for 1,000
h in 53.1% N
2
–25.2% H
2
–18.3% CO–3.3% CO
2
–0.17% CH
4
, the clad structure exhib-
ited severe structural degradation due to carbon penetration through the Ni layers and
formation of carbides in the ferritic stainless steel substrate along grain boundaries.
11.2.1.3 Oxidation/Corrosion under Air–Fuel Dual-Exposure Conditions
During SOFC operation, interconnects are simultaneously exposed to air at the cath
-
ode side and fuel at the anode side, and therefore experience a hydrogen partial
pressure gradient from the fuel side to the air side. Previous investigations of Fe-Cr-
base stainless steels, Ni-Cr-base alloys, and elemental metals, under hydrogen–air
dual-exposure conditions found that the oxidation/corrosion behavior of the metals
or alloys under the dual exposures can be very different from that under single-
exposure conditions.
31,48,55,64–68,70,95
In particular, the composition and microstructure
of the scale grown on the air side differed signicantly from the behavior when
exposed to air on both sides, while the oxidation/corrosion behavior at the hydrogen
fuel side was comparable to that when exposed to the hydrogen fuel at both sides.
Fe-Cr-base ferritic stainless steels, in particular those with a relatively low Cr%,
were reported to be susceptible to hematite (Fe
2
O
3
) phase nodular growth in the scale
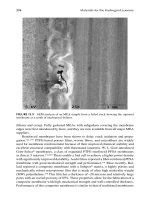
grown on the air side of the air–hydrogen sample. For example, Yang et al.
64
found
that AISI 430, with 17% Cr, formed hematite nodules (see gure 11.3a and b) on the
air side of the air–hydrogen sample during isothermal heating at 800°C after 300 h,
potentially resulting in localized attack. In comparison, there was no hematite phase
formation on the air–air sample, on the hydrogen side of the air–hydrogen sample,
or on the hydrogen–hydrogen sample. The oxidation behavior on the hydrogen side
of the air–hydrogen sample was similar to that on the hydrogen–hydrogen sample.
The potential detrimental effects of the dual exposures appeared to be dependent on
the alloy composition, in particular Cr% in the Fe-Cr substrate. For Crofer 22 APU,
with 22 ~ 23% Cr, no hematite phase formation or nodule growth was observed
under the same test conditions as for AISI 430. Instead, it was found that the spinel
top layer of the scale on the air side of the hydrogen–air sample was enriched in
5024.indb 235 11/18/07 5:54:04 PM
236 Materials for the Hydrogen Economy
iron and grew into a different morphology from that on the air–air sample under
the same conditions.
31,65
However, when ambient air (~1% H
2
O) was replaced by
moist air (3% H
2
O), the hematite phase was observed in the scale on the air side
of the air–hydrogen sample.
67
This anomalous oxidation thus appears to be a result
of combined effects from both the hydrogen ux from the fuel side to the air side
FIGURE 11.3 SEM cross-sections of AISI 430 coupons after 300 h of oxidation at 800°C
in air under different exposure conditions: (a) both sides exposed to air and (b) on the air side
of the air–(H
2
+ 3% H
2
O) exposure.
64
5024.indb 236 11/18/07 5:54:06 PM
Corrosion and Protection of Metallic Interconnects 237
and increased water vapor partial pressure on the air side. E-brite, with 27% Cr,
appeared to be more resistant to formation of hematite nodules at 800ºC in the scale
grown on the air side of the air–hydrogen sample, though the surface microstruc
-
ture of the scale was different from the air-only sample. At higher temperatures
(900°C), Meier et al.
96
observed iron oxide formation in the scale grown on the air
side of E-brite during air–hydrogen dual exposures. Similar anomalous oxidation
behavior was also observed by Ziomek-Moroz et al.
68
and Holcomb et al.
69
not only
on ferritic stainless steels, but also austenitic stainless steels as reported earlier by
Singh et al.
97
In addition to the hydrogen–air dual exposures, an early publication
by Nakagawa et al.
95,98
examined the oxidation behavior of ferritic stainless steels in
(argon + hydrogen)–air dual environments as well as a steam–air dual environment
that simulated the boiler tube exposure conditions in steam turbines. Anomalous
oxidation was found on the air side of the dual-exposure sample, which exhibited a
signicantly increased oxidation rate on the air side due to formation of the hematite
phase, which was attributed to hydrogen permeation from the (argon + hydrogen)
side or the steam side to the air side of the stainless steels. The anomalous oxidation/
corrosion behavior of oxidation-resistant alloys observed under the dual-exposure
conditions appears to be similar to that found in a high partial pressure water vapor
single environment.
40,67,82–85,87,99
In addition to the Fe-Cr-base stainless steels, dual-exposure effects were also
reported on Ni-Cr-base alloys.
48,100
For Ni-Cr-base alloys, the dual exposures also
resulted in different oxidation/corrosion behavior from that in a single-atmosphere
exposure. But unlike the ferritic chromia-forming alloys, nickel and Ni-Cr-base
alloys formed a uniform, well-adherent scale on the air side of the air–hydrogen
sample that was free from any nodule growth. Also, the dual exposures tended to
eliminate the porosity that was often observed along the scale–metal interface in a
single-air exposure, likely resulting in an improved scale adherence. The absence
of detrimental effects of the air–hydrogen dual exposures on the scale stability on
the Ni-Cr-base alloys in comparison with the Fe-Cr-base alloys is consistent with
reported results in water vapor by Pint.
86
In an effort to gain mechanistic understanding, elemental metals were also stud-
ied. Singh et al.
66
reported the destructive effects of air–hydrogen dual exposures
on silver at elevated temperatures, as shown in gure 11.4. As found in this study,
simultaneous exposures to fuel and oxidant environments lead to extensive porosity
development in bulk silver at elevated temperatures. The porosity formation takes
place predominantly along the grain boundary. The formation of the water vapor
phase is attributed to the nucleation and growth of high-pressure steam bubbles that
connect to form the porosity and ssures in the solid silver. The water phase that
evolves into a high-pressure steam is related to higher solubility and fast diffusivity
of H and O in the bulk metal. Thermodynamic modeling indicates that the reaction
2
2
[ ] [ ] ( )H O H O g
Ag Ag
+ =
is highly favorable. In contrast, Yang et al.
31
found mini-
mal effects of air–hydrogen dual exposures on the scale growth on Ni metal. Similar
observations were also reported by Meier.
96
The anomalous oxidation behavior of the
metals or alloys on the air side of the air–hydrogen samples is currently attributed
to the transport of hydrogen through the metal substrate from the fuel side to the air
side, and its subsequent presence at the oxide scale–metal interface and in the scale.
5024.indb 237 11/18/07 5:54:07 PM
238 Materials for the Hydrogen Economy
Hydrogen permeation tests on ferritic stainless steels indicated that hydrogen can
diffuse through the alloys, though the permeation was drastically decreased by for-
mation of chromia scale on the alloys.
95,101
The mechanisms by which the presence
of hydrogen or protons at the air side affects the oxide scale structure and growth
are not clearly understood at this time. Several mechanisms have been proposed to
tentatively explain the observed anomalous oxidation behavior.
65,69
FIGURE 11.4 Microstructures of cross-sections of silver tube walls after testing at 700°C
for 100 h: (a) with ow of (H
2
+ 3% H
2
O) and (b) with ow of air.
66
5024.indb 238 11/18/07 5:54:09 PM
Corrosion and Protection of Metallic Interconnects 239
The anomalous oxidation/corrosion on the air side of the air–fuel sample appears
to be sensitive to surrounding environments, alloy composition, preexisting condi
-
tions, and other factors. Kurokawa et al.
101
tested AISI 430 by owing 80% Ar–20%
H
2
through a water saturator at room temperature on one side and air on the other,
and observed minimal effect of the hydrogen potential gradient on the stainless steel
oxidation behavior after up to 300 h at 800ºC. It should be noted that the hydrogen
gradient was lower and the sample was thicker (2.0 mm) than those in the afore
-
mentioned studies that found anomalous oxidation. Preoxidation in air to form a
scale on ferritic stainless steel was found to mitigate or prevent the hematite phase
growth in the additional scale grown on Crofer 22 APU during air–hydrogen dual
exposures. Overall, it appears that further systematic work is required to gain clearer
insight into the oxidation/corrosion behavior in the dual environment and its effects
on metallic interconnect long-term stability.
11.2.2 COrrOSiOn at interFaCeS with adjaCent COmpOnentS
A typical example of interactions between metallic interconnects and adjacent com-
ponents involves rigid glass–ceramic seals, including those made from barium–cal
-
cium–aluminosilicate (BCAS) base glasses.
102–106
Previous work
107–109
found that
ferritic stainless steel interconnect candidates reacted extensively with the BCAS
sealing glass–ceramic, resulting in an interface that was more prone to defects. For
traditional chromia-forming stainless steels, the extent and nature of their interac
-
tions with the glass–ceramic depends on the exposure conditions and proximity of
the interface of the sealing glass and ferritic stainless steel to the ambient air. At or
near the edges, where oxygen from the air is accessible, the chromia scale grown on
the steel and Cr-containing vapor species reacted with BaO in the glass–ceramic,
forming BaCrO
4
, presumably via the following reactions:
2 Cr
2
O
3
(s) + 4 BaO(s) + 3 O
2
(g) = 4 BaCrO
4
(s) (11.2)
CrO
2
(OH)
2
(g) + BaO(s) = BaCrO
4
(s) + H
2
O(g) (11.3)
Due to the large thermal expansion mismatch between barium chromate and the
sealing glass or ferritic stainless steel (e.g., AISI 446),
110
the extensive formation of
barium chromate resulted in crack initiation and growth between the sealing glass
and alloy coupons, as shown in gure 11.5.
In the interior seal regions, where access of oxygen from the air was blocked,
chromium or chromia dissolved into the BCAS sealing glass to form chromium-rich
solid solutions. The stainless steel also reacted with residual species in the sealing
glass–ceramic to generate porosity in the glass–ceramic along the interface in the
interior regions. Recently Haanappel et al.
111,112
further investigated the compatibility
of ferritic stainless steels and sealing glasses under air–hydrogen dual exposures. It
was found that the corrosion at the interface of the sealing glass and the chromia-
forming steel was substantially different from that when exposed to hydrogen or air
only. At the air side, iron oxide nodules formed on the ferritic stainless steel near
or at the triple-phase boundary of air–glass–metal, causing short-circuiting of the
glass–ceramic seals. In contrast, no iron oxide formation was found at the interface
5024.indb 239 11/18/07 5:54:10 PM
240 Materials for the Hydrogen Economy
between the glass–ceramics and the ferritic steel on the hydrogen side. However, it is
not clear how the dual exposures led to the iron oxide formation and the subsequent
seal degradation. Besides the BCAS sealing glass, Haanapel et al.
113
and Batfalsky
et al.
114
also investigated compatibility of PbO-containing glass–ceramics and fer-
ritic stainless steels, observing extensive internal and external oxidation of ferritic
stainless steels.
Besides the glass seal interfaces, interactions were also reported at the
interfaces of the metallic interconnect with electrical contact layers, which are
inserted between the cathode and the interconnect to minimize interfacial elec
-
trical resistance and facilitate stack assembly.
115
For example, perovskites that
are typically used for cathodes and considered potential contact materials have
been reported to react with interconnect alloys. Reaction between manganites
and chromia-forming alloys led to formation of a manganese-containing spi
-
nel interlayer that appeared to help minimize the contact ASR.
115–117
Sr in the
perovskite conductive oxides can react with the chromia scale on alloys to form
SrCrO
4
.
115,118
Alternatively, Tietz et al.
119,120
examined chemical compatibility of
(a) (b)
I
I
YSZ
G18
446
A
B
I
I
I
I
YSZ
G18
446
A
B
G-18
446
446
G-18
446
A-A
C
G-18
446
446
G-18
446
A-A
C
446
446
G-18
B-B
446
446
G-18
B-B
446
Glass
ceramics
BaCrO
4
C-C
446
Glass
ceramics
BaCrO
4
C-C
FIGURE 11.5 Interfacial reactions between G18 sealing glass and 446 stainless steel. (a) A
schematic of the joined couple (446/G18/446) and SEM images of the interfacial cross-section
(b) at the edge area A, (c) at the interior region, and (d) from the region marked C in (b). The
446 coupons (12.7 × 12.7 × 0.5 mm) were joined to the G18 through heat treatment at 850°C
for 1 h, followed by 750°C for 4 h in air.
107
5024.indb 240 11/18/07 5:54:14 PM