Handbook of Production Management Methods Episode 9 potx
Bạn đang xem bản rút gọn của tài liệu. Xem và tải ngay bản đầy đủ của tài liệu tại đây (1.55 MB, 30 trang )
230 Handbook of Production Management Methods
with the integration of several separate information technology systems to
form an operational system in as short a time as possible.
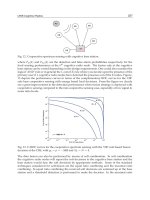
The ability to effectively manage, manipulate, distribute and access an
enterprise’s information is key to competitiveness within the global market-
place. Developments in information technology (IT) have provided database
systems that help support this need. However, companies in the very rapidly
changing sectors of the market are demanding increased levels of flexibility.
Mobile agent is described as a computational environment in which running
programs are able to transport themselves from host to host over a computer
network. By their nature, mobile agents are inherently distributed. As such,
they must be executable across a variety of platforms and operating systems to
achieve their full potential. In a small, private network there may only be one
configuration upon which they must work, but their true advantage comes
from being able to migrate to different systems and continue functioning. This
need has influenced the way in which mobile agent systems are created, these
systems must be written in some type of script or byte code that can be inter-
preted. Interpretation removes the need to recompile the agent on arrival at a
new host, and places the load on ensuring that the host is capable of uniformly
executing the agent on arrival.
Mobile agent technology provides a useful software paradigm that enables
information technology system designers to model and implement their sys-
tems as more natural reflections of the real world they simulate and support.
A direct relationship is established between the mobile elements of a distrib-
uted information system and the agent-based architecture of the information
technology system to evolve in line with the real world they represent. In
addition mobile agent technology can help in the rapid formation of these
information systems, which can be vital when supporting the creation of vir-
tual enterprises.
Bibliography
1. Anonymous, 1995:
BPCS Client/Server Distributed Object Computing Architec-
ture
. System software Association Inc. White paper.
2. Camarinha-Matos, L.M, Afsarmanesh, and Marik, V., 1998:
Intelligent Systems for
Manufacturing, Multi-agent Systems and Virtual Organizations
, Kluwer Academic
Publishers, Dordrecht.
3. Chess, D., Harrison, C. and Kershenbaum, A., 1997: Mobile agents: are they a good
idea? In J. Vitek and C. Tschudin (eds),
Mobile Object Systems, Toward one
Programmable Internet
. Springer Lecture Notes in Computer Science, Vol. 1222.
Springer, Berlin.
4. Gray, R., 1997: Agent Tel: A Flexible and Secure Mobile Agent System. Ph.D.
Thesis, Department of Computer Science, Dartmouth College, UK, June.
5. Hofmann, M.O., McGovern, A. and Whitebread, K.R., 1998: Mobile agent on
digital battlefield. In
Proceedings of the Second International Conference on Auto-
nomous Agents
. ACM, New York, pp. 219–225.
0750650885-ch005.fm Page 230 Friday, September 7, 2001 5:00 PM
110 manufacturing methods 231
6. Papaioannon, T. and Edwards, J., 1998: Mobile agent technology in support of sales
order processing in the virtual enterprise. In L.M. Camarinha-Matos
et al
. (eds),
Intelligent Systems for Manufacturing
. Kluwer Academic Publishers, Dordrecht,
pp. 23–32.
7. Papaioannon, T. and Edwards, J., 1999: Using mobile agents to improve the align-
ment between manufacturing and its IT support systems,
Robotics and Autonomous
Systems
,
27
(1–2), 45–57.
8. Rus, D., Gray, R. and Kotz, D., 1997: Transportable information agent,
Journal of
Intelligent Information Systems
,
9
, 215–238.
Multi-agent manufacturing system
P – 1c; 2d; 4c; 6d; 8c; 12b; 13c; 14c; * 1.3c; 1.4b; 2.3d; 2.4b; 3.6c; 4.2c;
4.5b
Multi-agent manufacturing systems are designed to solve shop floor control
problems. The increased demand for flexibility has led to new manufacturing
control paradigms based on the concept of self-organization and on the notion
of agents.
Today, computers are used to support various human work activities. They
provide the human with powerful tools to perform individual tasks, but
usually, teamworking of humans and computers is required. Although team-
work is most popular in human societies, the multi-agent manufacturing
system expands the meaning of teamwork to groups of humans and comput-
ers collaborating in order to solve a common problem. Human–computer
cooperation is used to solve shop floor control problems in manufacturing
systems.
The first manufacturing control architectures were usually centralized or
hierarchical. The poor performance of these structures in very dynamic envi-
ronments and their difficulties with unforeseen disruptions and modifications
led to new control architectures, based on self-organized systems that change
their internal organization on their own account. A multi-agent manufacturing
system is composed of self-organizing agents that may be completely
informational or represent subsystems of the physical world.
At workshop level, the heterogeneity of the system led to agent identifi-
cation problems. This system heterogeneity makes agent identification rather
unclear, and one agent identification method proposition to overcome this is
based on the idea that an agent should be autonomous intelligent. Thus agent
basic capabilities should be:
1. To transform its environment in at least one of the dimensions shape, space
and time.
2. To verify the search results before presenting them.
3. To roam the network and seek information autonomously.
0750650885-ch005.fm Page 231 Friday, September 7, 2001 5:00 PM
232 Handbook of Production Management Methods
The control behaviour of each agent is briefly outlined below.
The part agent and the resource agent negotiate with each other to manage
the operation of part entities and the functioning of the resources. The intelli-
gence agent provides different bidding algorithms and strategies; the monitor
agent is used to supplement system status. The database agent and manage-
ment agents manipulate inter-agent information. The communication agents
carry out all communication between entities.
A multi-agent system can be viewed as a sphere of commitment, which
encapsulates the promises and obligations the agents may have towards each
other. Spheres of commitment generalize the traditional ideas of information
management so as to overcome their historical weaknesses. The multi-agent
scenario-based method is composed of three phases: analysis, design, and
implementation.
Analysis
: representation of the problem domain. The analysis phase is composed
of four modelling activities:
1. Scenario modelling: identification of important notions supporting the
scenario; human/artificial agents, role of the agents, objects, interaction
among agents, object changes, etc.
2. Agent modelling: role description; local data modelling; detailed behaviour
description; validation of agent interaction with the scenario.
3. Object modelling: object structure specification, object life-cycle, object beha-
viour; validation of object/agent interaction in relation to the scenario.
4. Conversation modelling: user/agent interaction; validation of conversation in
relation to scenario. The purpose is to verify the search request and results by
communication between the user and the agent.
Design
: transformation of the agent’s transition diagrams and data conceptual
structure into specifications.
Implementation
: transformation of design into system programs.
For an automated system, implementation is straightforward, however, if there
are human operators working at cell level, there is a distinction between work-
shop levels and cell level. To integrate the operator into the automated system,
one solution consists in interfacing an agent with the operator. The artificial
agents then take charge of inter-agent organization and the human being is
simply considered as a resource. The operators could participate in self-organizing
processes at the same level as the artificial agents. This could be realized with
reactive agents, which have simple behaviour based on their perceptions.
Although individually very simple, a reactive multi-agent system may exhibit
very complex group behaviour. Consider, for example, part transport based on
use of both human and auto-guided vehicle control using a simple system of
0750650885-ch005.fm Page 232 Friday, September 7, 2001 5:00 PM
110 manufacturing methods 233
sensors. When a workstation needs a transport agent it sends a red light signal.
Artificial agents controlling the auto-guided vehicle detect the signal, and if
they have no other task to perform, they automatically approach the source. The
human transport operator can also see the red light, and may participate in the
transport process or not, depending on his/her judgement of the situation.
In the case of a flexible manufacturing system (FMS) there is no basic
difference to agent identification in the workshop. There are only two types of
agent: the workstation and the transfer system. Parts and storage area are not
considered as agents because they have no resources enabling them to be auto-
nomous. Scheduling in FMS is divided into two separate problems.
1. Internal workstation problems: the workstations have several parts to process
and must find an optimum schedule.
2. The problem of the allocation of parts to the FMS system. The arrival of a part
at the FMS is transmitted to the transfer agent that must find a workstation for
it. An offer is broadcast to the workstations with the message ‘location’ which
activates their algorithm. The workstation then sends a message to the transfer
agent ‘accept part’, which contains a proposal for acceptance at a specific
date. The transfer agent chooses the workstation and transports the part with
minimum processing date.
The multi-agent manufacturing system is one of several methods based on a
self-organization concept. Others are agent-based manufacturing, agent-driven
manufacturing, holonic, bionic, genetic, fractal, random, matrix scheduling,
and virtual manufacturing systems.
Bibliography
1. Agent Builder Environment.
2. Davies, C.T., 1978: Data processing spheres of control,
IBM Systems Journal
,
17
(2), 179–198.
3. Elmagarmid, A.K. (ed.), 1992:
Database Transaction Models for Advanced Appli-
cations
. Morgan Kaufmann, San Mateo,
4. Finin, T., Fritzson, R., McKay, D. and McEntire, R., 1994: Using KQML as an
agent communication language. In
Proceedings of the Third International Confer-
ence on Information and Knowledge Management (CIKM’94)
. ACM Press.
5. Georgakopoulos, D., Hornick, M. and Sheth, A., 1995: An overview of workflow
management: From process modeling to workflow automation infrastructure,
Dis-
tributed and Parallel Databases
,
3
(2), 119–152.
6. Gilman, C.R., Aparicio, M., Barry, J., Durniak, T., Lam, H. and Ramnath, R., 1997:
Integration of design and manufacturing in a virtual enterprise using enterprise
rules, intelligent agents, STEP, and work flow. In
SPIE Proceedings on Architec-
tures, Networks, and Intelligent Systems for Manufacturing Integration
, pp. 160–171.
7. Gray, J. and Reuter, A., 1993:
Transaction Processing: Concepts and Techniques
.
Morgan Kaufmann, San Mateo,
0750650885-ch005.fm Page 233 Friday, September 7, 2001 5:00 PM
234 Handbook of Production Management Methods
8. Huhns, M.N. and Singh, M.P. (eds), 1998:
Readings in Agents
. Morgan Kaufmann,
San Francisco.
9. Labrou, Y. and Finin, T., Semantics and conversations for an agent communication
language. In M.N. Huhns and M.P. Singh (eds),
Readings in Agents
. Morgan
Kaufmann, San Francisco, pp. 235–242.
10. Lefranqois, P., Cloutier, L. and Montreuil, B., 1996: An agent-driven approach to
design factory information systems,
Computers in Industry
,
32
, 197–217.
11. Nakamura, J., Takahara, T. and Kamigaki, 1995: Human-computer cooperative
work in multi-agent manufacturing system. In E.M. Dar-el (ed.),
Proceedings
of the 13th International Conference on Production Research
, Jerusalem, August
6–10, pp. 370–372.
12. Rabelo, R.J. and Spinosa, L.M., 1997: Mobile-agent-based supervision in supply-
chain management in the food industry. In
Proceedings of Workshop on Supply-
Chain Management in Agribusiness
, Vitoria (ES) Brazil, pp. 451–460.
13. Rabelo, R.J. and Camarinha-Matos, L.M., 1994: Negotiation in multi-agent based
dynamic scheduling,
Journal on Robotics and Computer Integrated Manufactur-
ing
,
11
(4), 303–310.
14. Sethi, A.K. and Sethi, S.P., 1990: Flexibility in manufacturing: a survey,
The Inter-
national Journal of Flexible Manufacturing Systems
,
2
, pp. 289–328.
15. Singh, M.P., 1998: Agent communication languages: rethinking the principles,
IEEE Computer
,
31
(12), 40–47.
16. SMART. http:l/smart.npo.org/
One-of-a-kind manufacturing (OKM)
M – 2c; 3b; 4c; 7c; 14d; * 1.1d; 1.2d; 1.3b; 2.3b; 2.4b; 2.5c; 3.1c; 3.2b;
4.1b; 4.2b
The market of consumer goods shows an increase in variety and a decrease in
product life-cycle. This means that producers of these goods are moving more
and more towards one-of-a-kind production. In addition, tailoring the product
to customer needs is increasingly important in quality improvement. Ultimately,
this leads to one-of-a-kind manufacturing (OKM) production.
The theory of production management covers many different issues, including
logistics control, quality control, human resources, design, process innovation,
etc. These issues are usually treated as if production were a repeat activity,
yielding anonymous products. The theory of production management is largely
a theory for producing anonymous products. The information systems assume
that perfect information is a prerequisite. However, in OKM the situation is
often the opposite. Perfect information is only available after the project is fin-
ished, and management means motivation of professionals to act as a team.
OKM is usually process oriented, where a considerable investment is made
in the development of a production process independent of customer orders.
A production process consists of all manufacturing steps required to produce
a particular family of products. OKM may be resource oriented – make to order,
0750650885-ch005.fm Page 234 Friday, September 7, 2001 5:00 PM
110 manufacturing methods 235
or product oriented – a defined product with options to suit specific customer
needs.
In OKM top management focuses on capacity and capability: capacity cre-
ation, capability improvement, capacity maintenance, and selling capacity and
capability. There is a strong need for a simple, rough capacity planning and
monitoring system. Sophisticated planning and scheduling tools are seldom a
success, because there are many uncertainties. Shop floor personnel lack reli-
able engineering data about the operation of new orders. Therefore, informa-
tion systems that support manufacturing engineering are most useful. Such
systems are completely different from material-oriented information systems.
In a one-of-a-kind business the purpose of an information system is not
automatic generation of planned work orders, but rather, user-friendly support
of engineering professionals. The traditional distinction between an informa-
tion system and a logistics system disappears to some extent.
In general practice, most customers use a fuzzy due date rather than exact
date when operating their one-of-a-kind product (OKP) manufacturing systems.
In order to clearly describe the practical problems, two kinds of model with
different types of fuzzy due dates for OKP manufacturing systems are built to
control production using the just-in-time (JIT) philosophy. Automated control
systems often face a complex problem in situations where the number of
resources and tasks to be controlled by the system rises. This complexity gives
a reason to subdivide the control system into smaller and thus simpler systems.
However, in order to maintain flexibility of the overall system, interoperabil-
ity of the subdivided systems must exist.
Production planning in the OKM environment is still under research.
Bibliography
1. Fong, S.W., 1998: Value engineering in Hong Kong – a powerful tool for a changing
society,
Computers & Industrial Engineering
,
35
(3–4), 627–630.
2. Hameri, A.P., Nihtila, J. and Rehn, J., 1999: Document viewpoint on one-of-
a-kind delivery process,
International Journal of Production Research
,
37
(6),
1319–1336.
3. Hameri, A.P. and Nihtila, J., 1998: Product data management – exploratory study on
state-of-the-art in one-of-a-kind industry,
Computers in Industry
,
35
(3), 195–206.
4. Horvath, L., Machado, J.A.T., Rudas, I.J. and Hancke, G.P., 1999: Application of
part manufacturing process model in virtual manufacturing. In
ISIE ’99. Proceed-
ings of the IEEE International Symposium on Industrial Electronics
(Cat. No.
99TH8465). IEEE, Piscataway, NJ, pp. 1367–1372.
5. Jones, C., Medlen, N., Merlo, C., Robertson, M. and Shepherdson, J., 1999: The
lean enterprise,
BT Technology Journal
,
17
(4), 15–22.
6. King, A.M. and Sivaloganathan, S., 1998: Development of a methodology for using
function analysis in flexible design strategies. In
Proceedings of the Institution of
Mechanical Engineers, Part B (Journal of Engineering Manufacture)
,
212
(B3),
pp. 215–230.
0750650885-ch005.fm Page 235 Friday, September 7, 2001 5:00 PM
236 Handbook of Production Management Methods
7. Laursen, R.P., Orum, Hansen, C. and Trostmann, E., 1998: The concept of state
within one-of-a-kind real-time production control systems,
Production Planning
and Control
,
9
(6), 542–552.
8. Langeland, B., Holm, H. and Schroder, J., 1999: Subdivision of an automated con-
trol system in one-of-a-kind production. In
Proceedings of the Eighteenth IASTED
International Conference Modelling, Identification and Control
. ACTA Press,
Anaheim, CA, pp. 425–427.
9. Marples, A., 1999: Recycling value from electrical and electronic waste. In
Recyc-
ling Electrical and Electrical Equipment. Conference Proceedings
. ERA Techno-
logy Ltd, Leatherhead, UK, February, pp. 4/1–4/7.
10. Orum, H.C., Laursen, R.P. and Trostmann, E., 1998: Real-time control systems
for one-of-a-kind production based on state modelling,
Production Planning and
Control
,
9
(5), 435–447.
11. Schierholt, K., 1998: Knowledge systematization for operations planning. In
Proceedings Artificial Intelligence and Manufacturing Workshop. State of the Art
and State of the Practice
. AAAI Press, Menlo Park, CA, pp. 140–146.
12. Schneider, J.G., Boyan, J.A. and Moore, A.W., 1998: Value function based pro-
duction scheduling. In
Machine Learning. Proceedings of the Fifteenth Interna-
tional Conference (ICML ’98)
. Morgan Kaufmann Publishers, San Francisco, CA,
pp. 522–530.
13. Wei, Wang and Dingwei Wang, 1999: JIT production planning approach with
fuzzy due date for OKP manufacturing systems,
International Journal of Produc-
tion Economics
,
58
(2), 209–215.
14. Yiliu, Tu, Xulin, Chu and Wenyu Yang, 2000: Computer-aided process planning
in virtual one-of-a-kind production,
Computers in Industry
,
41
(1), 99–110.
Optimized production technology – OPT
S – 1c; 4c; 6c; * 1.3c; 2.4b; 3.5c
(See also Theory of constraints (TOC).)
Optimized production technology (OPT) was developed as a scheduling
system to govern product flow in a production plant. The rules of OPT are
derived for capacity constraints and especially bottlenecks. Both capacity and
market constraints should be handled by the logistical system. The nine rules
of OPT are:
1. Do not balance capacity. The major objective is flow.
2. The level of utilization of a non-bottleneck is not determined by its own poten-
tial but by other constraints within the system.
3. Activation and utilization are not synonymous.
4. An hour lost on bottleneck is an hour lost on the system.
5. An hour gained on a non-bottleneck is a mirage.
6. Bottlenecks govern both inventory and throughput.
7. The transfer batch may not be equal to the process batch.
0750650885-ch005.fm Page 236 Friday, September 7, 2001 5:00 PM
110 manufacturing methods 237
8. The process batch should be variable, not fixed.
9. Schedules should be estimated by looking at all the constraints. Lead times are
the results of a schedule and cannot be predetermined.
Unfortunately, OPT does not reveal the theory underlying the software, so that
firms that implemented OPT were forced to follow schedules generated by a
‘black box’. Supervisors found the schedules counter-intuitive and were
reluctant to follow them.
Bibliography
1. Fogarty, D., Blackstone, J. and Hoffmann, T., 1991:
Production and Inventory
Management
, 2nd edn. South-Western, Cincinnati, OH.
2. Fox, R.E., 1982: MRP, Kanaban, or OPT,
Inventory and Production
,
July/August
.
3. Fox, R.E., 1983: OPT – an answer for America – Part IV,
Inventory and Produc-
tion
,
March/ April
.
4. Fox, R.E., 1983: OPT vs. MRP – thoughtware vs. software,
Inventory and Produc-
tion
,
November/December
.
5. Fuchsberg, G., 1992: Quality programs show shoddy results,
Wall Street Journal
,
May 14, B1, B7.
6. Goldratt, E., 1991: Late-night discussions: VI,
Industry Week
, December 2, 51, 52.
7. Goldratt, E., 1989:
The Goal
, 2nd revised edn. North River Press, Croton-on-
Hudson, NY.
8. Goldratt, E., 1990:
The Haystack Syndrome
. North River Press, Croton-on-
Hudson, NY.
9. Goldratt, E., 1988: The fundamental measurements,
The Theory of Constraints
Journal
,
1
(3).
10. Goldratt, E. and Fox, R.E., 19xx:
The Race
. North River Press, Croton-on-Hudson,
NY.
11. Goldratt, E., 1988: Computerized shop floor scheduling,
International Journal of
Production Research
,
26
(3), pp. 443–455.
12. Lambrecht, M. and Segaert, A., 1990: Buffer stock allocation in serial and assem-
bly type of production lines,
International Journal of Operations and Production
Management
,
10
(2), pp. 47–61.
13. Mathews, J. and Katel, P., 1992: The cost of quality,
Newsweek
, September 7,
p. 48.
Outsourcing
M – 2c; 3c; 4b; 6c; 9d; 10b; 14c; * 1.1d; 1.2c; 1.3d; 1.6b; 2.4c; 3.2c; 3.3b;
4.1b; 4.2c; 4.5d
Outsourcing is defined as the conscious business decision to move internal
work to external suppliers.
0750650885-ch005.fm Page 237 Friday, September 7, 2001 5:00 PM
238 Handbook of Production Management Methods
Manufacturers purchase subassemblies rather than piece parts. Outsourcing has
become prominent in activities ranging from logistics to administrative services,
and suppliers are increasingly involved in defining the technical and commercial
aspects of the goods and services companies provide. These trends, in effect, have
raised the amount a business spends externally. Most importantly, the complexity
of purchasing has increased dramatically in terms of the nature of what is pur-
chased, the breadth of categories considered within the realm of procurement, and
the expanding geographic scope of supplier options to consider and manage.
What companies buy has changed significantly. This has implications for
how companies buy, and translates into highly leverage-able opportunities for
significant cost reduction and profit enhancement. Procurement is quickly
becoming recognized as a priority function that offers high-impact opportun-
ities for improving the bottom line.
There are several definitions of the term outsourcing, such as:
1. To subcontract any job that is not in the main line of business of the company.
2. Create a long-term strategic partnership with outsiders, which becomes an
extension of the company.
3. Purchase products and components, that previously were made in the company.
Outsourcing is management policies that come to establish the following:
1. Align outsourcing with business plans
2. Ensure consistent handling across all business units
3. Identification and definition of core competencies
4. Identification of outsourcing opportunities
5. Consistent procedures and guidelines for evaluation and implementation
of outsourcing opportunities
6. Ensure competitive bidding
7. Consistent handling of personnel issues
8. Sales and retention assets
9. Enable technology refresh
10. Consistent contract structure, terms and conditions.
Outsourcing may be done in three ways:
1. Subcontract job to suppliers
2. Employ temporary workers
3. Employ consultants.
The advantages of outsourcing are:
1. Allows the company to concentrate on the main business – what it can do best
2. Using experts in each field, employing advanced technology
0750650885-ch005.fm Page 238 Friday, September 7, 2001 5:00 PM
110 manufacturing methods 239
3. Reduction of personnel problems
4. Increases production flexibility, because there are many suppliers
5. Seasonal work force flexibility
6. Transfer quality responsibility to the supplier
7. Objective ideas from an external source
8. Reduction in logistic and operation expenses.
The outsourcing policy of what to outsource should include:
1. Anything that is not a core competence is an outsourcing candidate
2. Process of functions where organization adds value
3. Expertise knowledge that enables organizations to maintain competitive
advantage.
Outsourcing critical success factors are:
1. Ensuring a clear understanding of objectives
2. Identifying activities suitable for outsourcing
3. Commitment and trust between vendor and company
4. Identifying decision team and allow adequate time
5. Communications
6. Specifying adequate contact terms
7. Seamless transition
8. Establishing the framework and staff to manage the relationship
9. Continuity of executive support.
The disadvantages of implementing outsourcing are:
1. Exposure of company trade secrets to external sources
2. Maintaining industry and company-specific expertise
3. Suppliers do not have the loyalty to the company
4. Suppliers do not care about internal affairs of the company
5. Suppliers are not familiar with the company’s labour problems
6. Suppliers are not familiar with company standards and operations procedures
7. Suppliers cannot be regarded as strategic partners and do not share in profits.
Trouble spots in outsourcing:
1. Poor customer management
2. Difficulty in hiring/retaining staff
3. Rapid technology and business changes
4. Unrealized value added
5. Fear of potential change of control
6. Greater customer sophistication
0750650885-ch005.fm Page 239 Friday, September 7, 2001 5:00 PM
240 Handbook of Production Management Methods
7. Expectations are not realistically set in the beginning
8. Poor contracts.
An outsourcing decision must be based on:
•
Identification of needs
: A need to achieve more effective information sys-
tems delivery at an affordable cost.
•
Establishing unique objectives
: An understanding that each business has
different requirements and different goals.
•
Gaining consensus
: The degree of support by all functions within the busi-
ness.
•
Modelling the relationship
: A complete understanding of structure, benefits,
and pitfalls.
To identify the needs, the business case should balance both the cost of the
outsourcing arrangements – setup fees and ongoing fees – and their internal
structure, such as the cost of technology, the cost of recruiting and training
people, the cost of space.
Is one strategy more expensive than the other? Whether or not outsourcing
makes financial sense depends on a number of differing factors. For example,
are there opportunities to create efficiencies through the use of technology?
Will moving from a decentralized to a centralized outsourcing approach free
up significant internal resources?
It is important to state your objectives up-front. What exactly are you trying
to accomplish? As you look at what’s important, start collecting data –
whether it’s performance data or external benchmarking. Many companies
conduct an activity-based costing analysis – an analysis that looks at how
people are spending their time. Also, you need to capture labour costs, and
costs for technology, recruiting, turnover and training. This information can
be derived from financial reports.
Bibliography
1. Childe, S.J., 1998: Extended enterprise – a concept of co-operation,
Production
Planning and Control
,
9
(4), 320–327.
2. Conn, D., 1999: To outsource or not to outsource?
Medical Device and Diagnostic
Industry
,
20
(1), 76, 78, 80.
3. Gregory, A., 1998: Outsourcing – weighing it up,
Manufacturing Computer Solu-
tions
,
4
(3), 39, 41–42.
4. Hare, D., 1999: Succeeding with ERP,
Manufacturing Engineer
,
78
(2), 65–67.
5. Hull, B., Patell, S. and Williams, S., 1999: Taming the supply chain,
Manufacturing
Engineer
,
78
(2), 71–72.
6. Jahnukainen, J. and Lahti, M., 1996: Efficient purchasing in make-to-order supply
chains,
International Journal of Production Economics
,
59
(1), 103–111.
0750650885-ch005.fm Page 240 Friday, September 7, 2001 5:00 PM
110 manufacturing methods 241
7. Jones, R. and Kruse, G., 1999: Making a meal of ERP,
Manufacturing Engineer
,
78
(2), 61–64.
8. Lacity, M. and Hirschheim, R., 1993:
Information Systems Outsourcing
, Wiley.
9. Lehtinen, U., 1997: Subcontractors in a partnership environment: a study on
changing manufacturing strategy,
International Journal of Production Economics
,
60
, 165–170.
10. Mainwaring, J., 1999: Outsourcing – the way forward!
Manufacturing Computer
Solutions
,
5
(3), 44–46.
11. Ng, J.K.C., Ip, W.H. and Lee, T.C., 1998: Development of an enterprise resources
planning system using a hierarchical design pyramid,
Journal of Intelligent Manu-
facturing
,
9
(5), 385–399.
12. Opperthauser, D., 1998: Outsourcing moves to the plant,
Industrial Computing
,
17
(10), 43–45.
13. Padillo, J.M. and Diaby, M., 1999: Multiple-criteria decision methodology for the
make-or-buy problem,
International Journal of Production Research
,
37
(14),
3203–3229.
14. Peterson, Y.S., 1998: Outsourcing: opportunity or burden?
Quality Progress
,
31
(6), 63–64.
15. Rothstein, A.J., 1998: Outsourcing: an accelerating global trend in engineering,
EMJ Engineering Management Journal
,
10
(1), 7–14.
Partnerships
P – 3d; 4d; 5c; 6c; 9b; 10b; 11c; * 1.1c; 1.2c; 1.6b; 3.2c; 3.5c
Partnership manufacturing is a business culture that promotes open communica-
tion and mutual benefits in a supportive environment built on trust. Partnering
relationships stimulate continuous quality improvement and a reduction in the
total cost of ownership.
Partnering is usually referred to as a shift from traditional open market
bargaining to cooperative buyer and seller relationships. The shift is often
referred to in articles and conversation, but is difficult to isolate. It refers to at
least five areas.
1. Moving from numerous suppliers for a goods or services to a few or one.
2. Changing the buyer and seller relationship from a credible threat to a credible
commitment.
3. Altering conflict management procedures from unyielding negotiations to
managing trade-offs.
4. Increasing information exchange from as little as possible to as much as
possible.
5. Viewing the marketplace jointly rather than separately.
Depending on the source, partnering is as old as commerce itself, or as new as the
new management principles. The explanation for the new interest in partnering
0750650885-ch005.fm Page 241 Friday, September 7, 2001 5:00 PM
242 Handbook of Production Management Methods
is that global competition has spawned the quality movement, which has
brought into focus the total-cost-of-ownership. No longer are purchasers of
goods and services based solely on price, but on a sophisticated basis that
considers all factors such as original cost of equipment, spare parts, service,
maintenance, support, throughput, taxes and duties, monetary exchange con-
siderations, up-time available, and cycle time. Total-cost-of-ownership has
elevated the purchasing function to a strategic role in many organizations.
The change in nature of purchasing quality can be appreciated by the follow-
ing comparisons:
Partnering promotes two levels of partnering: basic and expanded. Basic part-
nering requires the following between customer and supplier:
1. mutual respect
2. honesty
3. trust
4. open and frequent communication
5. understanding each other’s needs.
In addition to these requirements, expanded partnering requires:
1. long-term commitment
2. recognition of continuing improvement – objective and factual
3. passion to help each other succeed
4. high priority on relationship
5. shared risk and opportunity
6. shared strategic/technologies road map
7. sharing advanced technology requirements
Old approach New approach
Purchasing is a tactical issue Purchasing is a strategic issue
Deliver can be at any time Delivery is just-in-time
Quality is conformance to specification Quality is broadly defined, mainly in
terms of the customer
Quality is satisfying customer
requirements
Quality is anticipating and exceeding
customer expectations
Price is a major factor in buy decision Quality is equal to price in buy
decision
Front-end price is important Life-cycle costs are critical
Purchasing is cost area Purchasing is a profit/loss area
Buyer or agent purchases products Team purchases products
Defects are accepted Zero defects are expected
Multiple suppliers provide products Preferably single supplier-partner
provides products
0750650885-ch005.fm Page 242 Friday, September 7, 2001 5:00 PM
110 manufacturing methods 243
8. sharing expectations of the future
9. ensuring financial benefit to both parties
10. mutual task forces and cross-organizational teams.
Selecting and assessing the best partners is critical for successful partnership,
and the actual assessment process provides significant benefits as well. The pro-
cess of selecting partners can be programmatic, that is, guidelines, procedures,
hierarchy, strategic plans, and technical requirements can govern it. One method
is to attempt to do basic partnering with everyone, and then expand to higher
levels of partnering with a long-term and strategic supplier. Winning awards as a
world class supplier might make a company eligible for expanded partnering,
bringing with it executive-level investment and sponsorship, as well as increased
communication through scheduled operational and strategic meetings.
It should be obvious that a quality relationship is critical for a successful
partnership. Relationships occur between people, not companies. When part-
nering practitioners speak of the resource investment required for partnering,
they speak of the time and personnel costs of relationship building and main-
tenance within and across companies.
Partnership activity tends to be initiated by the customer and flow from the
customer to the supplier.
Bibliography
1. Axelrod, R., 1984:
The Evolution of Cooperation
. Harper Collins, New York.
2. Fisher, R. and Ury, W., 1991:
Getting to Yes: Negotiating Agreement Without Giv-
ing In
. Houghton Miffin, Boston.
3. Hutchins, G., 1992: Partnering: A path to total quality in purchasing,
National
Productivity Review
,
Spring
, 215.
4. Lambert, D.M., Emmelhainz, M.A. and Gardner, J.T., 1996: Developing and imple-
menting supply chain partnerships,
The International Journal of Logistics Manage-
ment
,
7
(2), 1–17.
5. Landeros, R. and Monczka, R.M., 1989: Cooperative buyer/seller relationships and
firm’s competitive posture,
Journal of Purchasing and Material Management
, Fall.
6.
Partnering for Total Quality: A Partnering Guidebook
, vol. 4, 1990. SEMATECH,
pp. 9–18.
Performance measurement system
M – 7a; 8b; 9c; 11b; 13b; * 1.3b; 3.3b; 4.1a; 4.3a; 4.4b
Performance measurement is a management tool used to indicate the efficiency
of the organization, and how to improve it. In WEB e-business, performance
refers to the response time of the system.
Performance measurement compares intentions and planning to the actual
performance. The actual performance data is obtained by data collection. If
0750650885-ch005.fm Page 243 Friday, September 7, 2001 5:00 PM
244 Handbook of Production Management Methods
done properly it reflects the real status of business performance. The planning
or target settings are usually accepted without question.
Target setting, in many cases, does not reflect the actual potential of the
business and therefore the performance measurement does not highlight the
real problems in the organization. For example: Suppose a company finds it
difficulty to compete in the market as their processing costs are relatively high
compared to those of the competitors. This does not mean that their process
engineers are not capable ones. It might mean that competitors’ processing
resources are more suited to producing the required product mix. This is man-
agements’ responsibility, as they made the wrong decisions concerning resources
and planning.
Another example: The performance measurement indicates that delivery
dates are not met. This is a fact. But why? What are the conclusions to be drawn
from this information? In many cases the production system has performed
efficiently, but management (marketing or sales) are to blame as they have
promised an unrealistic delivery date.
Thus performance measurement results give an overall efficiency value for
a specific enterprise, but do not allow management to point to specific sources
of low overall efficiency.
Performance management systems propose individual measurements for
each discipline that may affect the level of performance, such as:
1. management performance level
2. sales performance level
3. marketing performance level
4. production planning performance level
5. shop-floor performance level
6. engineering design performance level.
In addition performance management systems make an additional measurement,
called ‘predicted performance measurement’ which may be used to pinpoint
the source of low efficiency and also to compare the efficiency of a specific
enterprise to other enterprises.
E-business has intensified the need for better ways to manage system per-
formance. The reality that response times of eight seconds or better are critical
to ensure a customer does not go to a competitor’s site, is putting real pressure
on IT organizations to offer optimal performance.
The problem is that most of them continue to struggle with performance
management as e-business gains momentum and customers grow more demand-
ing. This is especially problematical given the lack of complete performance
management systems available: there are only ‘point solutions’ available today.
While there are innovative products that attack a particular facet of per-
formance management, customers have been left with the chore of trying to
integrate a set of disparate elements into something much more useful to them.
0750650885-ch005.fm Page 244 Friday, September 7, 2001 5:00 PM
110 manufacturing methods 245
Performance management should be a systematic process, with integrated
tools to be used as needed. More attention has been focused on real-time per-
formance management products that adjust traffic flows in real time, based
upon service level management policies. These products use sophisticated
technology to balance loads on servers and networks, redirect new connec-
tions to lightly loaded sites, cache information locally for faster access and
shape traffic. A performance management system that integrates both real-
time and long-term aspects would offer substantial customer value. Real-time
information is critical for tuning and optimizing all performance management
elements. Data integration is essential; administrators cannot move files
between tools.
Bibliography
1. Bititci, U.S., Carrie, A.S. and McDevitt, L.G., 1997: Integrated performance meas-
urement systems: a development guide,
International Journal of Operations Man-
agement
,
17
(6), 522–535.
2. Bititci, U.S., Carrie, A.S. and Turner, T.J., 1998: diagnosing the Integrity of your
performance measurement system,
Control Institute of Operations Management
,
24
(3), 9–13.
3. Camp, R., 1989:
Benchmarking: The Search for Industry Best .
ASQC Quality
Press.
4. Crawford, J., 1994: TPC Auditing: how to do it better, Quarterly Report, 9–11.
5. Daneva, M., 1995: Software benchmarking design and use. In J. Brown (ed.),
Reengineering the Enterprise
. Chapman & Hall, London.
6. Davenport, T.H., 1993:
Process Innovation
. Harvard Business School Press,
Boston.
7. Gomolski, B., 2000: Top 10 recommendations on building scalable, high-
performance Web sites,
InfoWorld
,
23
(3), 70.
8. Halevi, G., 1980:
The Role of Computers in Manufacturing Process
. John-Wiley &
Sons.
9. Hammer, M. and Champy, J., 1993:
Re-engineering the Corporation: A Manifesto
for Business Revolution
. Nicholas Brealey, London.
10. Hana, V., Burns, N.D. and Backhouse, C.J., 1996: How we are measured is how
we behave.
Proceedings of 2nd
International Conference on Managing Integrated
Manufacturing (MIM ’96)
, Leicester University 26–28 June, pp. 303–308.
11. Chesbrough, H.W. and Teece, D.J., 1996: Making companies efficient,
The
Economist
, December.
12. Covey, S., 1990:
Habits of Highly Effective People
. Simon & Schuster, New York.
General references.
13. Kueng, P. and Krahn, A.J.W., 1999: Building a process performance measurement
system: some early experiences,
Journal of Scientific and Industrial Research
,
58
, March–April, 145–159.
14. McCarthy, J., 2000: Performance evaluations,
Journal of Property Management
,
65
(5), 22–25.
15. McConnell, J., 2000: Better monitoring tools good for e-biz,
Internetweek
,
807
, 35.
0750650885-ch005.fm Page 245 Friday, September 7, 2001 5:00 PM
246 Handbook of Production Management Methods
16. Mettins, K., Kempf, S. and Siebert, G., 1995: How benchmarking supports
re-engineering. In J. Brown (ed.),
Reengineering the Enterprise
. Chapman & Hall.
17. Neely, A., Gregory, M. and Platts, K., 1995: Performance measurement system
design: a literature review and research agenda,
International Journal of Oper-
ations Management
,
15
(4).
18. Scheer, A W., 1992:
Architecture of Integrated Information Systems
. Springer-
Verlag, Berlin.
Product data management – PDM & PDMII
S – 2d; 3b; 4c; 6d; 7b; 8d; 14c; 15d; * 1.2c; 1.3d; 2.1c; 2.2b; 2.3c; 2.5c;
2.6c; 3.1d; 3.2c; 4.3c
Product data management (PDM) is a tool for collecting, storing, organiz-
ing, managing and making accessible product and process knowledge. It is a
set of software tools designed to control and electronically simulate a product
throughout its life-cycle.
PDM II is a new vision to achieve quality, time and cost benefits through
product development. PDMII integrates three distinct elements, virtual product
development management (VPDM), and traditional PDM and ERP systems.
VPDM provides product knowledge much earlier in the design cycle, when
the cost of change and design experimentation is minimal and enhances
innovation of the design.
PDM started as an intelligent file manager add-on for computer-aided
design and computer-aided manufacturing (CAD/CAM) systems. CAD systems
originally provided electronic drawings, but then evolved to creating designs
in 3D. Today, we can build a 3D virtual prototype and, with digital mockup,
interactively simulate product performance and check for system interference.
But the focus is still very much on creating part geometry. Even when assem-
bly modelling is done, there is very little to manage elements like versions and
configurations, maturity and affectivities, or the relationships and links to
other information that is being generated during the innovation phase of the
design process.
PDM began with manual control of paper, and has evolved to the control of
electronic files. PDM systems today provide secure locations for universally
accessing product designs. They provide structured workflow with which to
evolve a product design through its life-cycle, and share it with downstream
manufacturing and other legacy applications. PDM systems can interface with
CAD systems to control design files, but are too structured to function well in
a conceptual design environment.
Today, the focus is much more on information systems and bill-of-materials
applications. An enterprise PDM system is the main central repository for all
that there is to know about the product definition and all the many iterations of
that definition. PDM is growing increasingly sophisticated. Take product
0750650885-ch005.fm Page 246 Friday, September 7, 2001 5:00 PM
110 manufacturing methods 247
configuration, for example: if the PDM system knew the features and options
that a product could have, manufacturers could generate bills of material for
product instances that have not yet been created. There is an average of
15 documents per product – and only one of those documents is the product
drawing or model. The broad view of PDM now is that while geometry con-
tinues to be important, there are 14 other definitions that are important, too.
Such additional documents might include purchase orders, fabrication plans,
or, perhaps, safety analyses. Engineers design the product. Manufacturing
people fabricate it. Service people are out in the field performing maintenance
and repair. There are many people who need to tap into a repository of product
information above and beyond the engineer who created a geometrical repres-
entation of the part in a CAD file. So it’s all about leveraging information as
opposed to simply managing it.
PDM helps companies automate the arduous task of design reviews and
approvals, streamlining how companies take design concepts and translate them
into released products for manufacturing. The result is reduced time to market
and lower development costs. Innovation requires change. To facilitate innov-
ation, companies must re-examine the way in which they store and share
information, and the development processes that use this information.
Early in a product life-cycle, change is good, and, in fact, should be encour-
aged. The more iteration a product design can experience at this stage when
change is inexpensive, the higher quality we can obtain in our final product.
As costs are committed against a design, however, change becomes expensive
and is discouraged. PDM systems help control engineering changes at this
stage, and ensure enterprise acceptance of changes through structured work-
flow. PDM systems are excellent for managing enterprise information in this
portion of the product life-cycle, where information management requires
more structure.
Traditional PDM systems allow engineering data to be efficiently shared
with downstream systems for enterprise resources planning (ERP), manufac-
turing process planning, and product obsolescence planning. Also, changes to
finalized designs must be completed efficiently with the impact of the change
understood by all engineers who rely on the product design.
Modern companies use computers to store all types of information about the
products they build. Product data management (PDM) systems provide easy
availability of this information, control its access, and manage changes to it.
As humans, we have the unique ability to place the information that we obtain
from PDM systems within a context that is meaningful to us. Recent software
technologies such as CAD, PDM, and ERP have helped reduce development
time by automating portions of the development process. But despite their
benefits, they do not eliminate the interpretation required by various depart-
ments involved in a classical serial development process, nor do they encour-
age parallel development activities. To maximize compression of the product
development life-cycle, companies must not only represent product data in a
0750650885-ch005.fm Page 247 Friday, September 7, 2001 5:00 PM
248 Handbook of Production Management Methods
digital format; they must also ensure that multiple departments can easily and
unambiguously interpret the information and access that knowledge at any
point in the process.
With the extension of today’s enterprises into closely-knit supply chains, all
companies in the extended enterprise must effectively collaborate during the
entire product-creation process, including conceptual design. They must have
efficient access not only to product design data, but also to manufacturing
process definitions and other product information that changes as the product
design evolves. The vision integrates three distinct elements: virtual product
development management (VPDM), traditional PDM, and ERP systems and it
is called PDMII.
VPDM provides product knowledge much earlier in the design cycle, when
the cost of change and design experimentation is minimal. The overall goal of
PDMII is to introduce knowledge, intelligence and innovation at the design
stage. The addition of VPDM enables engineering activities to occur in paral-
lel, because it models dependencies among various engineering disciplines,
carefully tracking design changes. Their impact can be more easily explored
and understood. With VPDM, manufacturing engineers can begin planning
for production long before designs are released, and engineers can become
more efficient by finding required product data more quickly. VPDM also
uses advanced tools for digital mockup, behaviour simulation, and visual-
ization, allowing engineers to spot defects or manufacturing difficulties early.
By enabling collaboration in the conceptual design phase, VPDM allows ideas
to be shared with people within and outside the design community. VPDM
increases a company’s ability to innovate and increase revenue from new
products.
PDM II attributes, including those for concurrent engineering, can be
broken down into two major categories: those that foster an environment of
innovation and those that reduce costs and product life-cycles. Another rele-
vant element of PDM II is action flow, which captures actions that need to be
done, have been done, and what other parts are affected. Engineers can sub-
scribe to a portion of a design they’re working with, and then automatically be
notified when changes occur.
Bibliography
1. Choi, Y.K., 1995: The PDM system for CE implementation,
Computer World
,
December
, 162–167.
2. Choi, Y.K. and Huh, K.B., 1995:
Object-oriented Software Engineering.
Korea
Silicon.
3. CIMdata, 1994:
Product Data Management: A Technology Guide
.
4. HP, 1993:
Product Data Management: Understanding the Fundamental Tech-
nology and Business Concepts
, Hewlett-Packard Co.
5. Kempfer, L., 1998: Linking PDM to ERP,
Computer-Aided Engineering
,
17
(2),
58–64.
0750650885-ch005.fm Page 248 Friday, September 7, 2001 5:00 PM
110 manufacturing methods 249
6. Kim, K.S. and Kim, C.H., 1992: A modeling methodology for manufacturing
information system based on object-orientd approach.
Proceedings of the 1992
Conference KIIE
, pp. 192–201.
7. Kim, S.H. and Yoon, H.C., 1994: The development of drawing information man-
agement system for technical document management,
Interfaces: Industrial Engin-
eering
,
7
(3), 213–225.
8. Kim, W., 1990:
Introduction to Object-oriented Databases
. MIT Press.
9. Lee, C.H., 1996: A case study on the development of R&D integrated system using
CALS/PDM,
IE Magazine
,
B3
(1), 58–62.
10. McHenry, S., 1993: RDBMS vs. ODBMS for product information management
systems.
Proceedings of AUTOFACT ’93 Conference
28/13–30.
11. Taylor, D.A., 1991:
Object-oriented Technology: A Manager’s Guide
. Addison-
Wesley.
12. Yoo, S.B., Seo, H.Y. and Ko, K.W. 1995: Product data exchange in production
systems by using of STEP,
Interfaces: Industrial Engineering
,
8
(3), 75–95.
Product life-cycle management
M – 3c; 4c; 5d; 7b; 9b; 11d; 14c; 15c; 16c; * 1.1d; 1.2b; 1.5b; 2.2c; 2.6b;
3.1d; 3.4c; 4.6c
The objective of product life-cycle management is to reduce overhead and
operating expenses, to obtain valuable management information (including
causal data).
Product life-cycle management services can provide value information to
retailers, manufacturers and the consumer. Product life-cycle management
performs both direct logistics, and reverse logistics, simultaneously: direct
logistics is getting the product to the consumer, and reverse logistics is getting
the product back efficiently.
Product life-cycle management is the seamless integration of distribution
and reverse-logistics technologies and operations that provides retailers and
manufacturers with the means to capture data throughout the complete life-cycle
of a product, category or line of products.
Full product life-cycle management manages products as they progress
through the forward- and reverse-logistics pipelines. It enables a company to
manage and direct the disposition of its products in a manner that protects its
brand and maximizes its recovery. Retailers and manufacturers have identified
the need to track the capabilities of a product throughout the supply chain.
Supply chains are optimized, return rates are high and obsolescence rates
are short. These market realities and the shifts towards direct-to-consumer
marketing and retailing are the driving factors behind product life-cycle man-
agement services. Retailers and manufacturers are facing new challenges and
opportunities through nontraditional retailing. The immense availability of
products through the Internet and catalogues requires that retailers focus on
customer service.
0750650885-ch005.fm Page 249 Friday, September 7, 2001 5:00 PM
250 Handbook of Production Management Methods
Consumers can now view and purchase nearly any product with a point and
a click. This dictates that what will differentiate retailers and provide competi-
tive advantage is customer service and the efficiency of their logistics pipe-
line. Order fill times are constantly being reduced. Overnight delivery, once
viewed as nearly impossible, is now the norm. Same-day delivery is already
here and will surely grow in popularity. This only reinforces the need for an
efficient logistics process, which includes direct logistics, getting the product
there, and reverse logistics, getting the product back. These practices together
with simultaneously tracking sales demand, billings and credits, and through
technology will be a driving factor in determining which retailers and manu-
facturers develop customer share and market leadership.
Technology is clearly changing the way we shop and transact business.
Building the logistical infrastructure to protect today’s retailing market share
while capturing customer share in the direct-to-consumer market is the main
task.
Third-party expertise and technology can help bridge the gap between today’s
market-share and tomorrow’s customer-share requirements. Outsourcing both
direct and reverse logistics functions is a viable strategy in this time of chan-
ging technology and fundamental market shift.
A number of third parties have developed and are developing superior
technology and operating processes adding a dimension of flexibility and
responsiveness. The force of change demands dynamic solutions. Solutions
that will help manage a product from production to its resting place. Developing
a full product life-cycle strategy is a competitive necessity for today and
tomorrow. It enables a company to manage and direct the disposition of its
products in a manner that protects its brand and maximizes its recovery. Full
product life-cycle management is, in essence, cradle-to-grave management of
a product as it progresses through forward- and reverse-logistics pipelines.
Bibliography
1. Alting, L., 1995: Life cycle engineering & design,
Annals of CIRP
,
2
, 569.
2. Alting, L., 1998: Our Common Future, The Brundtland Report, © 1978 Oxford
University Press. Winter annual meeting, CIRP Life Cycle Group Meeting, 1998, v
47/2/98.
3. Curran, M.A., 1996:
Environmental Life-cycle Assessment
, McGraw Hill, New York.
4. Dreer, P. and Koonce, D.A., 1995: Development of an integrated information model
for computer integrated manufacturing,
Computers Industrial Engineering
,
29
(1–4),
pp. 109–112.
5. Koonce, D.A., Judd, R.P. and Parks, C.M., 1996: Manufacturing systems engineer-
ing and design: an intelligent multi-model, integration architecture,
Computer Inte-
grated Manufacturing
,
9
(6), pp. 443–453.
6.
Limits to Growth
, Club of Rome, © 1972, Universe Books, New York.
7. Mills, J.J., 1995: An integrated information infrastructure for agile manufacturing,
Manufacturing Science and Engineering, ASME MH
,
3
(2).
0750650885-ch005.fm Page 250 Friday, September 7, 2001 5:00 PM
110 manufacturing methods 251
8. Orfali, R., Harkey, D. and Edwards, J., 1996:
The Essential Client/Server Survival
Guide
. John Wiley & Sons.
9. Song, L. and Nagi, R., 1995: An integrated information framework for agile manu-
facturing.
5th Industrial Engineering Research Conference Proceedings
.
10. Van Beers, M., 1996: Life cycle analysis. TUDElft report, January.
Production information and control system – PICS
S – 1b; 2c; 4d; 6d; 7c; 10c; 13c; * 1.2c; 1.3b; 1.6c; 2.3b; 2.4b; 2.5d; 3.5b
Production information and control system (PICS) is a systematic method of
performing the technological disciplines of the enterprise, which consist of the
following stages:
•
Master production planning
•
Material requirement / Resource planning
•
Capacity planning
•
Shop floor control
•
Inventory management and control.
Master production planning transforms the manufacturing objectives of quant-
ity and delivery dates for the final product, which are assigned by marketing
or sales, into an engineering production plan. The decisions in this stage
depend either on the forecast or confirmed orders, and the optimization cri-
teria are meeting delivery dates, minimum level of work-in-process, and plant
load balance. These criteria are subject to the constraint of plant capacity and
to the constraints set by the routing stage.
The master production schedule is a long-range plan. Decisions concerning
lot size, make or buy, addition of resources, overtime work and shifts, and
confirm or change promised delivery dates are made until the objectives can
be met.
The purpose of material requirement planning (MRP – see separate item) is
to plan the manufacturing and purchasing activities necessary in order to meet
the targets set forth by the master production schedule. The number of produc-
tion batches, their quantity and delivery date are set for each part of the final
product.
The decisions at this stage are confined to the demands of the master pro-
duction schedule, and the optimization criteria are meeting due dates, min-
imum level of inventory and work-in-process, and department load balance.
The parameters are on-hand inventory, in-process orders and on-order quantities.
The capacity planning goal is to transform the manufacturing requirements,
as set forth in the MRP stage, into a detailed machine-loading plan for each
machine or group of machines in the plant. It is a scheduling and sequencing
task. The decisions at this stage are confined to the demands of the MRP
0750650885-ch005.fm Page 251 Friday, September 7, 2001 5:00 PM
252 Handbook of Production Management Methods
stage, and the optimization criteria are capacity balancing, meeting due dates,
minimum level of work-in-process and manufacturing lead time. The parame-
ters are plant available capacity, tooling, on-hand material and employees.
The shop floor is where the actual manufacturing takes place. In all previ-
ous stages, personnel dealt with documents, information, and paper. In this
stage workers deal with material and produce products. Shop floor control is
responsible for the quantity and quality of items produced and for keeping the
workers busy.
Inventory management and control is responsible for keeping track of the
quantity of material and number of items that should be and that are present in
inventory at any given moment; it also supplies data required by the other
stages of the manufacturing cycle and links manufacturing to costing, book-
keeping, and general management.
The PICS method requires data from a number of sources, including cus-
tomer orders, available inventory, status of purchasing orders, status of items
on shop floor, status of items produced by subcontractors, status of items in
quality assurance department. The data from all sources must be synchronized
to the instant that the PICS programs are updated. For example: because of
new jobs and shop floor interruptions, capacity planning must be updated at
short intervals. PICS can do this, however, feedback data must be introduced
into the system.
Bibliography
1. Baker, K.R., 1974:
Introduction to Sequencing and Scheduling
, John Wiley &
Sons, New-York.
2. Barash, M.M.
et al
., 1975: The optimal planning of computerized manufacturing
systems, NSG GRANT No. APR74 15256, Report No. 1, November 1975.
3. Berry, W.L., 1972: Priority scheduling and inventory control in job lot manufac-
turing system,
AIIE Transactions
,
4
(4), 267–276.
4. Buffa, E.S., 1966:
Models for Production and Operation Management
. John
Wiley & Sons.
5. Buffa, E.S., 1966:
Readings in Production and Operation Management
. John
Wiley & Sons.
6. Coffman, E.G., Bruno, J.L. and Graham, R.L.
et al
., 1976:
Computer and Job-shop
Scheduling Theory
. John Wiley & Sons, New York.
7. Hanna, W.L., 1985: Shop floor communication – MAP.
22nd Annual Meeting &
Technical Conference Proceedings AIM Tech
, May 1985, pp. 294–300.
8. Harding, J., Gentry, D. and Parker, J., 1969: Job shop scheduling against due dates,
Industrial Engineering
,
1
(6), 17–29.
9. Harrington, J., 1985: Why computer integrated manufacturing.
22nd Annual Meet-
ing & Technical Conference Proceedings AIM Tech
, May 1985, pp. 27–28.
10. Halevi, G., 1980:
The Role of Computers in Manufacturing Processes
. John
Wiley & Sons.
11. Halevi, G., 1992:
The Magic Matrix as a Smart Scheduler, Manufacturing in the
Era of Concurrent Engineering
. North-Holland IFIP.
0750650885-ch005.fm Page 252 Friday, September 7, 2001 5:00 PM
110 manufacturing methods 253
12. Hubner, H. and Paterson, I. (ed.), 1983:
Production Management Systems
. North-
Holland.
13. IBM
COPICS
Copyright 1972.
14. Rowe, A.G., 1958: Sequential decision rules in production scheduling. Ph.D.
dissertation, University of California, Los Angeles.
15. Wiendahl, H.P., 1995:
Load-oriented Manufacturing Control
, Springer-Verlag.
Quality function deployment – QFD
P – 3b; 5c; 8c; 9b; * 1.3c; 1.5d; 2.2b; 2.5d; 2.6c; 3.1b; 3.2d; 3.4c
Quality function deployment is a product development methodology, the
primary aim being to increasing customer focus throughout the product devel-
opment process. Thus quality function deployment is a market-driven design
and development methodology for products and services to meet or exceed a
customer’s needs and expectations.
Quality function deployment is a system designed to identify customer
needs and requirements and introduce them in product design. All company
disciplines are involved in a team effort to evaluate competitors’ capabilities.
Quality function deployment utilizes total quality management (TQM) princi-
ples to introduce a high quality product in a short development lead time.
The house of quality (HOQ) is the nerve centre and the engine that drives
the entire quality function deployment process. It is a kind of conceptual map
that provides the means for inter-functional planning and communication.
HOQ is a large matrix that contains seven different elements:
1.
Customer needs
. These are the voice of the customer.
2.
Product features
. Also called design requirements or engineering attributes.
3.
Importance to customer
. Indicates the importance of each attribute to the cus-
tomer.
4.
Planning matrix
. This portion of the HOQ contains a competitive analysis of
the company’s products against major competitors’ products for each cus-
tomer need.
5.
Relationship between customer needs and product features
. How much each
product feature affects each customer need.
6.
Feature-to-feature correlation
. The extent to which a change in one feature
will affect other features.
7.
Prioritized technical description targets
. A summation of the effects of all
prior variables on each product feature.
Using these seven elements, the HOQ becomes a repository of information
that can be used as a mechanism for applying common-sense engineering.
The benefit of this approach is a more structured and visible decision-
making process that spans a number of life-cycle activities. In this way quality
0750650885-ch005.fm Page 253 Friday, September 7, 2001 5:00 PM
254 Handbook of Production Management Methods
function deployment is often regarded as a facilitator of life-cycle engineering
techniques such as concurrent engineering. When successful, the benefits
obtained from quality function deployment practices have been reported as:
1. Increased level of team working including providing a communication
platform for concurrent engineering.
2. Reduced time to market.
3. Reduced amount of re-work.
4. Increased quality of the product.
However, these benefits – or reported successful adoption of quality function
deployment – are far from universal. Problems with quality function deploy-
ment have arisen due to the subjectivity of decisions that are required in the
process. This has been particularly evident at the first stage of the process
where it is necessary to translate subjective customer statements into objective
engineering measures.
Another problem is the scalability of the methodology; it is often impractical
to remain true to principles of methodology when developing anything but the
simplest of products.
Customer value deployment – CVD
This is a special blending of VE and QFD into one powerful development and
improvement tool.
Bibliography
1. Beskow, C., Johansson, J. and Norell, M., 1998: Implementation of QFD: identify-
ing success factors. In
IEMC ’98 Proceedings. International Conference on Engin-
eering and Technology Management. Pioneering New Technologies: Management
Issues and Challenges in the Third Millennium
(Cat. No.98CH36266). IEEE, New
York, NY, pp. 179–184.
2. Bossert, L.J., 1991:
Quality Function Deployment
, ASQC Quality Press, New York.
3. Chang, H.H., Jae, K.K., Sang, H.C. and Soung, H.K., 1998: Determination of
information system development priority using quality function development,
Computers & Industrial Engineering
,
35
(1–2), 241–244.
4. Chan, L.K., Kao, H.P., Ng, A. and Wu, M.L., 1999: Rating the importance of
customer needs in quality function deployment by fuzzy and entropy methods,
International Journal of Production Research
,
37
(11), 2499–2518.
5. Dube, L., Johnson, M.D. and Renaghan, L.M., 1999: Adapting the QFD approach
to extended service transactions,
Production and Operations Management
,
8
(3),
301–317.
6. Eyob, E., 1998: Quality function deployment in management information systems,
Journal of International Information Management
,
7
(2), 95–100.
0750650885-ch005.fm Page 254 Friday, September 7, 2001 5:00 PM