Flood forecasting and River modelling of the Mekong basin
Bạn đang xem bản rút gọn của tài liệu. Xem và tải ngay bản đầy đủ của tài liệu tại đây (1.06 MB, 52 trang )
/>Technical Session III (Contd.)
Flood forecasting and river modelling of the Mekong
Basin
Introduction
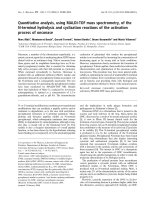
The Mekong is ranked among the largest rivers of the world. The river drains
an area of approximately 600 000 km
2
, covering parts of China, Myanmar,
Thailand, Laos, Cambodia and Viet Nam (Figure 1). At Kratie, close to the
upstream part of the Mekong Delta, the average annual discharge equals 437
billion m
3
/s, or an average discharge of around 14 000 m
3
/s. Downstream of
Kratie, the river enters the extremely flat and low lying Mekong Delta.
This paper addresses the topic of floods in this river and its tributaries. In the
Mekong, the ratio between 10% low flows and 10% high flood discharge is
approximately 50. Years with severe floods were 1961, 1966, 1971, 1978,
1984, 1991 and 1995. Despite the high discharges, it is not common for
Mekong River floods to cause casualties. The principal problem from floods is
damage to crops and infrastructure. In 1995, for example, severe floods
caused substantial damage in the Vientiane Plain of Laos. During that
monsoon, an area of approximately 40 000 ha was flooded resulting in a
damage estimated at US$21 million.
In view of the frequency of the floods, a good forecasting system is a necessity
to improve the preparedness of the population to floods and to support
evacuation plans. Since 1970 the Mekong Secretariat (now called the Mekong
River Commission Secretariat, or MRCS) has operated a flood forecasting
system for the Mekong River during the flood prone months from July to
October.
Over the past decades many dikes were built along the Mekong River, in
particular along the borders with Thailand. Secondary effects of these dikes
are the increase in downstream flood levels as a result of the reduction in flood
plain storage, the faster propagation of floods along the river and impeded
drainage of tributaries, causing local floods.
However, there are also other factors contributing to a reduction of flood
levels. In the Mekong Basin many reservoirs have been built or are under
construction, which store water from the rainy season for use during the dry
season, either for hydro-electric power production and/or for irrigation water
supply. Incidentally, such reservoirs may have a negative impact on flood
levels as a result of changing lag times between peaks or the delay in
conveyance of water from the watersheds.
Adri Verwey, River Modelling Specialist, WL/Delft Hydraulics, Netherlands
FIGURE 1
Basin of Lower Mekong River
effects of reservoirs and their operation on the Mekong River floods. Flood
forecasting models, in general, are of great help in improving the operation of
reservoirs and avoiding unnecessary spilling of water. Mathematical models
can also lead to an improved understanding of the flood phenomena and
provide insight into the causes of flooding. In this manner, more appropriate
measures can be taken to reduce flood damage.
As an example, one might look at a country like Bangladesh, where in 1986
UNDP and the World Bank supported the creation of the Surface Water
Simulation Modelling Centre (SWSMC). Currently this centre has a staff of 42
and is in charge of flood forecasting and flood control modelling for the
country. At SWSMC flood forecasts are produced at 32 stations spread over
the whole country. Many of the simulations made relate to the design of
controlled flooding systems.
The simulation models used and their supporting techniques have improved
substantially over the past years. One important factor to this is the increase in
computer speed and memory capacity. As a spin-off of this development, also
many new technologies have emerged, which open up many new possibilities
in flood modelling and in land and water development projects more in
general.
The MRCS flood forecasting centre
Flood forecasts at MRCS are prepared on weekdays during the months July to
October. Data are received from 22 rainfall stations and from 37 hydrologic
stations between 07.00 and 09.00 hours daily. Water level forecasts are
produced for the stations Chiang Saen, Luang Prabang, Chiang Khan,
Vientiane, Nong Khai, Nakhon Phanom, Thakhek, Savannakhet, Mukdahan,
Pakse and Kratie and are sent to the member countries by fax around midday.
In alert situations the forecasts are also produced during the weekends. An
example of the report is shown in Figure 2.
Data received are transmitted via Fixed Frequency Radio Transmission.
Apparently this system is quite frequently out of order at some stations.
However, within the Improvement of Hydro-Met Project, funded by the
Governments of Japan and Australia, the number of stations is being extended
and/or rehabilitated. The improved system will still be based upon radio
transmission of data.
Flood forecasting at MRCS is based upon a SSARR model calibrated in 1970.
It comprises the Mekong from Chiang Saen at Thailand's border with Myanmar
to Kratie in Cambodia. The model consists of eight principal reaches, each of
which has a number of watershed models attached to the nodes. Some of
these watershed models also have channel routing components. The
schematization is shown in Figure 3.
At MRCS the probable rain depths are estimated from information received
from the Thai Department of Meteorology. This information includes current
rainfall data at ground stations and their forecasts. These forecasts are also
based upon weather charts and ground radar imageries.
FIGURE 2
Example of flood forecast form
Mekong River Commission
Kasatsuk Bridge, Rama 1 Road, BangKok 10330, Thailand
Tel: (66-2) 225 0029 Fax: (66-2) 225 2796 E-mail:
To:
Cambodia (855-23) 42 26 201, Lao PDR (856-21) 21 7013, Thailand 398 9816
or 339 4010, and Viet Nam (844) 82 56929 National Mekong Committee.
Nongkhai (042) 42 0327, UBon (045) 31 1969 and Mukdahan (042) 61 1027
Hydrology Centres
From: Hydrology Unit, HRD and Environment Division, MRC Secretariat
Subject Flood Forecast in 1997
Date:
Tuesday, 05 August 1997 At Pakse, the water level is going down below the
flood stage.
ALERT:
At Kratie and Kompong Cham, the water levels keep a firm rising and are
approaching to the maximum levels of the last year (Kratie; 23.00m on Sep. 29.
Kompong Cham 16.11m on Sep. 29). We should be careful of the flood wave
observed on August 3–4 which is coming down to Kratie within a couple of
days, and the contribution from the Sekong, SeSan and Sre-Pok basin.
LOCATION
Distance
from the
Observd
Rainfall
Zero
Gauge
Flood
Stage
Observed
G.H.(m)
Forecast Gauge Height (m)
06
Aug
07
Aug
08
Aug
09
Aug
10
Aug
Chiang
Saen
2,363 0.6 357.310 11.50 5.88 5.89 5.78 5.66 5.55 5.64
Luang
Prabang
2,010 NR 267.195 18.00 11.68 11.64 11.58 11.45 11.32 11.38
Chiang
Khan
1,717 33.5 194.118 17.32 11.24 11.13 11.04 10.97 10.93 10.85
Vientiane 1,580 21.0 158.040 11.50 8.48 8.45 8.23 8.05 7.95 7.85
Nong Khai 1,550 22.2 153.648 12.20 9.29 9.34 9.12 8.94 8.85 8.74
Paksane 1,395 39.4 142.125 14.50 12.33
Nakhon
Phanom
1,217 0.8 132.680 12.60 11.00 10.88 10.77 10.60 10.36 10.12
Thakhek 1,216 2.4 129.629 13.50 12.40 12.28 12.17 12.00 11.76 11.52
Savannakhet 1,125 3.5 125.022 13.00 10.26 10.13 10.07 9.87 9.63 9.39
Mukdahan 1,128 0.5 124.219 12.50 11.34 11.21 11.15 10.95 10.71 10.47
Ubon NR 105.074 5.98
Khong
Chiam
910 0.2 89.030 14.27
Pakse 869 14.3 86.490 12.00 11.95 11.60 11.23 10.92 10.63 10.33
Strung
Treng
668 n/a 36.790 n/a
Kratie 545 NR -1.080 22.59
Kompong
Cham
410 NR -0.930 15.37
Phnom
Penh
(Bassac)
NR -1.020 10.50 9.29
P Penh Port
(Tonle Sap)
325 n/a 10.00 7.42
Phnom
Penh
(Mekong)
332 n/a -1.080 10.70 n/a
Tan Chau 220 n/a 0.000 4.20 n/a
Chau Doc 200 n/a 0.000 3.50 n/a
Charge: 2.1.13/93/JPN/Line 53 Drafted: Tien/Manoroth Concurred: Tanaka
Approved: Sok
The modellers who estimate rainfall data during the lead period of the forecast
also use 10-day forecasts based upon the Global Numerical Meteorological
Model for reference. Data of further refined models are available from the
Japan Meteorological Agency. Results of their Operational Numerical Weather
Prediction Models cover the Mekong Basin in more detail and forecasts are
made available through the internet in the form of bit maps. Expected daily
rain depths are shown in eight classes on a logarithmic scale.
Based upon experience, corrections for topographical deviations from the
forecasted rain depths are entered into the average catchment rain depths
provided to the SSARR model. As the rain infiltration processes were
calibrated on the basis of 6-hourly rain depths, the daily depths are distributed
over the day with assigned probabilistic weights of 0.2, 0.4, 0.3 and 0.1
respectively.
FIGURE 3
Schematization of the flood forecasting model
Each forecast is based upon computations started four days ahead of the
actual time of simulation. The simulation is initiated with measured discharges,
overwriting the computed ones. Soil moisture data are maintained, which
implies that the rainfall-runoff models are not being updated.
Operation of the models is still based upon the manual editing of data in ASCII
files. Data follow the old Fortran convention of formatted data input, which
requires very careful checking of the position of digits and causes an
unnecessary risk of mistakes. The models are still the same as those
calibrated in the seventies. However, corrections are made for systematic
errors in catchment runoffs as these have been determined during the years
over which the model has been in operation.
Model results are analysed carefully before issuing the forecasts. Computed
discharges are converted into water levels via the known stage-discharge
curves. Consistency is obtained with these data through the input of initial
discharges converted from water levels by means of the same rating curves.
Despite all these measures, the quality of the forecasts is not high. Although
the one-day forecasts appear to produce acceptable results, the five-day
forecasts at some stations give peak watér levels which are sometimes out by
a half to one metre.
The hydrodynamic model of the mekong
In 1988 Delft Hydraulics was commissioned to conduct a study titled “Scientific
and Technical Assistance for Hydro-Meteorlogy and Mathematical Modelling”
with the following objectives:
• optimization of the hydro-meteorological network of the Lower Mekong
Basin;
• implementation of a database management and data processing
system; and
• development of a Master Model of the Lower Mekong River for
simulation of flow and salinity intrusion.
The resulting Master Model is a 1-D mathematical flow model of the Mekong
River from Chiang Saen to the sea. The model was developed with the
objective of becoming a key instrument for planning, analysis and design in
the Mekong River Basin. In particular, it enables studies on the effects of
natural and man-made interference's in the river basin. The Master Model was
developed on the basis of Delft Hydraulic's WENDY package (further
developed since into the software package called SOBEK).
The Master Model consists of three parts:
• the River Model for flow simulation in the reach Chiang Saen to Pakse;
• the Delta Tidal Model for flow and salinity intrusion simulation in the
reach of the river from Phnom Penh to the sea; and
• the Delta Flood Model, covering the reach from Pakse to the sea.
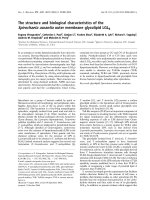
FIGURE 4
Verification of water levels simulated with WENDY at Mukdahan
Despite the shortcomings of the maps providing topographic data in the flood
plains, the models were caliberated satisfactorily. An example of the fit of
water levels for a flood wave passing at Mukdahan is shown in Figure 4. In
view of the fact that the calibration of this model focused on the fitting of
discharges, the differences between computed and measured water levels are
acceptable.
At the time of the model development, there were still some problems in
improving the quality of the hydrodynamic models. The developers of the
Mekong River Model conclude that an accurate model development is
hampered by:
• large changes in the discharge rating curves from year to year, leading
to considerable deviations of actual ratings from the average rating
curve applied to calibrate the model; and
• lack of data from tributaries, with only some 60 % of the catchment
area between the model limits gauged.
However, since these observations were made the scope for further
improvement of the models looks better. Since the calibration of the models,
more reliable data have become available. River cross-sections have been
monitored through a FINADA sponsored river survey project. The cross-
sections have been stored in a database and can be linked to the Mekong
Master Model. The availability of discharge data from tributaries has improved
since the start of the Hydro-Met Project. In addition, there is a considerable
scope for further improvement as a result of emerging technologies, as
discussed in the sequel.
Emerging technologies
Over various decades computer speed and storage capacities are increasing
by 50% yearly or a factor of more than 50 over each decade. This simply
means that what a computer does now in an hour, will be done in a minute ten
years from now. Over twenty years, or half the professional lifetime of an
engineer, the work done in one hour is reduced to one second only. There is
no indication that there will be a slow down of this trend. Computer storage
follows a similar trend. Whereas the PC had an internal memory of 640 Kb 10
years ago, it now has 32 Mb internal memory. This results in the development
of technologies, which were unheard of or just in experimental phase 10 years
ago.
DGPS technology
One of these areas of progress is the collection of topographic data. The
combination of satellite technology and fast computer processing speed has
opened up new possibilities for collecting flood plain levels on the basis of
differential GPS systems (DGPS). The combination of laser beam scanning
applied from a helicopter flying at approximately 100 m altitude, together with
a DGPS in real-time-kinetic-on-the-flight mode, has delivered digital terrain
levels of flood plains in The Netherlands with an accuracy of 0.5 m. The laser
altimetry method can also be applied from small planes flying at a 500–1000 m
altitude. These planes can move at speeds of 200–300 km/hour in order to
allow a correct registration of their position. In one go, scans are made of a
track of 400 m width. This implies the scanning of more than 100 km
2
during
one hour. The number of points scanned is approximately 600 per ha. The
accuracy of the vertical levels on the maps produced is 5 to 10 cm if powerful
post-processing software is used.
In the scans, vegetation can be separated from the ground level, if the
vegetation is somewhat permeable. Trees, for examples, are recognized and
can be filtered from the surface level. The problem with paddy fields would be
the somewhat unknown depth of water on various plots, as the laser beams
would pass the vegetation, but are reflected at the water surface. Sampling at
ground level would allow the removal of the systematic error, thus leaving only
the standard deviation resulting from the variations in water depths at the
fields.
Technically the method is more or less proven technology. It is expected that
by the year 2000 the complete area of the Netherlands has been resurveyed
this way. However, the method is still rather costly at prices charged having an
order of magnitude of US$5/ha. This is more than the unit price charged in
Laos for conventional surveying. It is expected that these prices will go down
as the initial investment costs are being recovered, possibly to levels of US$
1– 2/ha. The data collected can easily be processed in the form of a digital
terrain model, which has big advantages both for modelling and for the general
process of land and water development.
The potential of this method is the possibility of collecting highly accurate
information on flood plain topographies. The potential for model calibration is
in the possibility to scan water levels along the river during a flood period and
receive an accurate picture of water level variations all along the Mekong
River. In other words, it is expected that this methodology will substantially
improve the quality of hydrodynamic channel flow models, both in terms of the
description of the topography and in terms of the calibration of the models.
FIGURE 5
Schematization of a biological neuron
Artificial neural networks
For extracting information from observed patterns new methodologies have
come up with the further development of computational speed. Data mining
techniques, such as the artificial neural networks (ANNs) enable the
recognition of patterns which link the various sources of data. Contary to
multiple regression techniques, the ANNs do not require prescribed functional
relationships as input. The networks contain the flexibility to create both
relations and their parameters as an integrated set of data.
FIGURE 6
Example of the structure of an ANN
The idea stems from the way neurons function within the brains (Figure 5).
These bio-logical neurons receive signals and pass these on to other neurons
either as amplified or as dampened signals. This process is simulated by the
simplified scheme shown by Figure 6, with amplification functions possibly
defined by a sigmoid or logistic threshold function (Figure 7). Through this
schematization it is possible to define quite non-linear processes.
FIGURE 7
The sigmoid or logistic threshold function
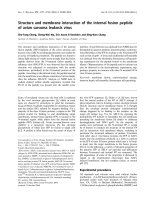
The potential of this technology has been proven in fields as different as hand
written character recognition to stock exchange pattern recognition. In the
fields of hydraulics and hydrology it has been applied to areas as diverse as
rainfall-runoff modelling (Figure 8), to mathematical model emulation in system
optimization, as well as to the establishment of rating curves in areas with
backwaters.
FIGURE 8
Example of rainfall-runoff results produced with an ANN
In practical use, however, some observations have to be made. In the first
place it is evident that the method only works if one tries to connect input
signals to output signals, which also in the physical system show a clear
dependence. For example, in a river catchment the level of the groundwater
table is not just dependent on the current rainfall (input signal), but also to the
antecedent rainfall. For this reason it is clear that either antecedent rainfall
data have to be given as input signals, or the current groundwater level has to
be entered through regressive definitions.
In the second place it has to be stated that the development of the ANN goes
through a calibration or training phase, just as the brains need some time to
process information on what goes on around us and learn from it. However,
whereas the intuitive brains are able to think beyond the limits of what has
been learnt, the ANNs (so far) are not able to extrapolate and any attempt to
do so is punished in the form of the likelihood to produce nonsense. In
principle, this danger of extrapolation is much similar to the extrapolation of
fitted curves, such as, for example, traditionally established rating curves used
in hydrology.
The conclusion on this technology is that it opens up many interesting
possibilities in the field of flood problems, reservoir operation, water balance
computations, rainfall forecasts and many others. The technology is extremely
powerful under the condition that it is used with a lot of common sense.
Hydrodynamic flow modelling in rivers
The numerical description of river flow was developed in the 1970s and the
1980s and has been improved since primarily in terms of numerical
robustness. This is of particular importance in flood forecasting, as one is
dealing with extreme flow conditions. If a model suffers from numerical
problems, it is exactly here that the risk of failure of simulations is highest. For
this reason, robustness is a property that in the selection of numerical models
for flood wave propagation simulation should get a very high priority.
Improvements also stem from technological advances in other areas, such as
data collection and emulation techniques. The progress in the applicability of
hydrodynamic models lies mainly in the progress of computer speed. In
Vietnam, for example, nowadays large, detailed models of the Delta are run
frequently to study salt intrusion in relation to various irrigation options,
drainage problems, including the comparison of various alternatives etc.
For optimization of systems, hydrodynamic models are currently only used in
trial and error approaches. If many simulations are required, such as for on-
line control of hydraulic systems, emulation techniques replacing the
hydrodynamic models with, are being used. In such case, the ANN is trained
on the basis of a selected number of simulations with an accurate
hydrodynamic model. After this training, the ANN is applied to study a large
number of alternatives and to compare the functioning of these. Here, again, it
has to be stated that in such processes the ANN should not be used in
extrapolation mode. In other words, it should not be used for cases for which it
has not been trained.
Potential improvement in reliability of flood forecasts
The reliability of forecasts can be increased in various ways, such as:
• the improvement of rainfall forecasts;
• improved catchment modelling;
• improved channel routing; and
• improved model updating techniques.
In addition, the current possibilities of user interfaces, data bases and GIS
systems provide substantial scope for improvements in handling data entry
and dissemination of the forecasts.
More reliable forecasts are possible in the first place by improving the rainfall
forecasts. For given meteorological conditions, rainfall forecasts can be made
on the basis of various types of measurements, such as areal rainfall
distributions, atmospheric pressure distributions, wind directions and vapour
content. Radar measurements are useful, as well as satellite images. The
problem is in making this information available at the forecasting centre and in
extracting the correct information from such data.
Another and more accessible source of data for precipitation forecasting is the
weather maps. MRCS has recently introduced the practice of using the
catchment rainfall from the areal rainfall forecasts produced by the Global
Numerical Meteorological Model as a reference in rainfall forecasting. This
method could be improved further through the calibration of which would
establish relationships between catchment integrated rainfall from the weather
forecast bit maps and the resulting catchment runoff. This approach is
expected to replace the need for a much denser rain gauge network and its
associated transmission system in the Mekong Basin This is particularly
useful, as the installation of more rainfall gauges is not very practical in remote
catchments in mountainous areas of the Mekong Basin. Any approach to flood
forecasting which minimizes the need for ground stations should be given
favourable consideration.
Another improvement is based upon a re-calibration and possible replacement
of the rainfall-runoff models for the Mekong subcatchments. Currently, the
forecasting system uses eight subcatchments, for which rainfall-runoff
simulation is made. This should be extended to the development of rainfall-
runoff models for each individual main tributary, as was already attempted at
the beginning of the eighties. Besides the SSARR model, a variety of other
rainfall runoff models would be suitable, such as the Sacramento model, tank
models etc. The upgrade of the forecasting system should include extension
and re-calibration of sub-catchment models, based upon information collected
at MRCS during the past decade.
Further improvements are possible by replacing the SSARR channel routing
model by a full hydrodynamic model. A hydrodynamic model is the only tool
enabling flood forecasting in the flat areas of Cambodia and Vietnam. The
calibration of the WENDY model, as part of the Mekong Master Model project
finalized in 1991 has proven that such model can be developed with sufficient
accuracy for the Mekong River, despite the shortcomings in accuracy of
topographical data. The lack of accuracy, in this case, was substituted with
knowledge on the flood deformation characteristics and their relation to
channel cross-section parameters. As discussed, there is now a good scope
for further improvement of the hydrodynamic models. It is quite unfortunate
that so far the hydrodynamic model was never incorporated into the
forecasting system.
A clear advantage of incorporating the existing hydrodynamic model in the
forecasting system is the readily available possibility to extend the forecasting
system to locations in Cambodia and Viet Nam as it includes the Tonle Sap
River, the Great Lake and the main branches in the Mekong Delta. The
principal reason to separate the model parts during their development in the
period 1988–1991, at least the model parts 1 and 3, has been the lack of
computational speed at that time. The various components were running on
PC's with an Intel 386 processor. With the currently available Pentium
processors combined models would be feasible and the forecasting system
could easily be extended on the basis of one single model from Chiang Saen
to the sea.
A last element in improving the flood forecasts is an updating procedure,
which handles uncertainties in input data. Currently, the updating is based
upon a simple replacement of computed river discharges by measured ones in
case of differences between both data sources. However, such procedure
does not update the state of catchment storage and this is a deficiency that
may contribute significantly to errors in forecasts. It is recommended to
replace the updating method by a scientifically sounder approach, such as
Kalman filtering.
Capacity building at MRCS - HU
In 1994 a Mekong Hydrological Programme Review Mission (HRM) evaluated
the Mekong Hydrology Programme (MHP) seeking donor assistance for the
execution of various projects. The outcome was the recommendation to give
priority to institutional strengthening of the Mekong Secretariat, both through
capacity building and through the development of support software.
After the signing of the new agreement on continued co-operation on the
Mekong in 1995 and the formation of MRC, the recommendations were
reviewed again in 1997 in the light of the new MRC mandates. This review
was made by Prof. Bogardi, who also headed the 1994 HRM. The outcome
was a revised report with a recommendation to GON to fund a project with
institutional strengthening of MRCS and human resources development as the
principal objectives, together with the recommendation to start the MHMP
programme as a slightly modified and updated version of the HRM proposal of
1994. The MHMP programme proposed envisages the development of a
framework within which various software packages already available at
MRCS, or packages that will be acquired, are to be incorporated and
connected in a consistent manner.
The recommendations are a recognition of the need to develop an integrated
set of tools, instead of the bits and pieces of software installed at MRCS until
now. However, it would be advisable to combine such programme with well
defined consultancy targets of the staff of MRCS. As an example, as part of
the proposed institutional strengthening it would be advisable to upgrade the
current forecasting system.
Particularly useful elements of such a programme are on-the-job training
programmes, where staff of MRCS works with a variety of specialists in
various topics related to data collection, data storage and retrieval, data
processing, flood forecasting, flood control, river morphology, environmental
management, water resources management and many other. The on-the-job
training must be a well planned part of the project and should be
complemented by short seminars given by the visiting specialists prior to the
start of the implementation work.
Floods in subcatchments: example of the Vientiane Plain
Laos is a mountainous country with a land area of 236 800 km
2
and a
population of nearly 5 million. Over 80% of the population lives in rural areas,
with rice production as the principal source of income. Only approximately 9%
of the country is suitable for agricultural production. As this limitation puts
much strain on the population living in the mountainous areas, the practice of
slash-and-burn is increasing, with a decreasing number of years left between
successive use of the land for cultivation. This practice is a highly damaging
cause of deforestation and erosion. Laos is one of the poorest countries of
Asia, with a gross national product of approximately US$ 260 per caput per
annum.
The cultivable areas of Laos are mainly situated along the banks of the
Mekong River. The level of protection against such floods, so far, is low.
Floods are a yearly returning threat to the farmers cultivating their crops in the
vicinity of the Mekong River.
One of the most densely populated areas of the country is the Vientiane Plain,
located North of the capital Vientiane, between the Nam Ngum I Reservoir
(Figure 9) and the confluence of the Nam Ngum and Mekong Rivers. The area
has a population of approximately 600 000 inhabitants and is one of the
principal rice producing areas of Laos. This area was severely flooded in 1995.
In the past, the Vientiane Plain was frequently flooded, a situation which
improved after the construction of the Nam Ngum Reservoir in 1971. However,
a large part of the area is still threatened by floods. The extent of flood
damage varies from year to year. The principal problem of floods is the
restriction the farmers feel in selecting high yielding rice varieties.
Consequently, a sustainable agricultural development of the area and a
reliable food supply to the growing population of the Vientiane Plain is highly
dependent on an improved flood control.
FIGURE 9
The Nam Ngum I catchment
The extent of 1995 flood damage was studied in large detail with the
assistance of FAO. This study has led to the preparation of a flood depth map
of the Vientiane Plain. The map, which is available at the MAF-DOI office,
shows flood depths of 2–5 metres and in some depressions up to 8 metres.
The flooded area shown is approximately 40 000 ha. The map clearly shows
that there is hardly any flow from the Mekong into the Vientiane Plain, except,
possibly, through back flow into the Nam Ngum.
It should be noted that the accuracy of the flood maps is limited, due to the
lack of reliable topographic data of the Vientiane Plain. The underlying
topographic maps date from 1960 and have a scale of 1:50 000. Levels,
however, are not satisfactorily shown, as only 10 meter contour lines and a
number of spot levels are given. The preparation of the flood maps was based
upon interviews with the local population and the estimated flood depths at all
spots investigated were plotted on the 1:50 000 scale topographic maps. In
the same project, the flood damage was assessed, resulting in an estimated
loss to assets and agricultural production of US$ 21 million.
For the flood several possible causes have to be mentioned:
• high discharge from the Nam Ngum reservoir, which during the 1995
flood had a maximum inflow of 2 550 m
3
/s and a maximum outflow of 2
421 m
3
/s. The turbines passed 472 m
3
/s that day, whereas 1949 m
3
/s
left the reservoir via the spillway at a reservoir level of 213.60 m above
mean sea-level (masl). The catchment area upstream of the dam is 8
388 km
2
. The PMF for the dam has been estimated at 4 545 m
3
/s at a
reservoir level of 214.83 masl;
• high discharge from the Nam Lik river, which joins the Nam Ngum river
just downstream of the Nam Ngum dam site with a catchment area of 5
212 km
2
;
• additional local rainfall on the Vientiane Plain and the remaining part of
the Lower Nam Ngum catchment, which has an area of 3 363 km
2
of
the total 16 963 km
2
of the complete Nam Ngum catchment; and
• high Mekong River levels, which impede drainage from the Vientiane
Plain via the Nam Ngum River.
One of the factors that influenced the severity of the floods may have been the
delayed opening of the Nam Ngum I spillway gates. So far, reservoir operation
is only based upon the optimization of hydro-electric energy production. Yearly
energy yield has an export value of US$ 20 million, partly as base energy
supply and partly as peak energy. The higher priced peak power contracts
make it interesting to keep the end of the monsoon reservoir levels as high as
possible.
The export earnings gained from the hydropower production makes it difficult
to give a balanced priority to the conjunctive use of the reservoir for flood
control purposes. So far, a thorough evaluation of the role the reservoir
operation has played on the generation of the flood damage has not been
carried out to sufficient depth, simply due to a lack of understanding of the
overall functioning of the system.
Hydropower and flood regulation
Hydro-electric power is an important export product of Laos. The exploitable
potential of hydropower generation in Laos is 18 000 MW. Currently, only
approximately 2% of this potential has been developed. However, the further
development of the potential is expected to accelerate, as GOL has been
signing contracts for the delivery of electricity to Thailand (1 500 MW by the
year 2000) and Viet Nam (1 500 to 2 000 MW by the year 2010). In addition,
the domestic energy consumption is growing at a rate of 8 to 10 percent
annually.
Currently, the total installed hydropower capacity is 203 MW. The largest
hydropower plant is Nam Ngum I, with an installed capacity of 150 MW. Of
this, 30 MW was installed in 1971, working from the start at the full supply
level of 202.50 masl. The plant was extended in 1978 with the installation of
an additional 80 MW. The system was completed in 1984 by adding another
unit of 40 MW.
Collection of data just upstream of the Nam Ngum dam site started in 1967.
The hydrometric station was abandoned during the filling of the reservoir.
Since 1971 the recorded reservoir outflows have been filed. Lahmeyer
International converted the outflowing discharges into a series of inflowing
discharges based upon the recorded reservoir levels and the reservoir
geometry. Mean monthly discharges are reported to be reliable. A lower
accuracy must be attached to the mean daily inflows generated.
The area of the Nam Ngum I reservoir is approximately 370 km
2
at the level of
212 masl, which is nearly the same as the area of the Vientiane Plain flooded
in 1995. In a very approximate way this leads to the conclusion that every
additional meter of flood storage depth created in the reservoir, leads to a one
meter reduction in flood depth on the Vientiane Plain. Of course, one must be
very careful with such a conclusion, as the reduced flood depths also lead to
reduced drainage capacities towards the Mekong River, so the effect of
creating flood retention volume in the reservoir might be less than expected.
In the Vientiane Plain the situation is in fact even more complex, as an
important contribution to floods is given by the discharges from the Nam Lik
river. Moreover, floods are aggravated by the contribution of local rainfall.
Such a complex system can only be studied thoroughly through simulations
based upon a hydrodynamic modelling package and assuming that for such
model development data of a reasonable quality are available.
Flood forecasting and simulation modelling for the Vientiane Plain
Although the existence of the reservoir is most likely beneficial to flood control,
a modified operation might have prevented a substantial part of the damage.
Such statements, however, can only be supported with the development of a
thorough knowledge of the flood system through simulation of various
scenarios by means of a hydrodynamic flood simulation model. The need for
the development of this understanding is felt both in the Ministry of Industry
and Handicrafts (MIH - Electricité du Laos) and in the Ministry of Agriculture
and Forestry (MAF - Department of Irrigation). There appears to be a clear
willingness to cooperate on this issue.
The development of the flood simulation model will have the following
components:
• institutional arrangements
• detailing of a ToR
• financing
• appointment of a consultant
• acquisition of the suitable data processing and modelling tools
• hydrological data collection
• topographic survey of the Vientiane Plain
• model calibration and simulations, and
• capacity building in Laos
The institutional arrangement requires the consensus of MIH and MAF on the
establishment of a Flood Modelling Centre. One possibility might be to create
the Centre at the Lao National Mekong Committee (LNMC) in Vientiane, with
additional staffing provided by MIH and MAF. Currently, LNMC has a total staff
of 11 of which: 3 irrigation engineers, 2 hydrologists, 1 civil engineer, 2
technicians and 3 in the administration. It is foreseen to extend the technical
staff with 3 more members, funded by GOL. Training of this new and/or
detached staff would have to get a high priority. Part of this training should be
on-the-job training programmes under the supervision of international
consultants. A close cooperation with MRCS would be possible and
recommended.
The ToR would focus on the need to generate the understanding of the
behaviour of physical and partly controlled process of flood wave propagation
through the Vientiane Plain. The model would enable the study of various
flood control mechanisms, including the construction of flood protection works,
reservoir operation options. It would include a tool for the optimization of
hydropower production and flood control. Preferably and if feasible, it should
include rainfall-runoff modelling of the complete Nam Ngum catchment in
order to support such reservoir optimization. The model should be extended to
include flood forecasting along the lines described above. Full advantage of
this model use and minimum losses in energy production could be achieved
when the model would be complemented with a flood forecasting system for
Nam Ngum I reservoir. If based on the same concepts as proposed for the
Mekong flood forecasting system, the reservoir inflow forecasting system
would not require the (impossible) installation of additional rain gauges in
remote upstream locations.
The total package of modelling support, therefore, would include the following
model components:
• flood prediction model of the Vientiane Plain, for the study of the
effects of flood propagation through the Plain as a result of the
controlled and/or uncontrolled upstream discharges, Mekong levels
and the flood control works which could be constructed in the Plain.
The tools should preferably be those already in use at MRCS;
• rainfall-runoff models of the catchments of the Nam Lik river and the
Nam Ngum river upstream of the reservoir;
• a flood forecasting model for the same catchments, set up along the
lines described above;
• a reservoir operation optimization component, based upon a global
optimization technique, such as a genetic algorithm approach.
The set of tools would support the following types of studies:
• further develop the understanding of the flood mechanism of the
Vientiane Plain. This would also allow for a comparison of the floods
occurring with and without the reservoir or the routing of other historic
floods, such as the 1996 event;
• compare various options of controlled flooding of the Vientiane Plain
and prioritize these in terms of various options of protecting parts of the
flood plain, e.g. construction of low dikes around the higher elevated
parts, creation of storage areas etc.;
• optimize the control of the spillway gates of Nam Ngum I by using
historic records, possibly complemented with records generated
through the used of the rainfall-runoff models fed with historic rains;
• optimization of reservoir operation on the basis of real time control by
implementing the flood forecasting model;
Apart from its function of supporting flood control studies, the modelling project
should be seen as a necessary preceding action to support a Master Plan
Study defining a staged development of the Vientiane Plain. Such
development would require studies on partial flood control and possibly
include controlled flooding concepts. Such developments can no longer be
based upon an interative approach, without using the informatics and
modelling support available nowadays. The Master Plan would be a logical
follow-up to the “Nam Ngum River Basic Management” project, announced in
1996 by ADB.
One of the major problems encountered in setting up the modelling tools is the
lack of accurate topographic data of the Vientiane Plain. The 10 m contour
lines and the incidental spot levels are by no means sufficient to represent the
storage and conveyance components of the system. Additional surveying is
expensive. For the purpose of modelling, land level information on a grid of at
least one point per ha would be required. Moreover, level and position of all
sorts of dikes and roads in the area would have to be collected. This last
information is rather easy to collect, especially with the current availability of
DGPS.
Of late, these DGPS instruments can be mounted on a car or a motorbike and
even in a back pack, which allows for travelling along roads and dikes crests.
By continuous recording or by a stop-and-go method, the position can be
stored continuously in terms of x-y-z co-ordinates. The method allows for an
accuracy in the vertical level of a few centimetres. Total cost of the preparation
of a digital terrain model of the Vientiane Plain for modelling purpose would be
of the order of US$ 200 000, depending on how easy it is to get full access to
the terrain. The data collected could be further processed to support
agricultural development studies. However, for the combination with these
studies the more accurate and flexible method of airborne laser altimetry is to
be preferred. The cost of this process will most likely be two to three times
higher.
Detailing of a ToR for a complete modelling project would require a separate
mission. A rough estimate of the budget required is US$0.8 million for
consultancy input, transfer of tools, training programmes and the additional
collection of data. The study component of the project would provide Laos with
a pilot investigation, which could be replicated at other flood-prone areas.
Capacity building has to be an important element of the project. Laos has a
strong need for capacity building.
Flood control: example of Bangladesh
Flood control in the flood plains of the Mekong Basin has already been applied
on a substantial scale in Thailand. The primary reason for flood control is the
protection of agricultural production. In larger river systems, with an often
rather predictable time of arrival of the flood peak, the concept of controlled
flooding has been introduced. Controlled flooding implies that flooding will be
allowed, though at a lower frequency and at a time suiting better the cropping
pattern. The principle behind it is the creation of a delay of the flood, so that
usually the crops can be harvested before the area gets inundated.
Controlled flooding implies that in the case of extreme floods the waves still
find storage for their dampening and show propagation. The unsetady flow
equations describing the propagation of flood waves show us that the travel
time of flood waves is a linear function of the storage available. Taking storage
away makes the flood waves travel faster. The dampening of a flood wave
peak is a quadratic function of the storage, due to the fact that slower
travelling flood waves have a smaller length for a given wave period. It is
primarily this smaller wave length along the river that leads to the increased
dampening.
An interesting example of comprehensive flood control is the Flood Action
Plan (FAP) of Bangladesh. On the basis of above principles, an analysis was
made for the whole country regarding suitable measures against floods. In
Bangladesh there are three principal causes of flooding:
• floods caused by the effects of atmospheric depressions passing over
the Bay of Bengal. These floods are very severe, can only be forecast
with relatively short lead times and may cause many victims. Given the
nature of the floods in this country, coastal defence works are too
costly to cope with this problem;
• floods caused by the flood waves coming down from the Himalayan
mountains and propagating via the Ganges and the Brahmaputra
Rivers. In some years these flood peaks coincide and cause severe
flooding. The lead time in forecasting, however, is much higher than for
the coastal floods and the number of victims is usually small. Dikes are
often attractive investments to improve the agricultural production by
reducing damage and by encouraging the farmers to plant higher
yielding rice varieties;
• flash floods of local origin, due to the high local rainfall intensities and
depths.
One important difference in relation to other parts of the world where flood
control measures were introduced is that Bangladesh has a very controlled
approach to flood mitigation works. Whereas in the past, many areas of the
world developed their flood control works on the basis of trial and error, the
approach in Bangladesh has been much more planned, with design options
continuously checked on the basis of model simulations.
Bangladesh experienced one of the most catastrophic river floods in 1988,
immediately after the already high flood of the 1987 monsoon. The damage of
the 1987 flood had hardly been repaired when most of the results of these
efforts was lost again.
UNDP, World Bank and various donor countries joined efforts to launch a
Flood Action Plan, with a budget of US$ 150 million. Of this fund, US$ 55
million would be directed to pilot projects for testing approaches, river bank
protection and flood plain management.
In terms of planning of projects the country was at that moment already
prepared, as in March 1987 the National Water Plan (NWP) had been
concluded at the Master Plan Organization (MPO). The NWP had assembled
a substantial amount of data and other information, developed a range of
planning models and analytical tools and had recommended strategies and
programmes. Many of these had already been adopted by the government
and donor organizations.
One of the tools that had been developed at MPO was a suite of surface water
simulation models. This project, funded by UNDP and executed under the
supervision of the World Bank by the Danish Hydraulic Institute (DHI), had
already produced a general model of the main river system in Bangladesh and
a regional model of the South East Region. One of the objectives of the project
had been the development of such regional models for the simulation of the
effects and control of various flood control alternatives.
Another important objective of the project had been the development of local
expertise in the use and development of such models. The project, therefore,
had a clear capacity building component with the following elements:
• lecture programme organized at the Bangladesh University of
Engineering and Technology;
• participation in a specialized training programme at the consultant's
home office;
• participation in some courses abroad;
• on-the-job training under the guidance of expatriate specialists.
Especially this last component of the project has been very useful and has
partly explained the success of the group which, initiated in 1986, now has a
staff of 42 local engineers and is in charge of all modelling support to water
control and management projects in Bangladesh. It also is in charge of
executing all modelling work related to flood forecasting in the country.
Bibliography
Bogardi, J.J., 1997. Report on the Review Mission of the Mekong Hydrology
Programme, MRCS, Bangkok.
Cunge, J.A., Holly, F.M. and A. Verwey. Reprinted 1994 Practical Aspects of
Computational River Hydraulics, Iowa Institute of Hydraulic Research.
DANIDA. 1997. Revised Proposal for Flood Forecasting and Effective
Warning Dissemination in the Lower Mekong Basin.
Delft Hydraulics. 1989. Network Optimization in the Mekong Basin, Final
Report.
Delft Hydraulics. 1991. Mekong Master Model, The Mekong Secretariat.
Hasan, M.R. 1996. Preparation of Flood Loss Prevention and Management
Plan, Technical Report on Hydrology and Field Data Collection, FAO, Rome.
Hasan, M.R. 1997. Preparation of a Comprehensive Flood Loss Prevention
and Management Plan for the Agricultural Sector, Report on Flood Plain
Mapping and Flood Loss Prevention and Management, FAO, Rome.
Minns, A.W. 1998. Artificial Neural Networks as Subsymbolic Process
Descriptors, Ph.D. Thesis, IHE - Balkema, Delft - Rotterdam.
MRCS. 1997. The Mekong Hydrology Model Package (Basinwide).
Somboune Manolom, Hydropower and the Environment, Lao PDR,
International Energy.
Reservoir management and options for flood control
Effects of reservoirs on floods
The purpose of a reservoir is usually to store water in the wet season and to
increase downstream flows in the dry season
• to maximize hydropower benefits
• to cover downstream water demands
• to improve year-round navigation
• to reduce flood damages
• to prevent a river from falling dry during droughts