presentation eberhard standl changing picture type 2 warsaw 2006
Bạn đang xem bản rút gọn của tài liệu. Xem và tải ngay bản đầy đủ của tài liệu tại đây (3.64 MB, 51 trang )
The changing picture
of Type 2 diabetes
E. Standl
International Diabetes Research Institute
Munich
Case report – Mr. K., 56 Yrs
Case report – Mr. K., 56 Yrs
•
First visit: Dyslipidemia
•
Triglycerides 786 mg/dl
•
Total Cholesterol 318 mg/dl
•
LDL-Chol: not measurable
•
HDL-Chol 26 mg/dl
•
Preprandial BG 178 mg/dl
•
HbA1c 8.8 %
•
Blood pressure 168/92 mmHg
Case report – Mr. K., 56 Yrs
Diagnoses:
•
Metabolic Syndrome
•
Type 2 Diabetes mellitus
•
Obesity
•
Hypertension
•
Dyslipidemia
•
Coronary heart disease
Indication for a potentially
fatal constellation
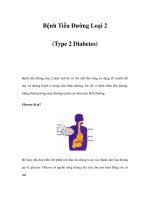
Pathogenetic key organs and hormones
in Type 2 diabetes
Seeley et al, Nature Medicine (2004) 10 :454
Food
Muscle
Liver
Glucose
Fuel
Artery
Pancreas
Insulin
Adipose tissue
Leptin &
Adiponectin
Glucagon
Metabolic syndrome / Insulin resistance:
causes and associated disease
A g e
D r u g s
A d i p o s i t y a n d
p h y s i c a l i n a c t i v i t y
G e n e t i c s
G l u c o s e
t o x i c i t y
T y p e 2
d i a b e t e s
H y p e r t e n s i o n
D y s l i p i d e m i a
P r o c o a g u l a t o r y
s t a t e
E n d o t h e l i a l
d y s f u n c t i o n
c h r o n i c l o w
g r a d e
i n f l a m m a t i o n
L i p a t r o p h y
L o w b i r t h
w e i g h t
C A R D I O - / M A C R O - V A S C U L A R D I S E A S E
INSULIN RESISTANCE
METABOLIC SYNDROME
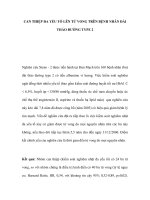
IRIS II: Insulin Resistance and
Chemical Profile
Parameter HOMA sensitive HOMA resistant (>2.0) Significance
N 1146 3119
Insulin [uU/ml] 6 ± 2 17 ± 11 p<0,001
Intact Proinsulin [pmol/l] 5 ± 4 14 ± 14 p<0,001
Resistin [ng/ml] 0,7 ± 3,6 0,3 ± 0,4 n.s.
PAI-1 [AU/ml] 160 ± 95 202 ± 99 p<0,001
Glucose [mg/dl] 95 ± 22 120 ± 35 p<0,001
HbA1c[%] 6,4 ± 1,0 7,0 ± 1,3 p<0,001
Triglycerides [mg/dl] 148 ± 160 210 ± 163 p<0,001
HDL [mg/dl] 52 ± 14 46 ± 12 p<0,001
LDL [mg/dl] 125 ± 33 128 ± 33 n.s.
CRP [mg/dl] 1,7 ± 1,4 1,9 ± 2,4 n.s.
Fibrinogen [g/l] 2,8 ± 1,0 2,9 ± 1,0 n.s.
Adiponectin [mg/mi] 13 ± 7 8 ± 5 p<0,001 (n=500)
Pfützner/Standl Diabetic Medicine 2004
C o r o n a r y h e a r t d i s e a s e m a y b e p r e s e n t
a t d i a g n o s i s o f T y p e 2 d i a b e t e s
T h e M u n i c h G P - P r o j e c t : C h a r a c t e r i s t i c s o f a r a n d o m c o h o r t o f
r e c e n t l y d i a g n o s e d T y p e 2 d i a b e t i c p a t i e n t s
S t a n d l e t a l 1 9 9 3 D i a b e t o l o g i a 3 6 : 1 0 1 7 - 2 0
Campaign „Enduring Freedom“
from complications in
Type 2 diabetes
Below 6,5 and 3x below 100!
i.e. below 6,5% HbA1c
below 100 mg/dl fasting blood glucose
below 100 mg/dl LDL-Cholesterol
below 100 mmHg mean blood pressure
(eg. below 120/80)
HbA1c<6,5%
Cholesterol<175mg/dl
Triglycerides<150mg/dl
Syst BP<130mm Hg
Diast BP<80mm Hg
of Patients
Gaede et al. NEJM(2003) 348:383-393
Percentage of patients
achieving set intensive
targets in the Steno 2 Study
0
20 40 60 80 100%
Despite major advances in the treatment
of Type 2 diabetes, only a minority of
patients meets glycemic targets longer term
1) efficacy of present pharmacotherapy options
is limited
2) insulin secretory deficit increases progressively
3) pathophysiology is only partially understood
4) present pharmacotherapy may be burdened by
side effects
5) self management by the patient is mandatory, but
often a difficult challenge
because
12
All Current Treatments for Type 2 Diabetes
Have Limitations
Sulfonyl-
ureas
Insulin Metformin Acarbose Thiazolidi-
nediones
Hypoglycemia
✬ ✬
GI side e#ects
✬ ✬
Lactic acidosis
✬
Weight gain
✬ ✬ ✬
Edema
✬
Need LFT monitoring
✬
Restricted
populations
✬ ✬
Poor responder rate
✬
Achieving goals with
monotherapy
✬ ✬ ✬ ✬
Arguments in favor of
early combination
therapy:
•
additive e+cacy through di#erent mode
of actions
•
therapy of di#erent abnormalities
•
at medium dose 70-80% of maximum
e#ect less
side e#ects
Glitazones
α-Glucosidase
inhibitors
Metformin
Sulfonylureas
und Analogs
Incretin enhancers
+Monotherapy Insulin +/- oral agents
Campbell IW. Br J Cardiol 2000;7:625-31
Target-driven approach for sustained
glycaemic control
7
6
9
+Combinations of oral
agents
8
Diet
HbA
1C
(%)
HbA
1C
< 7%
approach
ULN
Diagnosis +5 yrs +10 yrs + 15 years
Failure-based
treatment
of symptoms
approach
16
1
Gastrointestinal
2
Thiazolidinedione
Adapted from DeFronzo RA. Br J Diabetes Vasc Dis. 2003;3(suppl 1):S24–S40
Current Oral Therapies Do Not Address the
Multiple Defects in Type 2 Diabetes
Sulfonylureas
Glinides
Impaired
insulin
action
Inadequate
glucagon
suppression
(α-cell
dysfunction)
Glucose
in?ux from
GI
1
tract
α-Glucosidase
inhibitors
TZDs
2
Metformin
Chronic
β-cell
decline
↑ Plasma glucose and disease progression
Acute
β-cell
dysfunction
unmet need unmet need
β-Cell Mass Is Significantly
Decreased in Obese IFG and
T2DM Patients
*P < .05 vs NGT
†
P < .001 vs NGT
Adapted from Butler A, et al. Diabetes. 2003;52:102-110.
0
0.5
1.0
1.5
2.0
2.5
3.0
NGT
(n = 31)
IFG
(n = 19)
T2DM
(n = 41)
β -C ell V olume (% )
*
†
0
0.5
1.0
1.5
2.0
2.5
3.0
NGT
(n = 31)
IFG
(n = 19)
T2DM
(n = 41)
β -C ell V olume (% )
*
†
Mc Keigne et al, Lancet (1991) 337: 382
0 . 8 0 0 . 9 0 1 . 0 0
0 . 8 0 0 . 9 0 1 . 0 0
0 . 8 0 0 . 9 0 1 . 0 0
0 . 8 0 0 . 9 0 1 . 0 0
0 . 8 0 0 . 9 0 1 . 0 0
1 1 0
1 2 0
1 3 0
0 . 5
1 . 0
1 . 5
2 . 0
1 . 0 0
1 . 2 0
1 . 4 0
2 0
4 0
0
0
1 0
2 0
3 0
E u r o p e a n S o u t h A s i a n
HDL
cholesterol
(mmol/l)
2h triglyceride
(mmol/l)
Median systolic
blood pressure
(mmHg)
2h insulin
(mmol/l)
Diabetes
prevalance (%)
Association of waist to hip ratio with
parameters of metabolic syndrome
IDF consensus definition (2005)*
Central Obesity
Waist circumference – ethnicity specific*
– for Europids: Male ≥ 94 cm
Female ≥ 80 cm
plus any two of the following:
Raised Triglycerides
≥150mg/dL (1.7mmol/L)
or specific treatment for this lipid abnormality
Low HDL Cholesterol
<40mg/dL (1.03 mmol/L) in males
<50mg/dL (1.29 mmol/L) in females
or specific treatment for this lipid abnormality
Raised blood pressure
Systolic : ≥130 mmHg or
Diastolic: ≥85 mmHg or
Treatment of previously diagnosed hypertension
Raised fasting plasma glucose
(FPG)
FPF ≥100 mg/dL (5.6 mmol/L)
or
Previously diagnosed type 2 diabetes
If above 5.6 mmol/L or 100 mg/dL, OGTT is strongly recommended but is
not necessary to define presence of the syndrome.
* For country/ethnic specific waist circumference values, see Alberti KGMM., IDF Consensus on the Metabolic Syndrome:
Definition and Treatment, presented at 1st International Congress on Prediabetes and the Metabolic Syndrome, Berlin, 14
April 2005, available on-line: />
Interrelation of adipose tissue,
islet health,
and glucose tolerance state
INSULIN RESISTANCE
+ healthy islets + impaired islets
normal
glucose
tolerance
impaired
glucose
tolerance
OBESITY
Diagram courtesy of E. Standl, Munich
Rimonabant
Rimonabant
CB
1
Adipocyte
Brain
CB
1
Adiponectin
FA oxidationFA oxidation
↓
Body weight
Central
e#ects
Metabolic
peripheral e#ects
F
F
A
c
l
e
a
r
a
n
c
e
F
F
A
c
l
e
a
r
a
n
c
e
Rimonabant (CB1 Blocker): A Multi-Impact Drug
↓
Hyperinsulinemia
Insulin sensitivity restored
↓
TG
↑
HDL-C
Control of nicotine
dependence
Decrease in food intake
(palatable and non-
palatable food)
Van Gaal et al; Lancet (2005) 365: 1389-97
The Endocannabinoid System
Rimonabant Phase III program
Seven studies including > 13,000 patients
RIO Program in Obesity
(>6,600 patients enrolled)
RIO-North America - 2-year treatment
RIO-Europe - 2-year treatment
RIO-Lipids - 1-year treatment
RIO-Diabetes - 1-year treatment
STRATUS Program in Smoking Cessation
(>6,500 patients enrolled)
STRATUS US - 10-week treatment
STRATUS Europe - 10-week treatment
STRATUS worldwide - 1-year treatment
ITT LOCF
placebo: -1.8kg
5 mg : -3.4kg (p = 0.002 vs. placebo)
20 mg : -6.6kg ( p < 0.001 vs. placebo)
Weeks
Weight (kg)
Weight (kg)
Placebo Rimonabant 5mg Rimonabant 20mg
Changes in Weight and Waist Circumference
Weight change (kg)
Completers
-3.6
-4.8
-8.6
ITT LOCF
placebo: -2.4 cm
5 mg : -3.9 cm; (p = 0.002 vs. placebo)
20 mg : -6.5 cm; (p < 0.001 vs. placebo)
Weeks
Waist (cm)
Waist (cm)
Waist circumference change (cm)
Completers
-4.5
- 5.3
-8.5
n=315n=330n=317
7.3 ± 0.87.3 ± 0.87.2 ± 0.9
Baseline
6.7 ±0.97.2 ± 1.17.3 ± 1.1
Year 1
-0.7 (0.1)**-0.2 (0.1)*
Difference
rimonabant
v. placebo (SEM)
-0.6 ± 0.8-0.1 ± 1.00.1 ± 1.0
Change
Rimonabant
20 mg
Rimonabant
5 mg
Placebo
%
(Mean ± SD)
n=315n=330n=317
7.3 ± 0.87.3 ± 0.87.2 ± 0.9
Baseline
6.7 ±0.97.2 ± 1.17.3 ± 1.1
Year 1
-0.7 (0.1)**-0.2 (0.1)*
Difference
rimonabant
v. placebo (SEM)
-0.6 ± 0.8-0.1 ± 1.00.1 ± 1.0
Change
Rimonabant
20 mg
Rimonabant
5 mg
Placebo
%
(Mean ± SD)
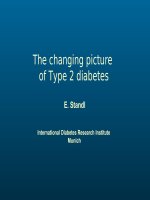
RIO~DIABETES: Change in HbA
1c
*p=0.034
**p< 0.001
ITT, LOCF
Completers:
R5mg vs Placebo : -0.1% v. +0.1%, p=0.035
R20mg vs Placebo : -0.7% v. +0.1%, p<0.001