Castings 2 Episode 5 pps
Bạn đang xem bản rút gọn của tài liệu. Xem và tải ngay bản đầy đủ của tài liệu tại đây (787 KB, 25 trang )
88
Castings
However, for investment casting the ceramic shell
allows a complete range of temperatures to be chosen
without difficulty. From Equation 3.3 it is seen
that the freezing time is proportional to the difference
between the freezing point of the melt and the
temperature of the mould. The few tests of this
prediction are reasonably well confirmed (for
instance, Campbell and Olliff 1971).
One important prediction is that when the mould
temperature is raised to the melting point of the
alloy, the fluidity becomes infinite; i.e. the melt
will run for ever! Actually, of course, this self-
evident conclusion needs to be tempered by the
realization that the melt will run until stopped by
some other force, such
as
gravity, surface tension
or the mould wall! All this corresponds
to
common
sense. Even
so,
this elimination of fluidity limitations
is an important feature widely used in the casting
of thin-walled aluminium alloy investment castings,
where it is easy to cast into moulds held at
temperatures in excess of the freezing point of the
alloys at approximately 600°C. Single crystal turbine
blades in nickel-based alloys are also cast into
moulds heated to
1450°C
or more, again well above
the freezing point of the alloy.
Any problems of fluidity are thereby avoided.
Having this one concern removed, the founder is
then left with only the dozens of additional important
factors that are specified for the casting. Solving
one problem completely is
a
help, but still leaves
plenty of challenges for the casting engineer!
3.3.4
Effect of surface tension
If metals wetted the moulds into which they were
cast, then the metal would be drawn into the mould
by the familiar action of capillary attraction,
as
water
wets and thus climbs up
a
narrow bore glass tube.
In general, however, metals do not wet moulds.
In fact mould coatings and release agents are
designed to resist wetting. Thus the curvature of
the meniscus at the liquid metal front leads to
capillary repulsion; the metal experiences a back
pressure resisting entry into the mould. The back
pressure due to surface tension,
PST,
can be
quantified by the simple relation, where
r
and R
are the two orthogonal radii which characterize the
local shape
of
the surface, and
y
is the surface
tension:
PsT
=
2y{ (llr)
+
(1IR)J
(3.11)
When the two radii are equal, R
=
r,
as
when the
metal is in a cylindrical tube, then the liquid
meniscus takes on the shape of a sphere, and
Equation 3.5 takes on the familiar form:
PST
=
2ylr
(3.12)
Alternatively, if the melt is filling
a
thin, wide strip,
so
that R is large compared with r, then 1IR becomes
negligible and back pressure becomes dominated
by only one radius of curvature, since the liquid
meniscus now approximates the shape of a cylinder:
P,,
=
ylr
(3.13)
At the point at which the back pressure due to
capillary repulsion equals or exceeds the hydrostatic
pressure,
pgh,
to fill the section, the liquid will not
enter the section. This condition in the thin, wide
strip is
pgh
=
ylr
(3.14)
This simple pressure balance across
a
cylindrical
meniscus is useful to correct the head height, to
find the net available head pressure for filling
a
thin-walled casting.
In
the case of the filling of a
circular section tube (with
a
spherical meniscus)
do not forget the factor of 2 for both the contributions
to the total curvature
as
in Equation 3.12. In the
case of an irregular section, an estimate may need
to be made of both radii,
as
in Equation 3.11.
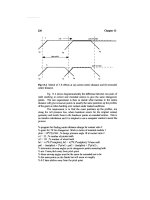
The effect of capillary repulsion, repelling metal
from entering thin sections, is clearly seen by the
positive intercept in Figure 3.14 for
a
medium alloy
steel and
a
stainless steel, in Figure 3.15 for an
aluminium alloy, in Figure 3.16 for cast iron and in
Figure 3.2
1
for a zinc alloy. Thus the effect appears
to be quite general,
as
would be expected. The
effective surface tension can be worked out in all
these cases from an equation such
as
3.14.
In
each
case it is found to be around twice the value to be
expected for the pure metal in a vacuum. Again,
this high effective value is to be expected
as
explained in section 3.1.1.
In larger round or square sections, where the
radii R and
r
both become large, in the range
of
10
to
20
mm, the effects of surface tension become
sufficiently small to be neglected for most purposes.
Large sections are therefore filled easily.
3.3.4.1 Some practical aspects
In the filling of many castings the sections to be
filled are not uniform; the standard complaint in
the foundry is ‘the sections are thick and thin’.
This does sometimes give its problems. This is
especially true where the sections become
so
thin
in places that they become difficult to fill because
of the resistance presented by surface tension.
Aerofoils on propellers and turbine blades are typical
examples.
To
investigate the filling of aerofoil sections that
are typical of many investment casting problem
shapes, an aerofoil test mould was devised
as
shown
in Figure 3.18. (This test mould also included some
tensile test pieces whose combined volume
interfered to some extent with the filling of the
aerofoil itself; in later work the tensile test pieces
Flow
89
1000
8oo-
E
600-
s-
ul
r
W
Q
-
'E
400-
5
200
0
600-8
I I
I
I I
I
I
I
t
t
It
i
I
i i
Casting temp.
"C
1570
1
o
1620
I
10
500
E
E
400
$
300
5
200
0
2
4
6
8
Strip thickness, mm
a
LM2511.5 mm
0
LM2512.5 mm
A
LM2513.5 mm
A
LM2516.5 mm
0
LM2516.5 mm
GR
+
A17Si/l.5 mm
A17Sil3.5 mm
+
A17SiI6.5 mm
-
3.5 mm
-
2.5 mm
-
-0
50
100
150 200
o
1520
100:
-
0
EO'L
,
, ,
,
,
, ,
,:
0
2
4
6
a
10
Strip thickness,
mm
Figure
3.14
(a)
Fluidity data.for a
low
alloy steel,
and
(b),for
a
stainless steel poured in
a
straight channel. ,furan
bonded
sand
mould (Boutorabi et al.
1990).
Figure
3.15
Fluidity
ofu
variety
of
AI-7Si and Al-7Si-O.4Mg alloys, one grain refined
GR,
yhowing linear behaviour with section thickness and casting temperature (Boutorabi et
ul.
1990).
were removed, giving considerably improved
reproducibility of the fluidity test.)
Typical results for
a
vacuum-cast nickel-based
superalloy are given in Figure
3.19
(Campbell and
Olliff
197
1).
Clearly, the
1.2
mm section fills more
fully than the
0.6
mm section. However, it is also
clear that at low casting temperature the filling
of
both sections is limited by the ability
of
the metal
to flow prior to freezing. At these low casting
temperatures the fluidity improves
as
temperature
increases,
as
expected.
However, above
a
metal casting temperature of
approximately 1500°C further increases of
temperature do not further improve the filling.
As
the metal attempts to enter the diminishing sections
of the mould, the geometry of the liquid front is
closely defined
as a
simple cylindrical surface. Thus
it is not difficult to calculate the thickness of the
mould at any point. Half of this thickness is taken
as
the radius of curvature of the liquid metal
meniscus (Figure
3.20).
It
is possible to predict,
therefore, that the degree of filling is dictated by
90
Castings
0
x,
1
234
5
6
7
8
910
Thicknesdmm
Figure
3.16
Fluiditj of
a
varietj
of
grey and ductile cast irons
showing linear behaviour with
section thickness and casting
temperature (Boutorabi et al.
I
990).
Figure 3.17
Fluidity results re-
7.5
alloys.
0
0
+I
2
3
4
5
6
7
presented from Figure
3.15
for
Al-
Section thickness
x
(mm)
Flow 91
0
5
\
i-
I-
P
-
/
7
Figure
3.18
Aerofoil fluidity test mould. The outlines of
the ca.st shape are computed for increasing values
of
yl
pgh,
units
in
rnillimetres (Campbell and Olliff
1971).
100
c
80
&
60
-
2
40
20
0
1
.z
8
Q
m
1
c
m
1.2
mm
I I
I
I
00
1400
1500
1600 1700
Casting
temperature
("C)
Figure
3.19
Results from the aerofoilfluidity test
(Campbell and Olliff
1971)
(lines denote theoretical
predictions; points are experimental data).
the local balance at every point around the perimeter
of
the meniscus between the filling pressure due to
i
L
I
i-
93
.
Figure
3.20
Geometry ofthe aerofoi1,fluidity test (Campbell
and Olliff
1971).
the metal head and the effective back pressure due
to the local curvature
of
the metal surface.
In
fact,
if momentarily overfilled because of the momentum
of
the metal as it flowed into the mould, the repulsion
effect of surface tension would cause the metal to
'bounce back', oscillating either side of its
equilibrium filling position, finally settling at its
balanced, equilibrium state of fullness.
The authors of this work emphasize the twin
aspects of filling such thin sections; flowability
limited by heat transfer, and fillability limited by
surface tension.
At low mould and/or metal temperatures, the
first type of filling, flowability, turns out to be simply
classical fluidity as we have discussed above.
Metallographic examination of the structures
of
aerofoils cast at lower temperatures showed
columnar grains grown at an angle into the direction
of flow, typical
of
solidification occurring while
the metal was flowing. The flow length was
controlled by solidification, and thus observed to
be
a
function of superheat and other thermal factors.
as we have seen.
92
Castings
The second type of filling, fillability, occurs at
higher mould and/or metal temperatures where the
heat content of the system is sufficiently high that
solidification is delayed until after filling has come
to a stop. Studies of the microstructure of the castings
confirm that the grains are large and randomly
oriented, as would be expected if the metal were
stationary during freezing. Filling is then controlled
by a mechanical balance of forces. The mode of
solidification and further increases of temperature
of the metal and the mould play no part in this
phase of filling.
In a fluidity test of simpler geometry consisting
of straight strips of various thickness, the linear
plots of fluidity
Lf
versus thickness
x
and superheat
ATs are illustrated in Figures 3.15 and 3.16 for Al-
7Si alloy and cast iron in sand moulds. It is easy to
combine these plots giving the resultant three-
dimensional pyramid plot shown in Figure 3.17.
The plot is based on the data for the A1 alloy in
Figure 3.15.
In
terms of the pressure head
h,
and
the intercepts
ATo
and
xo
defined on fluidity plots
3.15 and 3.16, the equation describing the slightly
skewed surface of the pyramid is
(3.15)
Where Cis a constant with dimensions of reciprocal
temperature. For the A1 alloy, Cis found from Figure
3.15 to have a value of about 1.3
f
0.1
K-I,
ATo
=
30
f
5,
y
=
2 Nm-' allowing for contribution of
oxide film to the surface tension,
p
=
2500 kgm-3,
g
=
10
msK2 and
h
=
0.10
m. We can then write an
explicit equation for fluidity (mm) in terms of
superheat (degrees Celsius) and section thickness
(mm):
Lf
=
C(ATs
+
ATO)(X
-
(2y/pgh))
Lf
=
1.3(ATs
+
30)(~
-
1.6)
For a superheat ATs
=
100°C and section thickness
x
=
2 mm we can achieve a flow distance
Z+
=
68
mm for AI-7Si in a sand mould. If the head
h
were
increased, fluidity would be higher, as indicated
by Equation 3.15 (but noting the limitations
discussed in section 3.3.2).
As we have seen, in these thin section moulds
both heat transfer and surface tension contribute to
limit the filling of the mould, their relative effects
differ in different circumstances. This action of
both effects causes the tests to be complicated, but,
as we have seen, not impossible to interpret. Further
practical examples of the simultaneous action of
heat transfer and surface tension will be considered
in the next section.
3.3.5
Comparison
of
fluidity tests
Kondic (1959) proposed the various thin section
cast strip tests (called here the Voya Kondic (VK)
strip test) as an alternative because it seemed to
him that the spiral test was subject to unacceptable
scatter (Betts and Kondic 1961).
For a proper interpretation of all types of strip
test results they need to be corrected for the back
pressure due to surface tension at the liquid front.
As we have seen, this effectively reduces the
available head pressure applied from the height of
the sprue. The resulting cast length will correspond
to that flow distance controlled by heat transfer,
appropriate to that effective head and that section
thickness. These results
are
worked through as an
example below.
Figure 3.21 shows the results by Sahoo and
Whiting (1984) on a Zn-27A1 alloy cast into strips,
17 mm wide, and of thickness 0.96, 1.27, 1.58 and
1.88 mm.
The results for the ZA27 alloy indicate that the
minimum strip thickness that can be entered by the
liquid metal using the pressure head available in
this test is 0.64
f
0.04 mm. Using Equation 3.14,
assuming that the metal head is close to 0.1 m,
R
=
17/2 mm and
r
=
0.64/2 mm, and liquid
density close to
5720
kgm-3, we obtain the surface
tension
y
=
1.90 Nm-I. (If the
R
=
17/2 curvature is
neglected, the surface tension then works out to be
1.98 Nm-' and therefore is negligibly different for
our purpose.) This is an interesting value, over
double that found for the surface tension of pure
Zn or pure Al. It almost certainly reflects the
presence of a strong oxide film.
It suggests that the liquid front was, briefly, held
up by surface tension at the entry to the thin sections,
so
that an oxide film was grown that assisted to
hold back the liquid even more. The delay is typical
of castings where the melt is given a choice of
routes, but all initially resisting entry,
so
that the
sprue and runner have to fill completely before
pressure is raised sufficiently to break through the
surface oxide. If the melt had arrived without
choices, and without any delay to pressurization,
the melt would probably have entered with a
resistance due only to surface tension. In such
a condition,
y
would be expected to have been
close to
1.0
Nm-'.
It suggests that, to be safe, values of at least
double the surface tension be adopted when allowing
for the possible loss
of
metal head in filling thin
section castings. This factor is discussed at greater
length in section 3.1.1.
The ability to extrapolate back to a thickness
that will not fill is a valuable feature of the VK
fluidity strip test. It allows the estimation of an
effective surface tension. This cannot be derived
from tests, such as the spiral test, that only use one
flow channel. The knowledge of the effective surface
tension is essential to allow the comparison of the
various fluidity tests that is suggested below.
The data from Figure 3.21 is cross-plotted in
Figure 3.22 at notional strip thickness of 1.0, 1.5
Flow
93
ZA
27
alloy.
Green
sand
VK
Strip test.
(1959)
200
I
Pouring
temp.
("C)
/
0
0
0.5 1
.o
1.5
Strip thicknesdmm.
and 2.0mm. (These rounded values are chosen
simply for convenience.) The individual lengths in
each section have been plotted separately, not added
together to give a total as originally suggested by
Kondic. (Totalling the individual lengths seems to
be a valid procedure, but does not seem to be helpful,
and simply adds to the problem of disentangling
the results.) Interestingly all the results extrapolate
back to a common value for zero fluidity at the
melting point for the alloy,
490°C.
This is a
surprising finding for this alloy. Most alloys
extrapolate to a finite fluidity at zero superheat
because the metal still takes time to give up its
latent heat, allowing the metal time to flow. The
apparent zero fluidity at the melting point in this
alloy requires further investigation.
Also shown in Figure 3.22 are fluidity spiral
results. An interesting point is that, despite his earlier
concerns,
I
am sure VK would have been reassured
that the percentage scatter in the data was not
significantly different to the percentage scatter in
the strip test results.
The further obvious result from Figure
3.22
shows how the fluidity length measurements of the
spiral are considerably higher than those of the
strip tests. In
a
qualitative way this is only to be
expected because
of
the great difference in the cross-
sections of the fluidity channels. We can go further,
though, and demonstrate the quantitative equivalence
of these results.
In Figure
3.23,
the spiral and strip results are all
reduced to the value that would have been obtained
if the spiral and the strip tests all had sections of
2 mm
x
17
mm.
Figure
3.21
Fluidity
of
ZA27
alloy cast in greensand
using the
VK
fluidity strip test
(2)
using data ,from
Sahoo and Whiting
(1984).
2.0
This is achieved by reducing the spiral results
by a factor
4.44
to allow for the effect of surface
tension and modulus, making the results equivalent
to those in the 2 mm thick cast strip. The
2
mm
section results remain unchanged of course. The
1.5
and
1.0
mm results are increased by factors
1.75
and 4.12 respectively. These adjustment factors
are derived below.
Taking Equation
3.1
(Equation
3.2
can be used
in its place, since we are to take ratios), together
with Equations
3.5
and
3.6,
and remembering that
the velocity is given approximately by
(2gH)'/*
then we have for sand moulds:
Lf
=
kmn( 2gH)
=
kmn(2g(~
-
(y/rpg)))"2
(3.16)
where
n
is
1
for interface controlled heat flow,
such as in metal dies and thin sand moulds, and
n
is 2 for mould control of heat flow, such as in thick
sand moulds.
Returning now to the comparison of fluidity tests,
then by taking a ratio of Equation
3.16
for two
tests numbered
1
and
2,
we obtain:
For the work carried out by Sahoo and Whiting on
both the spiral and strip tests, the ratio given in
Equation
3.17
applies as accurately as possible,
since the liquid metal and the moulds were the
same in each case. Assuming the moduli were
1.74
and
0.985
mm respectively, and the radii were
4
94
Castings
800
700
600
500
E
E
.g
40C
E
G
.
3
30C
20c
1
oc
C
Spiral
I
I
I
I
I
I
2.0
mm
'
I
I
Fluidity
/@
I
strips
I
I
I
I
/
I
/
I
I
I
I
A
1.0
mm
a/m-
500
550
Temp
"C
and 1 mm respectively,
y
=
1.9 Nm-'? and
p
=
5714
kgm-3, and the height of the sprue in each case
approximately 0.1 m, it follows
Lfl
=
{
[
0.1
-
0.00847
Lfz
0.895
0.1
-
0.0339
=
3.77
x
1.18
=
4.44
The calculation is interesting because it makes
clear that the largest contribution towards increased
fluidity
in
these thin section castings derives from
600
Figure
3.22
Results
of
Figure
3.21
replotted
to
show the effect
of
superheat explicitly, as
though from strips
of
section
thickness
1.0,
1.5
and
2.0
mm.
together with results
of
the
spiral fluidity test.
their modulus (i.e. their increased solidification
time). The effect of the surface tension is less
important in the case of the comparison of the spiral
with the 2 mm section.
If
the spiral of modulus
1.74 mm had been compared with a thin section
fluidity test piece of only
1
mm thick, then:
LfllLf2
=
13.6
X
1.68
=
9.25
Thus although the surface tension factor has risen
in importance from 1.18 to 1.68, the effect
of
freezing time is still completely dominant, rising
from 3.77 to 13.6.
The dominant effect of modulus over surface
Flow
95
200
a
._
L
-
v,
15C
E
E
cu
0
c
-
E
v
E
1oc
==.
-
._
0
-
LL
5c
0
Spiral lengthd4.44
0
2.0 Effective strip thickness
mm
A
1.5 Strip/0.572
0
1
.o
Strip/0.243
y8
14IIII
I
500 550 600
Temp.
("C)
tension appears to be a general phenomenon in
sand moulds as a result of the (usually) small effect
of
surface tension compared to the head height.
The accuracy with which the spiral data is seen
to fit the fluidity strip test results for the Zn-27A1
alloy when all are adjusted to the common section
thickness of 2 mm
x
17
mm (Figure 3.23) indicates
that, despite the arguments that have raged over
the years, both tests are in fact measuring the same
physical phenomenon, which we happen to call
fluidity, and both are in agreement.
9.97
AI
140
401
20
1
9 12 16
%
Si
Figure
3.23
Data from the spiral and strip
tests shown in Figure
9,
reduced by the
factors shown to simulate results as
though all the tests had been curried out
in a similar size mould,
of
section
2
mrn
x
17
mm.
All
results are seen to agree,
confirming the validity
of
the comparison.
3.4
Continuous fluidity
In a series of papers published in the early
1960s
Feliu introduced a concept
of
the volume of flow
through a section before flow was arrested. He
carried out this investigation on, among other
methods, a spiral test pattern, moulded in green
sand. He made a number
of
moulds, cutting a hole
through the drag by hand to shorten the spiral length,
and repeated this for several moulds at various
lengths. The metal that poured through the escape
I I
1
I
I
01
7io
Figure
3.24
Flow capacity
of
a
channel as a function
of
length qf the
channel (Feliu
1962)
100 200
300
400 500 600
Length of channel
(mm)
96
Castings
holes was collected in a crucible placed underneath
and weighed together with the length of the cast
spiral. As the flow distance was progressively
reduced, he discovered that at a critical flow distance
the metal would continue flowing indefinitely
(Figure 3.24). Clearly, any metal that had originally
solidified in the flow channel was subsequently
remelted by the continued passage of hot metal.
The conditions for remelting in the channel
so
as to allow continuous flow are illustrated in Figure
3.25. The concept is essential to the understanding
of running systems, whose narrow sections would
otherwise prematurely block with solidified metal.
It
is
also clearly important in those cases where a
casting is filled by running through a thin section
into more distant heavy sections.
Because of its importance,
I
have coined the
name ‘continuous fluidity length’ for this
measurement of a flow distance for which flow
can continue to take place indefinitely. It contrasts
with the normal fluidity concept, which, to be strict,
should perhaps be more accurately named as
‘maximum fluidity length’.
The results by Feliu shown in Figure 3.24 seem
typical. The maximum fluidity length has a finite
value at zero superheat. This
is
because the liquid
metal has latent heat, at least part of which has to
be lost into the mould before the metal ceases to
Figure
3.25
Concepts
of
(a) maximum jluidity length
showing the stages offreezing leading to the arrest
of
the
flow
in a
long
mould; and
(b)
the continuous flow that
can occur
if
the length of the mould does not exceed a
critical length, defined as the continuous fluidiry length.
flow. Continuous fluidity, on the other hand, has
zero value until the superheat rises to some critical
level. (Note that in Figures 3.26 to 3.28, the liquidus
temperature
T,
has been reduced from that of the
pure metal by
5
to 10°C to allow for the presence
of impurities).
Figures 3.26 to 3.28 display three zones: (i) a
zone in which the flow distance is sufficiently short,
and/or the temperature sufficiently high, that flow
continues indefinitely; (ii) a region between the
maximum and the continuous fluidity thresholds
where flow will occur for increasingly long periods
as distance decreases, or temperature rises; and
(iii) a zone in which the flow distance cannot be
achieved, bounded
on
its lower edge by the
maximum fluidity threshold.
Examining the implications of these three zones
in turn: Zone (iii) is the regime in which most
running systems operate; Zone (ii) is the regime in
many castings, particularly if they have thin walls;
Zone
(i)
is the regime of bitter experience of costly
redesigns, sometimes after all the budget has been
expended on the patternwork, and it is finally
acknowledged that the casting cannot be made.
Fluidity really can therefore be important to the
casting designer and the founder.
The author is aware of little other experimental
work relating to continuous fluidity. An example
worth quoting because of its rarity is that of Loper
and LeMahieu on white irons in greensand dating
from 1971. (Even
so,
the interested reader should
take care to note that freezing time is not measured
directly in this work.)
There is a nice computer simulation study carried
out at Aachen University (Sahm 1998) that confirms
the principles outlined here. More work
is
required
in this important but neglected field.
3.5
Glossary
of
symbols
tf
Tf
TO
V
Y
Km
Pm
PS
thickness of plate section casting
specific heat of mould
acceleration due to gravity
height, or heat transfer coefficient
latent heat of solidification
(maximum) fluidity length
modulus (volume/cooling surface area)
pressure
orthogonal radii of the liquid meniscus
freezing time
freezing temperature
initial mould temperature
velocity
surface tension
thermal conducivity of mould
density of mould
density of solid metal casting
Flow
97
8
A
Continuous flow
600
E
E
500
0
0
+
?A
2
E
E 400
X
m
m
.'
300
5
4
m
a,
2.
-
.g
200
3
a,
-
-
c
a,
=
100
w
0
600
E
E
2
500
E
E
N
400
.
c
0
a,
u)
T
X
m
m
K
2
300
5
m
K
2.
-
.=
200
-0
-
.,-
a,
0
=
W
c
a,
100
0
99.7
AI
Data from
6
x
12 test
AA
Data from
3
x
12 test
0
Data from 1.5
x
12 test
A
/
Figure
3.26
Maximum
and
continuous
jluidiry data
by
Feliu
{ 13)
,for
99.7A1
cast into greensand moulds
of
sections
6
x
12,
3
x
12
and
1.5
x
12
mm, all
reduced as
though
cast only
in
a section
3
x
12
mm.
AI
-
~CU
Data from
6
x
12 test
A
A
Data from
3
x
12 test
0
Data from 1.5
x
12 test
/
No
flow
A
Limited
flow
Tm
I
Figure
3.27
Data for
AlMCu
alloy
hq'
Feliu
(13)
recalculated as
though
onlv
from
section
3
x
12
mm.
98
Castings
600
E
E
._
5
500
.
c
0
8
E
E
400
X
c)
m
C
2
300
a
c
a,
x
U
-
c
._
‘5
200
-
-
a,
0
w
._
c
E
100
0
500
AI
12 Si
W
Data
from
6
x
12
test
AA
Data
from
3
x
12
test
0
Data
from
1.5
x
12
Tll
600
700
Temp.PC
Figure
3.28
Data for AI-12Si alloy
by Feliu (13) recalculated as though
only from section 3
x
12 mm.
800
Continuous
flow
Chapter
4
The
mould
When the molten metal enters the mould, the mould
reacts violently. Frenzied activity crowds into this
brief moment of the birth of the casting: buckling,
outgassing, pressurization, cracking, explosions,
disintegration and chemical attack. The survival of
a saleable casting is only guaranteed by the strenuous
efforts of the casting engineer to ensure that the
moulding and casting processes are appropriate,
and are under control.
Only those aspects of the interaction with the
mould are considered that introduce defects or
otherwise influence the material properties of the
casting. Those actions that result, for instance, in
the deformation of the casting are not treated here.
They will be considered in later volumes.
4.1
Inert
moulds
Very few moulds
are
really inert towards the material
being cast into them. However, some moulds are
very nearly
so.
This is especially true at lower
temperatures.
For instance, with the cast iron or steel
(permanent) mould used in the gravity die casting
or
low-pressure die casting
of
aluminium, the mould
is coated with an oxide wash. The metal and mould
are practically inert towards each other. Apart from
the normal oxidation of the surface of the casting
by the air, there are no significant chemical reactions.
This is a significant benefit of metal moulds that is
often overlooked. The die does suffer from thermal
fatigue, usually after thousands of casts. This limit
to
die life can be an important threat to surface
finish as the die ages, or occasionally results in
catastrophic failure, with disastrous effects on
production, because dies take time to replace. Such
failure is commonly associated with heavy sections
of the casting, such as a heavy boss on a plate. The
material of the die in this region suffers from
repeated transformation to austenite and back again.
The large volume change accompanying this reaction
corresponds to a massive plastic strain of several
per cent,
so
that the steel (or cast iron) suffers
thermal fatigue.
The usefulness of a relatively inert mould is
emphasized by the work of Stolarczyk
(1960),
who
measured approximately
0.5
per cent porosity in
gunmetal casting into steel-lined moulds, compared
with
3.5
per cent porosity for identical test bars
cast in greensand moulds.
Dies in pressure die casting are hardly inert,
partly because of the gradual dissolution of the
die, but mainly because of the overwhelming effect
of the evaporation of the die-dressing material. This
may be an oil- or water-based suspension of graphite
sprayed on to the surface of the die, and designed
to cool and lubricate the die between shots. The
gases found in pores in pressure die castings have
been found to be mainly products of decomposition
of the die lubrication, and the volume of gases
found trapped in the casting has been found to
correspond very nearly to the volume
of
the die
cavity.
A little-known problem is the boiling of residual
coolant trapped inside joints of the die. Thus as
liquid metal is introduced into the die the coolant,
especially if water-based, will boil. If there is no
route for the vapour to escape via the back
of
the
die, vapour may be forced into the liquid metal as
bubbles.
If
this happens it is likely that at least
some of these bubbles will be permanently trapped
as blowholes in the casting. This problem is expected
to be common to pressure die and squeeze casting
processes.
The recent approach to the separation
of
the
cooling of the pressure die casting die from its
lubrication is seen as a positive step toward solving
this problem. The approach is to use more effective
cooling by built-in cooling channels, whereas
100
Castings
lubrication is achieved by the application of minute
additions of waxes or other materials to the shot
sleeve.
For light alloys and lower-temperature casting
materials, investment moulds are largely inert.
Interestingly, dry sand moulds (i.e. greensand
moulds that have been dried in an oven) have been
found to be similar, as shown by Locke and
Ashbrook (1950).
Carbon-based and graphite dies have been found
useful for zinc alloys. However, their lives are short
for the casting of aluminium alloys because
of
the
degradation of the carbon by oxidation. Carbon-
based moulds are used for the casting of titanium
alloys in vacuum. Oxidation of the mould is thereby
reduced, but the contamination of the surface of
the titanium casting with carbon is severe, promoting
the formation of an outer layer
of
the alloy where
the alpha-phase is stabilized. This surface layer is
known in titanium castings as the alpha-case. It
usually has to be removed by machining or chemical
dissolution.
4.2
Aggregate
moulds
Sand moulds were almost always made with silica
sand, apart from a number of places in the world
where silica was unobtainable such as in some parts
of Scandinavia where olivine is used. Other
foundries have used chromite and zircon for their
useful physical properties. However, recently, the
problems with the traditional silica mould have
driven moves towards many different kinds of
particulate materials, some natural minerals and
some synthetic. Acknowledging this move from
silica sand it is appropriate
to
call particulate
moulding materials 'aggregates' rather than sands.
Even
so,
the terms will be seen to be somewhat
interchangeable. Both are used in this section.
In greensand or chemically bonded moulds the
chemical interactions increase in number and
severity with increasing temperature, as we can
appreciate if we work our way up the temperature
spectrum of casting alloys:
1.
Low-melting-point lead and zinc alloy liquids
generally cast at temperatures up to 500°C are
too cool to cause significant reactions.
2.
Magnesium and aluminium have casting
temperatures commonly up to 750°C. They react
with water vapour and various other organics to
produce the solid oxide skin and free hydrogen
that can diffuse into the melt. These reactions
continue for
some
time after solidification and
during cooling. This source
of
hydrogen is likely
to be important in growing pores that
are
located
just under the casting surface. We shall return to
the subject of the growth of subsurface porosity
later. Despite this reactivity at the surface of the
liquid metal, it is worth noting that the
temperature at which light alloys are cast does
not lead to extensive breakdown of the chemical
constituents of the mould, as is clear from Figures
4.1
and
4.2.
3. Copper-based melts up
to
1300°C take part in
several important reactions.
4.
Irons up to 1400°C and steels up to 1600°C are
especially reactive in many ways.
5.
Titanium and zirconium
in
the range
1600
to
1700°C are
so
reactive they are problematic to
cast into moulds
of
any type. Reactions with
most moulding materials cause the troublesome
alpha-case on titanium alloys, in which the alpha-
titanium phase is stabilized by interstitials
(oxygen and/or carbon) absorbed from the
breakdown of the mould.
0.6
-
*
0.5
E
E
-
0.4
c
._
-
-
0
2
0.3
d
a"
u)
c
0.2
.?,
0.1
__
Furan
Phenolic urethane
__._.
n
Cast iron
Steel
1
-_
Steel
1
2
3
Time from the beginning
of
casting (min)
Figure
4.1
Measured gas
evolution
rates
from
castings
of
aluminium,
iron,
and steel,
in
chemically bonded sand
moulds (Bates and
Monroe
1981).
The reactions occur with both the mould surface
itself and with the atmosphere formed
in
the mould
during filling with the hot metal. These are all dealt
with below.
4.2.1
Transformation
zones
The evaporation of water
in
greensand moulds has
been the subject of much research. Clearly, as the
hot metal heats the surface of the mould, the water
(and other volatiles) will be boiled off, migrating
away from the mould face, only to condense again
in the deeper, cooler parts of the mould.
As
the
heat continues to diffuse in, the water migrates
The
mould
101
difficult; it is in fact a zone, confirming the early
measurements by Berry
et
al.
(1959). This zone
gets particularly wet. The raised water content
usually greatly reduces the strength of greensand
moulds,
so
that mechanical failure is most
common in this zone.
4. The external zone where the temperature and
water content remain as yet unchanged.
h
c
loo[
Greensand
I!
Phenolic urethane
02
N2 H2
CO
COP
C,H,
0
Figure
4.2
Composition
of
mould gases (a) from
greensand (Chechulin
1965)
and (b)from phenolic
urethane (Bates and Monroe
1981).
further. Dry and wet zones travel through the mould
like weather systems in the atmosphere.
Looking at these in detail, four zones can be
distinguished, as shown in Figure 4.3:
1.
The dry zone, where the temperature
is
high
and all moisture has been evaporated from the
binder. It is noteworthy that this very high
temperature region will continue to retain a
relatively stagnant atmosphere composed of
nearly
100
per cent water vapour. However, of
course, some of this will be reacting at the casting
surface to produce oxide and free hydrogen.
2.
The vapour transport zone, essentially at a
uniform temperature of 100°C, and at a roughly
constant content of water, in which steam is
migrating away from the casting.
3.
The condensation zone, where the steam
recondenses. This zone was for many years the
subject of some controversy as to whether it
was a narrow zone or whether it was better
defined as a front. The definitive theoretical
model by Kubo and Pehlke (1986) has provided
an answer where direct measurement has proved
It is worth taking some space to describe the structure
of the dry sand zone.
When casting light alloys and other low-
temperature materials, the dry sand layer has little
discernible structure.
However, when casting steel it becomes
differentiated into various layers that have been
detailed from time to time (e.g. Polodurov 1965;
Owusu and Draper 1978). Counting the mould
coating as number zero, these are:
0.
Dressing layer of usually no more than
0.5
mm
thickness, and having a dark metallic lustre as a
result
of
its high content of metal oxides.
1.
Sinter cake zone, characterized by a dark brown
or black colour. It is mechanically strong, being
bonded with up to
20
per cent fayalite, the
reaction product of iron oxide and silica sand.
The remaining silica exists as shattered quartz
grains partially transformed to tridymite and
cristobalite, which is visible as glittering crystals
(explaining the origin of the name cristobalite).
This layer is largely absent when casting grey
iron at ordinary casting temperatures.
2.
Light-grey zone, with few cracked quartz grains
and little cristobalite. What iron oxides are present
are not alloyed with the silica grains. This zone
is only weakly bonded and disintegrates
on
touch.
3. Charred zone, of dark-grey colour, of
intermediate strength, containing unchanged
quartz grains but significant levels of iron oxide.
Polodurov speculates that this must have been
blown into position by mould gases.
The changes in form of the silica sand during heating
are complicated. An attempt to illustrate these
relations graphically is included in Figure
4.3.
This
complexity, and particularly the expansion
accompanying the phase change from alpha to beta
quartz, has prompted a number of foundries to
abandon silica sand in favour of more predictable
moulding aggregates. This move is expected
to
become more widespread in future.
4.2.2
Evaporation and condensation zones
As the heat diffuses from the solidifying casting
into the mould (Figure
4.4),
the transformation zones
migrate into the mould. We can follow the progress
102
Castings
1.5
h
c
3
1.0
tl
c
0.5
Q
0
v)
m
W
v
._
::o
I
-80%
I
-13%
-7%
I
w-
I
Mould
I
I
dressing
\\\\\\\\\\\\\\\
Light :Sinter: layer
Dark grey (charred)
;d
zone
(111)
'
zone ;zone
5
I
grey ;cake
,
,
\
:
(4
;(I)
2
1h
TT
Tridymite
I
of the advance
of
the zones by considering the
distance
d
that a particular isotherm reaches as a
function of time
t.
The solution to this simple one-
dimensional heat-flow problem is:
d
=
(Dt)1'2
(4.1)
where D is the coefficient of diffusion. In the case
of
the evaporation front, the isotherm of interest is
that at 100°C. We can see from Figures 4.4 and
4.5
that the value of
k
is close to
1
mm2
s-I.
This
means that the evaporation front at 1
s
has travelled
1 mm, at 100
s
has traveled 10 mm, and requires
10
000
s
(nearly three hours!) to travel
100
mm. It
is clear that the same is true for aluminium as well
as steel. (This is because we are considering a
phenomenon that relies only on the rate of heat
flow in the mould
-
the metal and its temperature
is not involved.)
For the condensation zone the corresponding
value
of
D is approximately
3
mm2
ss',
so
that the
position of the front at 1,
100
and
10
000
s
is 1.7,
17 and
170
mm respectively.
These figures
are
substantiated to within
10
or
20
per cent by the theoretical model by Tsai
et
al.
(1988). This work adds interesting details such as
that the rate
of
advance
of
the evaporation front
depends on the amount of water present in the mould,
higher water contents making slower progress. This
is to be expected, since more heat will be required
to move the front, and this extra heat will require
extra time to arrive. The extra ability of the mould
to absorb heat is also reflected in the faster cooling
rates of castings made in moulds with high water
content. Measurements of the thermal conductivity
of
various moulding sands by Yan
et
al.
(1989)
have confirmed that the apparent thermal
conductivity
of
the moisture-condensation zone is
about three or four times as great as that of the dry
sand zone.
An earlier computer model by Cappy
et
al.
(1974)
also indicates interesting data that would be difficult
to measure experimentally. They found that the
velocity of the vapour was in the range of
10-
100
mms-' over the conditions they investigated.
Their result for the composition and movement
of the zones is given in Figure
4.6.
Kubo and Pehlke
calculate flow rates of
20
mm-'. These authors go
on to show that moisture vaporizes not only at the
The
mould
103
40
0
p
G,
-1
/AI
alloy casting
1
2
3
4
5
Progress of heat from
flow
into the mould (mm'/s)
Jtlme(S'')
0
5 10
15
20
25
30
I
I
I'
I'
I
zone Vapour
transport
I
Ill
1
5
20 50
100
200
300
400 500
600
Time
(s)
Figure
4.5
Position
of
the vapour zones after the casting
of
uluminium in a greensand mould. Data from
Kubo
and
Pehlke
(1986).
evaporation front, but also in the transportation and
condensation zones. Even in the condensation zone
a proportion of the water vaporizes again at
temperatures below
100°C
(Figure
4.5).
The pressure
of
water vapour at the evaporation
front will only be slightly above atmospheric
pressure in a normal greensand mould. However,
because the pressure must be the same everywhere
in the region between the mould/metal interface
and the evaporation front, it follows that the dry
sand zone must contain practically
100
per cent
Figure
4.4
Temperature distribution in
a
greensand mould on casting an
aluminium alloy (Ruddle and Mincher
1949-50) and
u
steel (Chvorinov 1940).
10
20
30
40
50
Distance from mould face (mm)
_I
Figure
4.6
Water content
of
the vapour transport
ione
with time and position. Smoothed computed results
of
Cappy et al.
(1974).
water vapour. This is at first sight surprising.
However, a moment's reflection will show that there
is
no
paradox here. The water vapour is very dry
and hot, reaching close to the temperature
of
the
mould/metal interface.
At
such high temperatures
water vapour is highly oxidizing. There is no need
to invoke theories
of
additional mechanisms to get
oxygen to this point to oxidize the metal
-
there
is
already an abundance of highly oxidizing water
vapour present (the breakdown
of
the water vapour
also providing a high-hydrogen environment,
of
course, to enter the metal, and to increase the rate
of heat transfer in the dry sand zone).
Kubo and Pehlke
(1986)
confirm that gas in the
dry sand and transportation zones consists of nearly
100
per cent water vapour.
In
the condensation
104
Castings
zone the percentage of air increases, until it reaches
100 per cent air in the external zone.
It is found that similar evaporation and
condensation zones are present for other volatiles
in the greensand mould mixture. Marek and Keskar
(1968) have measured the movement of the vapour
transport zone for benzene and xylene. The
evaporation and condensation fronts of these more
volatile materials travel somewhat faster than those
of water. When such additional volatiles are present
they will, of course, contribute to the
1
atm of gas
pressure in the dry zone, helping to dilute the
oxidizing effect of water vapour, and helping to
explain part of the beneficial effect of such additives.
In the following section we will see how many
organics decompose at these high temperatures,
providing a deposit of carbon, which further assists,
in the case of such metals as cast iron, in preventing
oxidation and providing a non-wetting mould surface
of sand grains that have been coated with carbon.
It is to be expected that vapour transport zones
will also be present to various degrees in chemically
bonded sands. The zones will be expected to have
traces of water mixed with other volatiles such
as
organic solvents. Little work appears to have been
carried out for such binder systems,
so
it is not
easy to conclude how important the effects are, if
any. In general, however, the volatiles in such dry
sand systems usually total less than 10 per cent of
the total volatiles in greensand,
so
that the associated
condensation zones will be expected to be less than
one-tenth of those occurring in greensand. It may
be, therefore, that they will be unimportant.
However, at the time of writing we cannot be sure.
It would be nice to know.
All of the above considerations on the rate of
advance of the moisture assume no other flows of
gases through the mould. This is probably fairly
accurate in the case of the drag mould, where the
flow of the liquid metal over the surface of the
mould effectively seals the surface against any
further ingress of gases.
A
certain amount of
convection is expected in the mould, but this will
probably not affect the conditions in the drag
significantly.
In the vertical walls of the mould, however,
convection may be significant. Close to the hot
metal, hot gases are likely to diffuse upwards and
out of the top of the mould, their place being taken
by cold air being drawn in from the surroundings
at the base of the mould, or the outer regions of the
cope.
General conditions in the cope, however, are
likely to be more complicated.
It
was Hofmann in
1962 who first emphasized the different conditions
experienced during the heating up and outgassing
of the cope. He pointed out that the radiated heat
from the rising melt would cause the cope surface
of the mould to start to dry out before the moment
of contact with the melt. During this pre-contact
period two different situations can arise:
1.
If the mould is open, as the cope surface heats
up the water vapour can easily escape through
the mould cavity and out via the opening (Figure
4.7).
The rush of water vapour through
an
open
feeder can easily be demonstrated by holding a
piece of cold metal above the opening. It quickly
becomes covered with condensate. The water
vapour starts its life at a temperature of only
100°C. It is therefore
a
relatively cool gas, and
is thus most effective in cooling the surface of
the mould as it travels out through the surface
of
the cope on its escape route.
2.
If the mould is closed, the situation is quite
different. The air being displaced and expanded
by the melt will force its way through the mould,
carrying away the vapour from the interface
(Figure
4.7).
The rate of flow of air is typically
in the range 10-100
1-'
m-' (the reader is
encouraged
to
confirm this for typical castings
and casting rates). This is in the same range of
flow rate as the transport of vapour given in
computer models. Thus if the casting rate is
relatively low, then the vapour transport zone is
likely to be relatively unaffected, although
perhaps a little accelerated in its progress. When
the casting rate is relatively high, then the vapour
transport zone will be effectively blown away,
diluted with the gale of air
so
that no condensation
can occur. Because the water vapour is driven
Open
mould
cavity
Closed
mould
cavity (c)
Figure
4.7
Three conditions of vapour transport in
moulds: (a) free evaporation from the cope;
(b)
evaporation
from
the cope confined by the enclosed
mould cavity: and (c) evaporation from the drag confined
by
the cover
of
liquid metal (Hofmann
1962).
The
mould
105
Williams (1970) described an experiment that
demonstrated this effect. He took a sample of clay
approximately
50
mm long in a standard
25
mm
diameter sand sampling tube. When one end was
heated to 1000°C and the other was at room
temperature, he measured a pressure difference of
10
mmHg if one end was closed, or a flow rate of
20
ml per minute if both ends were open. If these
results are typical of those that we might expect in
a sand mould, then we can make a comparison as
follows. The rate of thermal transpiration is easily
shown to convert to
0.53
1-'
m-* for the conditions
of temperature gradient and thickness of sample
used in the experiment. From the model of Cappy
et
al.
(1974), we obtain an estimate of the rate of
transport of vapour of 100
I-'
m-2 at approximately
this same temperature gradient through a similar
thickness of mould. Thus thermal transpiration is
seen to be less than
1
per cent of the rate of vapour
transport. Additional flows like the rate of volume
displacement during casting, and the rate of thermal
convection in the mould, will further help to swamp
thermal transpiration.
Thermal transpiration does seem to be a small
contributor to gas flow in moulds. It is possible
that it may be more important in other circumstances.
More work is required to reinstate it to its proper
place, or lay it to rest as an interesting but
unimportant detail.
away from the surface and into the interior of
the mould, its beneficial cooling effect at the
surface is not felt, with the result that the surface
reaches much higher temperatures, as is seen in
Figure
4.8.
The prospect of the failure of the
cope surface by expansion and spalling of the
sand is therefore much enhanced.
1000
1
p=b54
12
01
I
I I I
I
I
0
1
234
56
Time (min)
Figure
4.8
Temperature in the cope surface seen to
be
signijcantly lowered
by
open moulds and
high
moisture
levels. Data
,from
Hofmann
(1962).
However, the rate of heating of the surface by
radiation from the melt, particularly for iron and
steel castings, can be reduced by a white mould
coat, such as a zircon- or alumina-based mould
wash. This is a useful technique that is now widely
applied for large castings of iron and steel.
One final aspect of vapour transport in the mould
is worth a note. There has been much discussion
over the years about the contribution of the thermal
transpiration effect to the flow of gases in moulds.
Although it appears to have been widely disputed,
the effect is certainly real. It follows from the kinetic
theory of gases, and essentially is the effect of heated
gases diffusing away from the source of heat,
allowing cooler gases to diffuse up the temperature
gradient. In this way it has been argued that oxygen
from the air can arrive continuously at the casting
to oxidize the surface to a greater degree than would
normally have been expected.
4.3
Mould
atmosphere
On the arrival of the hot metal in the mould, a rich
soup of gases boils from the surface
of
the mould
and the cores. The air originally present in the cavity
dilutes the first gases given off. This is quickly
expelled through vents or feeders, or may diffuse
out through the cope. Subsequently, the composition
of the mould gas is relatively constant.
In the case of steel being cast into greensand
moulds, the mould gas mixture has been found to
contain up to
50
per cent hydrogen (Figure
4.2).
The content of hydrogen depends almost exactly
on the percentage water in the sand binder.
(Dry
sand moulds have practically no hydrogen.) Other
changes brought about by increased moisture in
the sand were a decrease in oxygen, an increase in
the CO/C02 ratio, and the appearance of a few per
cent of paraffins. The presence of cereals in the
binder was found to provide some oxygen, even
though the concentration of oxygen in the
atmosphere fell because
of
dilution with other gases
(Locke and Ashbrook 1950). Chechulin (1965)
describes the results for greensand when aluminium
alloys, cast irons and steels are cast into them. His
results are given in Figure 4.2a. Irons and steels
produce rather similar mould atmospheres,
so
only
his results for steel are presented.
106
Castings
The high oxygen and nitrogen content of the
atmosphere in the case of moulds filled with
aluminium simply reflects the high component of
residual air (originally, of course, at approximately
20 per cent oxygen and
80
per cent nitrogen). The
low temperature of the incoming metal is insufficient
to generate enough gas and expand it to drive out
the original atmosphere. This effective replacement
of the atmosphere is only achieved in the case of
iron and steel castings.
The atmosphere generated when ferrous alloys
are cast into chemically bonded sand moulds is,
perhaps rather surprisingly, not
so
different from
that generated in the case of greensand (Figure
4.2b). The mixture consists mainly of hydrogen
and carbon monoxide.
The kinetics of gas evolution were studied by
Scott and Bates
(1975),
who found that hydrogen
evolution peaked within 4 to
5
minutes for most
chemical binders. However, for the sodium silicate
binder
a
rapid burst of hydrogen was observed,
which peaked in less than
1
minute.
Lost-foam casting, where the mould cavity is
filled with polystyrene foam (the ‘full mould’
process), is a special case. Here it is the foam that
is the source of gases
as
it is vaporized by the
molten metal. At aluminium casting temperatures
the polymerized styrene merely breaks down into
styrene, but little else happens,
as
is seen in Figure
4.9.
It
seems that the liquid styrene soaks into the
ceramic surface coating on the foam,
so
that the
permeability of the coating will temporarily fall to
zero. This unhelpful behaviour probably accounts
for many of the problems suffered by aluminium
alloy castings made by the lost-foam process.
At the casting temperatures appropriate for cast
iron, more complete breakdown occurs, with the
generation of hydrogen and methane gases, and
considerable quantities of free carbon. The carbon
deposits on the advancing metal front, possibly as
-
c
c
0
g
100
5
2
-
c
0
U
Q
c
0
D
CD
a,
D
._
5
50-
s
-
C
3
0
E
a
o
carbon black, but quickly transforms into graphite.
It is possible that the carbon may deposit directly
in the form of graphite. However it may occur, the
deposit is widely known as ‘lustrous carbon’. Once
formed, the layer is rather stable at iron-casting
temperatures, and can therefore lead to serious
defects if entrained in the metal. The problem has
impeded the successful introduction of this
technology on
a
wider scale. For steel casting the
temperature is sufficiently high to cause the carbon
to
be taken into solution. Steel castings of low or
intermediate carbon content are therefore
contaminated by pockets of high-carbon alloy. This
problem has prevented lost-foam technology in the
form of the full mould process being used for low-
and medium-carbon steel castings.
Lost-foam iron castings are not the only type of
ferrous castings to suffer from lustrous-carbon
defects. The defect is also experienced in cast iron
made in phenolic urethane-bonded moulds, and at
times can be a serious headache. The absence of
carbon is therefore a regrettable omission from the
work reported in Figure 4.2. At the time Chechulin
carried out this study, the problem would not have
been known.
It seems reasonable to expect that carbon may
also be produced from the pyrolysis (meaning the
decomposition by heat in the absence of oxygen,
in contrast to burning, which is the decomposition
by high temperature oxidation) of other binder
systems. More work is required to check this
important point.
Total
gas/,,
,
./
-
1000
-
/*
,
/
/
/
-
ol
/
I
2
v
Styrene
4.3.1 Outgassing
pressure
The sudden heat from the liquid metal causes the
volatile materials in the mould to evaporate fiercely.
In greensand moulds and many other binder systems
the main component of this volatilization is water.
Even in so-called dry-binder systems there is usually
500
1000
1500
Figure
4.9
Products
of
decomposition
of
expanded polystyrene (Goria et al.
1986).
Temperature
(“C)
The
mould
107
apparent volume of gases, and thereby invalidating
the experimental results.) The really important
quantity given by these curves is the
rate
of evolution
of
gas. The rates, of course, are equal to the slope
of
the curves in Figure 4.10, and are presented in
Figure 4.11. Only a few results are presented for
clarity. It is sufficient to note that the rates of
outgassing are very different for different chemical
systems.
enough water to constitute a major contribution to
the total volume of liberated gas. On contact with
the hot metal, much of the water is decomposed to
hydrogen as is seen in the high hydrogen contents
of analysed mould gases (Scott and Bates 1975).
In the case
of
the mould, the generation
of
copious
volumes of gas is usually not a problem. The gas
has plenty of opportunity to diffuse away through
the bulk of the mould. The pressure build-up in a
greensand cavity during mould filling is normally
only of the order of 100mm water gauge (0.01
atm) according to measurements by Locke and
Ashbrook (1972). This corresponds to merely
10
mm or
so
head pressure of liquid iron or steel.
However, even this rather modest pressure might
be unusually high because their experimental
arrangement corresponded to a closely fitting steel
moulding box, and escape for mould gases only
via the cope. Even
so,
in greensand systems where
the percentage of fines and clay and other
constituents is high, the permeability of the mould
falls to levels at which the ability of the mould
volatiles to escape becomes a source of concern.
The venting of the mould by needling with wires is
a time-honoured method of reintroducing some
permeability.
Chemically bonded moulds are usually of no
concern from the point of view of generating a
back pressure during the filling of the mould. This
is because the sand is usually bought in as ready
washed, cleaned and graded into closely similar
sizes (a 'three pan sand'). In addition, only a few
volume per cent of binder is used, leaving an open,
highly permeable bonded mould.
A
single
measurement by the author using a water manometer
showed a pressure rise during the filling of a cylinder
head mould
of
less than 1 mm water gauge. Even
this negligible rise seemed to decay to nothing within
a second or
so.
In the case of cores, however, once the core is
covered by liquid metal, the escape of the core
gases is limited to the area of the core prints, if the
metal is not to be damaged by the passage of bubbles
through it. Furthermore, the rate of heating of the
core is often greater than that of the mould because
it is usually surrounded on several sides by hot
metal, and the volume
of
the core is, of course,
much less. All these factors contribute to the internal
pressure within the core rising rapidly to high values.
Many authors have attempted to provide solutions
to the pressure generated within cores. However,
there has until recently been no agreed method for
monitoring the rate or quantity of evolved gases
that corresponds with any accuracy to the conditions
of
casting. A result of one method by Naro and
Pelfrey (1983) is shown in Figure 4.10. (This method
is an improvement on earlier methods in which the
water and other volatiles would condense in the
pipework of the measuring apparatus, reducing the
-
Self-set systems
____
Vapour catalysed
Heat cured
'F
0
60
120
180
240
Time
(s)
Figure
4.10
Gas evolution from various binder system\
using an improved test procedure thut includes the
contribution from water and other volatiles (Naro and
Pelfrey
1983).
Taking this recent method of estimating
Q,
the
rate of volume of gas generated from a given weight
of core in ml
-I
s-'
(or preferably the identical-
sized unit Lkg-
s
')
as being of tolerable relevance
to the real situation in castings, we can construct a
core outgassing model. We shall roughly follow
the method originally pioneered by Worman and
Nieman (1973).
We first need to define the concept of
permeability. This is a measure
of
the ease with
which a fluid (the mould gas in our case) can flow
through a porous material. Permeability
P,
is
defined
as the rate
of
gas flow
Q
(as a volume per unit
time) through a permeable material
of
area
A
and
5-
108
Castings
~
Self-set
____
Vapour catalysed
Heat cured
v)
Y
1
(!
3
m
Silicate
ester
c
C
!
!
core
!:I
-
L
c
0
2
i!
I.
!
\oil
0
a,
m
[r
c
\.
\.
'
I
60
120
180
240
Time
(s)
Figure
4.11
Rates of gas evolution from various sand
binders based on the slopes of the curves shown in
Figure
2.21.
length
L
and driven by a pressure difference
AP:
P,
=
QL/A AP
The
SI
units of
P,
are quickly seen to be:
[P,
units]
=
[litrets] [ml/[m*][~al
=
1
s-1
m-1 Pa-'
Consider now our simple model of a core shown in
Figure
4.12.
The measured volume
of
gas evolved
Molten metal
Mould
Area
Ac
Figure
4.12
Core model, showing heated layer thickness
d
outgassing via its print. (In this particular case, metal
flash along the sides
of
the print forces gas to exit only
from the end area
A,)
per second from a kilogram of core material is
Q.
If we allow for the fact that this will have been
measured at temperature
TI,
usually above
100°C
(373
K)
to avoid condensation of moisture, and the
temperature in the core at the point of generation
is
T2,
then the volume of gas produced in the core
is
actually
QT2/T1
where
T
is measured in
K.
For
the casting of light alloys the temperature ratio
T2
IT,
(in
K
remember) is about
3,
whereas for
steels it is nearly
6.
If we multiply this by the weight of sand heated
by the liquid metal, then we obtain the total volume
of gas evolved per second from the core. Thus if
the heated layer is depth
d,
the core area
A,
and
density
p,
then the volume of gas evolved per second
is
QdA,pT2/Tl.
If the core is surrounded by hot
metal, this volume of gas has to diffuse to the print
and force its way through the length
L
of the print
of
area
Ap.
We shall assume that the pressure drop
experienced by the gas in diffusing through the
bulk of the core is negligible in comparison with
the difficulty of diffusing through the print.
Considering then the permeability definition only
for the pressure drop along the print, we obtain the
pressure in the core (above the ambient pressure at
the outside tip of the print):
(4.2)
P
=
QdA,
p
.
LT2 IApTIP,
This simple model emphasizes the direct role of
permeability
P,
and of
Q,
the rate of gas evolution.
It is to be noted that the high casting temperature
for steels is seen in Figure
4.1
to result in values
for
Q
approximately twice those for aluminium
alloys. Thus cores in steel castings will be twice as
likely to create blows than cores in aluminium alloy
castings. For this reason,
an
enclosed core that would
give no problems in an aluminium alloy casting
may cause blows when the same pattern is used to
make an equivalent bronze or iron casting.
Our model also highlights the various geometrical
factors of importance. In particular, the area ratio
of the core and the print,
Ac/Ap,
is a powerful
multiplier effect, and might multiply the pressure
by anything between
10
and
100
times for different
core shapes. Also emphasized is the length
L
of
the
core print. If the print is a poor fit then
L
may be
unnecessarily lengthened by the flashing of the metal
into the print
so
as to enclose the flow path in an
even longer tunnel. If the liquid metal completely
surrounds the end of the print too, then, of course,
all venting of gases is prevented. Gases
are
then
forced to escape through the molten metal, with
consequential bubble damage to the casting.
The important practical conclusions for good
core design to be drawn from the model are:
1.
High permeability.
2.
Core sand binder with low volatile content and/
or low rate of gas evolution.
The
mould
IO9
the metal, and the production of internal surfaces
of the casting that are unacceptably rough.
These cores are bonded with a chemical binder
that is cured by heat or chemical reaction to produce
a rigid, easily handled shape. The numerous different
systems in use all have different responses to the
heat of the casting process, and produce gases of
different kinds, in different amounts, at different
times, and at different rates (Figures 4.10 and 4.1
1
).
For instance, the silicate ester produces most of its
gas early, whereas the core oil shows a rapid but
limited early evolution, and then a considerable
delay before a second, more severe outgassing. These
results are not to be taken as absolute in any sense.
The manufacturers’ products are changing all the
time for a variety of reasons: health and safety;
economics; commercial; changes in world markets
and supplies
of
raw materials, etc. Thus binder
formulations change and new systems are being
developed all the time.
At
present the phenolic
isocyanate-urethane systems are among the lowest
overall producers of volatiles, which explains their
current wide use as intricate cores, for instance in
the case of water jackets for automobile cylinder
heads and blocks.
Part of the reason for the historical success
enjoyed by the phenolic urethane binders is their
high strength, which means that the addition levels
needed to achieve an easily handled core are low.
This is one of the important factors in explaining
their position near the bottom of Figure 4.10; the
volume of gas evolved is, of course, proportional
to the amount of binder present. This self-evident
fact is clearly substantiated in the work of Scott
et
al.
(1978),
shown in Figure 4.13. (If allowance is
made for the fact that these workers used a core
sample size of
150
ml, corresponding to a weight
of approximately
225
g, then the rate of evolution
3.
Large area prints.
4.
Good fit of prints.
The provision of a vent such as a drilled hole along
the length of the print will effectively reduce
L
to
zero; the model predicts that the internal pressure
in the core will then be eliminated (the only
remaining pressure will, of course, be that to
overcome the resistance to flow through the core
itself). The value of vents in reducing blowing from
cores has been emphasized by many workers. Caine
and Toepke (1966), in particular, estimate that a
vent will reduce the pressure inside a core by a
large factor, perhaps
5
or
10.
This is an important
effect, easily outweighing all other methods of
reducing outgassing pressure in cores.
Vents can be moulded into the core, formed from
waxed string. The core is heated to melt out the
wax, and the string can then be withdrawn prior to
casting. This traditional practice was often
questioned as possibly being counterproductive,
because of the extra volatiles from the wax that,
on
melting, soaks into the core. Such fears are seen to
be happily unfounded. The technique is completely
satisfactory because the presence of the vent
completely overrides the effect of the extra volatile
content of the core.
A
final prediction from the model is the effect
of temperature. In theory a lowering of the casting
temperature will lower the internal core pressure.
However, this is quickly seen to be a negligible
effect within the normal practical limits of casting
temperatures. For instance, a large change of
100
K
in the casting temperature of an aluminium alloy
will change the pressure by a factor of approximately
100/900. This is only
11
per cent. For irons and
steels the effect is smaller still. It can therefore be
abandoned as a useful control measure.
We shall now move on to some further general
points.
Cores are almost never made from greensand
because the volatile content (particularly water, of
course) is
too
high and the permeability
is
too low.
In addition, the cores would be weak and unable to
support themselves on small prints; they would
simply sag. If greensand is used at all then it is
usually dried in an oven, producing ‘dry sand’ cores
(their name should be more accurately ‘dried sand’
cores). These are relatively free of volatiles, and
are mechanically strong, but retain the poor
permeability of the original greensand. They
therefore usually require additional venting. This
is usually time consuming and labour intensive.
Sand cores are therefore nowadays generally
made from clean, washed and dried silica sand that
is closely graded in size to maintain as high a level
of permeability as
is
possible. The limit to the size
of sand grains and the permeability is set by the
requirements of the casting to avoid penetration by
0.15r
0
1
2
3
4
Loss
of
ignition
(COI)
(per cent)
Figure
4.13
Increase in the peak rate
qf
outgussing
(IS
loss
on ignition
(LOI)
increuses. Data recalculated~frotn
Scott et
al.
(1978).
110
Castings
measurements converted to
1.
kg-’
s-l
agree closely
with those presented in Figure 4.11. This is despite
the significant differences in the techniques. The
data in Figure 4.11 may therefore be of more
universal application than is apparent at first sight.)
4.3.2
Mould
gas
explosions
The various reactions of the molten metal with the
volatile constituents of the mould, particularly the
water in many moulding materials, would lead to
explosive reactions if it were not for the fact that
the reactions are dampened by the presence of
masses of sand. Thus although the reactions in the
mould are fierce, and not to be underestimated, in
general they are not of explosive violence because
the
90
per cent or more of the materials involved
are inert (simply sand and possibly clay) and have
considerable thermal inertia. Outgassing reactions
are therefore rather steady and sustained.
These considerations do not apply to the mould
cavity itself.
In the mould cavity the gases from the outgassing
of the mould may contain a number of potentially
flammable or explosive gases. These include a
number of vapours such as hydrocarbons such as
methane, other organics such as alcohols, and a
number of reaction products such as hydrogen and
carbon monoxide.
Because of the presence of these gases,
explosions sometimes occur and sometimes not.
The reasons have never been properly investigated.
This is an unsatisfactory situation because the
explosion of a mould during casting can be a nasty
event. The author has witnessed this in furan-bonded
boxless moulds when casting an aluminium alloy
casting weighing over
50
kg: there was a muffled
explosion, and large parts of the sand mould together
with liquid metal flew apart in all directions. After
several repeat performances the casters developed
ways of pouring this component at the end of long-
handled ladles,
so
as to keep as far away as possible.
The cause always remained a mystery. Everyone
was relieved when the job came to an end.
Explosions in and around moulds containing iron
or steel castings are relatively common. One of the
most common is from under the mould, between
the mould and its base plate, after the casting has
solidified,
so
that there is less danger either to
personnel or casting.
With subsequent experience, and in the absence
of any other suggestions, the following is suggested
as a possible cause of the problem in the case
of
the light alloy casting.
Explosions can, of course, only happen when
the flammable components of the gas mix with an
oxidizing component such
as
oxygen from the air.
The mixing has to be efficient, which suggests that
turbulence is important.
Also,
the mix often has to
be within close compositional limits, otherwise
either no reaction occurs, or only slow burning
takes place. The limits for the carbon monoxide,
oxygen and inert (carbon dioxide and nitrogen)
gas mixtures are shown in Figure 4.14.
100%
CO2
+
N2
4%
Figure
4.14
Shaded region defines
the
explosive regime
for
carbon monoxide, oxygen and a mixture
of
carbon
dioxide and nitrogen (Ellison and Wechselblatt
1966).
In the author’s experience, the mixing with air,
which is essential for explosions, only occurs in
moulds in certain conditions. These are moulds
that are (i) open to air because of open feeder heads,
or (ii) poured with oversize spmes that allow the
ingress of air, or (iii) the use of double pouring,
using two sprues, where the start of pour is not
easy to synchronize, with the result that air is taken
down one sprue at the time that metal enters down
the other. Thus eliminating open feeders by the use
either of blind feeders or chills promises to be a
useful step. The provision of a properly calculated
single sprue should also help.
‘What happens to the air already in the mould?’
is the next question. In a single-sprue system filling
quiescently from the bottom upwards, the outgassing
of
the mould and cores will provide a spreading
blanket of gas over the liquid. There will be almost
no air in this cover,
so
that no burning or explosion
can occur. The air will be displaced ahead, and
will diffuse out of the upper parts of the mould.
Where the flammable gas blanket meets the air it
is expected to be cool, well away from the liquid
metal. Thus any slight mixture that will occur at
the interface between these layers
of
gases is not
likely to ignite to cause an explosion.
In the case of the casting poured from two sprues,
the second stream of metal might arrive to spark
the spreading front
of
gases from the first stream.
The
mould
I
II
necessary to prevent penetration of the metal into
the mould.
However, in the case of grey iron cast in
a
mould
rich in hydrocarbons (i.e. greensand with heavy
additions of coal dust, or certain resin-bonded sands)
metal penetration is prevented when the
hydrocarbons
in
the atmosphere of the mould
decompose on the surface of the hot liquid metal
to deposit
a
film of solid carbon on the liquid.
Thus the reason for the robust non-wetting behaviour
is that
a
solid carbon film on the liquid contacts a
solid carbon layer at the mould surface. This twin
aspect of non-wettability is considered further below.
For the casting of iron, powdered coal additions,
or coal substitutes, are usually added to greensands,
to improve surface finish in this way, providing a
carbon layer to both the sand grains and the liquid
surface. The reactions in the pyrolysis of coal were
originally described by Kolorz and Lohborg
(
1963):
In the case of an open feeder, the cold downdraught
of fresh air into the mould is likely to penetrate
and mix with the flammable blanket, and be
sufficiently close to the molten metal to be ignited.
A
poorly designed turbulent filling system will undo
all the good described above. The splashing of hot
droplets and jets of metal through the vapour blanket,
mixing it with the air, will give ideal conditions to
spark an explosion.
That the event occurs from time to time in a
random manner is to be expected. It is partly as a
result of the randomness introduced by the turbulent
mixing, and partly the sensitivity of the composition
of the mixture, since Figure
4.14
confirms that only
a
limited compositional range is explosive.
4.4
Mould
surface reactions
4.4.1
Pyrolysis
When the metal has filled the mould the mould
becomes hot.
A
common misconception is to assume
that the sand binder then burns. However, this is
not true. It simply becomes hot. There is
no
oxygen
to allow burning. What little oxygen is available is
quickly consumed in
a
minor transient burning
reaction. However, this quickly comes to a stop.
What happens then to the binder is not burning,
but pyrolysis.
Pyrolysis is the decomposition of compounds,
usually organic compounds, simply by the action
of heat. Oxygen is absent,
so
that no burning (i.e.
high temperature oxidation) takes place. Pyrolysis
of various kinds of organic binder components to
produce carbon is one of the more important
reactions that take place in the mould surface. This
is because carbon is poorly wetted by many liquid
metals. Thus the formation of carbon on the grains
of sand,
as
a
pyrolysed residue of the sand binder,
produces a non-wetted mould surface,
so
assisting
to create an improved surface finish to the casting
(although, as will become clear, the effect of the
surface film on the melt is probably more important).
This non-wetting feature of residual carbon on
sand grains is at first sight curious, since carbon is
soluble in many metals, and
so
should react and
should therefore wet. Cast iron would be a prime
candidate for this behaviour. Why does this not
happen?
In the case of ductile iron, sand cores do not
need a core coat, since the solid magnesium oxide-
rich film on the surface is a mechanical barrier that
prevents penetration
of
the metal into the sand.
In the case of grey cast iron in a greensand mould
the atmosphere may be oxidizing, causing the melt
surface to grow a film of liquid silicate. This is
highly wetting to sand grains,
so
that the application
of
a
core coating such as a refractory wash may be
1.
The volatiles are driven out of the coal
to
form
a
reducing atmosphere.
2. Gaseous hydrocarbons break down on the surface
of the liquid metal. (Kolorz and Lohborg
originally thought the hydrocarbons broke down
on the sand grains to form a thin skin of graphite,
but this is now almost certain to be not true.)
3. The coal swells and on account of its large
expansion is driven into the pores of the sand.
This plastic phase of the coal addition appears
to plasticize the binder temporarily and thereby
eases the problems associated with the expansion
of the sand, allowing its expansion
to
be
accommodated without the fracture of the surface.
As
the temperature increases further and the final
volatiles are lost, the mass becomes rigid,
converting to a semi-coke. The liquid metal is
prevented from contacting and penetrating the
sand by this in-filling of carbon, which acts
as
a
non-wetted mechanical barrier.
Kolorz and Lohborg recommend synthetically
formulated coal dusts with a high tendency to form
anthracitic carbon, of good coking capacity and
with good softening properties. They recommend
that the volatile content be near 30 per cent, and
sulphur less than
0.8
per cent if
no
sulphur
contamination of the surface is allowable. If some
slight sulphurization is permissible, then
1
.O-1.2
per cent sulphur could be allowed.
In the case of phenolic urethane and similar
organic chemical binders based on resin systems,
the thermal breakdown of the binder assists the
formation of a good surface finish to cast irons and
other metals largely in the manner described above.
The binder usually goes through its plastic stage
prior to rigidizing into
a
coke-like layer. The much
smaller volume fraction of binder, however, does
not provide for the swelling of the organic phase
to
112
Castings
seal the pores between grains.
So,
in principle, the
sand remains vulnerable to penetration by the liquid
metal. The second aspect of non-wettability is
discussed below.
4.4.2
Lustrous carbon film
The carbonaceous gases evolved from the binder
complete their breakdown at the surface of the
advancing front of liquid metal, giving up carbon
and hydrogen to the advancing liquid front. For
steel, the carbon dissolves quickly and usually causes
relatively little problem. For cast iron, the carbon
dissolves hardly at all, because the temperature is
lower and the metal is already nearly saturated with
carbon. Thus the carbon accumulates on the surface
as a film, taking time to dissolve in the iron. The
time for dissolution seems to be about the same as
the time for mould filling and solidification. Thus
the film has a life sufficiently long to affect the
flow of the liquid.
As the film rolls out on the surface of the mould,
it confers a non-wetting behaviour on the liquid
itself because the liquid is effectively sealed in a
non-wetting skin. The skin forms a mechanical
barrier between the liquid and the mould. The barrier
is laid down as the liquid progresses because of
friction between the liquid and the mould, the friction
effectively stretching the film and tearing it at the
meniscus where it immediately re-forms to continue
the process. The laying down of the film as the
liquid progresses is analogous to the laying down
of the tracks of a track-laying vehicle. The strength
and rigidity of the carbon film helps the liquid
surface to bridge unsupported regions between sand
grains or other imperfections in the mould surface.
By this mechanism the surface of the casting can
be smoothed.
The mechanism for the improvement of surface
finish can only operate effectively if the progress
of the meniscus is steady and controlled, i.e. in the
absence of surface turbulence.
However, if the carbon film becomes entrained
in the liquid because of surface turbulence, becoming
a carbon bifilm, it can constitute a serious crack-
like defect. In heavy section castings the entrained
defect has time to dissolve, and
so
is less of a
problem. Binder systems that produce lustrous
carbon should only be used for light section castings
with running systems that can guarantee a low level
of surface turbulence.
4.4.3
Sand reactions
Other reactions in the mould surface occur with
the sand grains themselves. The most common of
sand reactions is the reaction between silica (SO2)
and iron oxide (wustite, FeO) to produce fayalite
(Fe2Si04). This happens frequently at the high
temperatures required for the casting of irons and
steels. It causes the grains to fuse and collapse as
they melt into each other, because the melting point
of fayalite is only
1205°C.
The reacted grains adhere
to the surface of the casting because of the presence
of the low-melting-point liquid ‘glue’. This
is
known
as bum-on.
The common method of dealing with this problem
is to prevent the iron oxidizing to form FeO in the
first place. This is usually achieved by adding
reducing agents to the mould material, such as
powdered coal to greensand, or aluminium-powder
additions to mould washes and the like. The problem
is also reduced in other sands that contain less silica,
such as chromite sand. However, the small amounts
of silica which are present can still give trouble in
steel castings, where the extreme temperature causes
the residual silica to fuse with the clay. At these
temperatures even the chromite itself may break
down, releasing FeO or even Fe. Metal penetration
usually follows as the grains melt into each other,
and the mould surface generally collapses. The
molten, fused mass is sometimes known as ‘chromite
glaze’. It is a kind of burn-on, and is difficult to
remove from steel castings (Petro and Flinn 1978).
Again, carbon compounds added to the moulding
material are useful in countering this problem
(Dietert
et
al.
1970).
4.4.4
Mould contamination
There are a few metallic impurities that find their
way into moulding sands as a result of interaction
with the cast metal. We are not thinking for the
moment
of
the odd spanner or tonnes of iron filings
from the steady wearing away of the sand plant.
(Such ferrous contamination is retrieved in most
sand plants by the provision of a powerful magnet
located at some convenient point in the recirculating
sand system.) Nor are we thinking of the pieces of
tramp metal such as flash and other foundry returns.
Our concern is with the microscopic traces
of
metallic impurities that lead to a number of
problems, particularly because of the need to protect
the environment from contamination.
Foundries that cast copper-based alloys
containing lead find that their moulding sand
becomes contaminated with lead (Mondloch
et
al.
1987). The lead is almost certainly lost from the
casting by evaporation from the surface after casting.
The vapour deposits among the sand grains in the
mould as either particles of metallic alloy, or reacts
with the clay present, particularly if this is bentonite,
to produce Pb-A1 silicates. If there is no clay present,
as in chemical binder systems such as a furan resin,
then no reaction is observed
so
that metallic lead
remains (Ostrom
et
al.
1982). Thus ways of reducing
this problem are: (i) the complete move, where
possible in simple castings, to metal moulds; (ii)