ADVANCED MECHANICS OF COMPOSITE MATERIALS Episode 3 ppt
Bạn đang xem bản rút gọn của tài liệu. Xem và tải ngay bản đầy đủ của tài liệu tại đây (3.22 MB, 35 trang )
Chapter 3
MECHANICS OF A UNIDIRECTIONAL PLY
A ply or lamina is the simplest element of a composite material, an elementary layer
of unidirectional fibers in a matrix (see Fig. 3.1), formed when a unidirectional tape
impregnated with resin is placed onto the surface of the tool, thus providing the shape of
a composite part.
3.1. Ply architecture
As the tape consists of tows (bundles of fibers), the ply thickness (whose minimum
value is about 0.1 mm for modern composites) is much higher than the fiber diameter
(about 0.01 mm). In an actual ply, the fibers are randomly distributed, as in Fig. 3.2. Since
the actual distribution is not known and can hardly be predicted, some typical idealized
regular distributions, i.e., square (Fig. 3.3), hexagonal (Fig. 3.4), and layer-wise (Fig. 3.5),
are used for the analysis.
A composite ply is generally taken to consist of two constituents: fibers and a matrix
whose quantities in the materials are specified by volume, v, and mass, m, fractions
v
f
=
V
f
V
c
,v
m
=
V
m
V
c
(3.1)
m
f
=
M
f
M
c
,m
m
=
M
m
M
c
(3.2)
Here, V and M are volume and mass, whereas subscripts f, m, and c correspond to fibers,
matrix, and composite material, respectively. Since V
c
= V
f
+V
m
and M
c
= M
f
+M
m
,
we have
v
f
+v
m
= 1,m
f
+m
m
= 1 (3.3)
There exist the following relationships between volume and mass fractions
v
f
=
ρ
c
ρ
f
m
f
,v
m
=
ρ
c
ρ
m
m
m
(3.4)
57
58 Advanced mechanics of composite materials
1
2
3
Fig. 3.1. A unidirectional ply.
Fig. 3.2. Actual fiber distribution in the cross-section of a ply (v
f
= 0.65).
where ρ
f
, ρ
m
, and ρ
c
are the densities of fibers, the matrix, and the composite, respectively.
In analysis, volume fractions are used because they enter the stiffness coefficients for a ply,
whereas mass fractions are usually measured directly during processing or experimental
study of the fabricated material.
Two typical situations usually occur. The first situation implies that we know the mass
of fibers used to fabricate a composite part and the mass of the part itself. The mass of
fibers can be found if we weigh the spools with fibers before and after they are used or
calculate the total length of tows and multiply it by the tow tex-number that is the mass
in grams of a 1000-m-long tow. So, we know the values of M
f
and M
c
and can use the
first equations of Eqs. (3.2) and (3.4) to calculate v
f
.
Chapter 3. Mechanics of a unidirectional ply 59
Fig. 3.3. Square fiber distribution in the cross-section of a ply (v
f
= 0.65).
Fig. 3.4. Hexagonal fiber distribution in the cross-section of a ply (v
f
= 0.65).
60 Advanced mechanics of composite materials
Fig. 3.5. Layer-wise fiber distribution in the cross-section of a ply (v
f
= 0.65).
The second situation takes place if we have a sample of a composite material and know
the densities of the fibers and the matrix used for its fabrication. Then, we can find the
experimental value of material density, ρ
e
c
, and use the following equation for theoretical
density
ρ
c
= ρ
f
v
f
+ρ
m
v
m
(3.5)
Putting ρ
c
= ρ
e
c
and taking into account Eqs. (3.3), we obtain
v
f
=
ρ
e
c
−ρ
m
ρ
f
−ρ
m
(3.6)
Consider, for example, a carbon–epoxy composite material with fibers AS4 and matrix
EPON DPL-862, for which ρ
f
= 1.79 g/cm
3
and ρ
m
= 1.2g/cm
3
. Let ρ
e
c
= 1.56 g/cm
3
.
Then, Eq. (3.6) yields v
f
= 0.61.
This result is approximate because it ignores possible material porosity. To determine
the actual fiber fraction, we should remove the resin using matrix destruction, solvent
extraction, or burning the resin out in an oven. As a result, we get M
f
, and having M
c
,
can calculate m
f
and v
f
with the aid of Eqs. (3.2) and (3.4). Then we find ρ
c
using
Eq. (3.5) and compare it with ρ
e
c
.Ifρ
c
>ρ
e
c
, the material includes voids whose volume
fraction (porosity) can be calculated using the following equation
v
p
= 1 −
ρ
e
c
ρ
c
(3.7)
Chapter 3. Mechanics of a unidirectional ply 61
d
d
d
d
d
d
(a) (b) (c)
Fig. 3.6. Ultimate fiber arrays for square (a), hexagonal (b), and layer-wise (c) fiber distributions.
For the carbon–epoxy composite material considered above as an example, assume that
the foregoing procedure results in m
f
= 0.72. Then, Eqs. (3.4), (3.5), and (3.7) give
v
f
= 0.63,ρ
c
= 1.58 g/cm
3
, and v
p
= 0.013, respectively.
For real unidirectional composite materials, we normally have v
f
= 0.50−0.65. Lower
fiber volume content results in lower ply strength and stiffness under tension along the
fibers, whereas higher fiber content, close to the ultimate value, leads to reduction of the
ply strength under longitudinal compression and in-plane shear due to poor bonding of
the fibers.
Since the fibers usually have uniform circular cross-sections, there exists the ultimate
fiber volume fraction, v
u
f
, which is less than unity and depends on the fiber arrangement.
For typical arrangements shown in Figs. 3.3–3.5, the ultimate arrays are presented in
Fig. 3.6, and the corresponding ultimate fiber volume fractions are:
Square array v
u
f
=
1
d
2
πd
2
4
=
π
4
= 0.785
Hexagonal array v
u
f
=
2
d
2
√
3
πd
2
4
=
π
2
√
3
= 0.907
Layer-wise array v
u
f
=
1
d
2
πd
2
4
=
π
4
= 0.785
3.2. Fiber–matrix interaction
3.2.1. Theoretical and actual strength
The most important property of advanced composite materials is associated with the
very high strength of a unidirectional ply, accompanied with relatively low density.
62 Advanced mechanics of composite materials
This advantage of the material is provided mainly by the fibers. Correspondingly, a natural
question arises as to how such traditional lightweight materials such as glass or graphite,
which were never utilized as primary load-bearing structural materials, can be used to
make fibers with strength exceeding the strength of such traditional structural materials
as aluminum or steel (see Table 1.1). The general answer is well known: the strength of a
thin wire is usually much higher than the strength of the corresponding bulk material. This
is demonstrated in Fig. 3.7, showing that the wire strength increases as the wire diameter
is reduced.
In connection with this, two questions arise. First, what is the upper limit of strength
that can be predicted for an infinitely thin wire or fiber? And second, what is the nature
of this phenomenon?
The answer to the first question is given in The Physics of Solids. Consider an idealized
model of a solid, namely a regular system of atoms located as shown in Fig. 3.8 and find
the stress, σ , that destroys this system. The dependence of σ on atomic spacing as given
by The Physics of Solids is presented in Fig. 3.9. Point O of the curve corresponds to
the equilibrium of the unloaded system, whereas point U specifies the ultimate theoretical
stress,
σ
t
. The initial tangent angle, α, characterizes the material’s modulus of elasticity, E.
To evaluate
σ
t
, we can use the following sine approximation (Gilman, 1959) for the OU
segment of the curve
σ =
σ
t
sin 2π
a −a
0
a
0
0
1
2
3
4
0.4 0.8 1.2 1.6
s, GPa
d, m
m
Fig. 3.7. Dependence of high-carbon steel wire strength on the wire diameter.
Chapter 3. Mechanics of a unidirectional ply 63
a
s
s
Fig. 3.8. Material model.
U
a
0
a
0
s
t
a
s
Fig. 3.9. Atoms’ interaction curve ( ) and its sine approximation ( ).
Introducing strain
ε =
a −a
0
a
0
we arrive at
σ =
σ
t
sin 2πε
64 Advanced mechanics of composite materials
Now, we can calculate the modulus as
E =
dσ
dε
ε=0
= 2πσ
t
Thus,
σ
t
=
E
2π
(3.8)
This equation yields a very high value for the theoretical strength. For example, for a
steel wire,
σ
t
= 33.4 GPa. Until now, the highest strength reached in 2-µm-diameter
monocrystals of iron (whiskers) is about 12 GPa.
The model under study allows us to introduce another important characteristic of the
material. The specific energy that should be spent to destroy the material can be presented
in accordance with Fig. 3.9 as
2γ =
∞
a
0
σ(a)da (3.9)
As material fracture results in the formation of two new free surfaces, γ can be referred
to as the specific surface energy (energy spent to form the surface of unit area).
The answer to the second question (why the fibers are stronger than the corresponding
bulk materials) was in fact given by Griffith (1920), whose results have formed the basis
of fracture mechanics.
Consider a fiber loaded in tension and having a thin circumferential crack as shown in
Fig. 3.10. The crack length, l, is much less than the fiber diameter, d.
For a linear elastic fiber, σ =Eε, and the elastic potential in Eq. (2.51) can be
presented as
U =
1
2
σε =
σ
2
2E
When the crack appears, the strain energy is released in a material volume adjacent to
the crack. Suppose that this volume is comprised of a conical ring whose generating lines
are shown in Fig. 3.10 by dashed lines and heights are proportional to the crack length, l.
Then, the total released energy, Eq. (2.52), is
W =
1
2
kπ
σ
2
E
l
2
d (3.10)
where k is some constant coefficient of proportionality. On the other hand, the formation
of new surfaces consumes the energy
S = 2πγld (3.11)
Chapter 3. Mechanics of a unidirectional ply 65
σ
σ
d
dldl
ll
Fig. 3.10. A fiber with a crack.
where γ is the surface energy, Eq. (3.9). Now assume that the crack length is increased
by an infinitesimal increment, dl. Then, if for some value of acting stress, σ
dW
dl
>
dS
dl
(3.12)
the crack will propagate, and the fiber will fail. Substituting Eqs. (3.10) and (3.11) into
inequality (3.12) we arrive at
σ>
σ
c
=
2γE
kl
(3.13)
The most important result that follows from this condition specifying some critical
stress, σ
c
, beyond which the fiber with a crack cannot exist is the fact that σ
c
depends on
the absolute value of the crack length (not on the ratio l/d). Now, for a continuous fiber,
2l<d; so, the thinner the fiber, the smaller is the length of the crack that can exist in this
fiber and the higher is the critical stress,
σ
c
. More rigorous analysis shows that, reducing
l to a in Fig. 3.8, we arrive at
σ
c
= σ
t
.
66 Advanced mechanics of composite materials
Consider, for example, glass fibers that are widely used as reinforcing elements in
composite materials and have been studied experimentally to support the fundamentals
of fracture mechanics (Griffith, 1920). The theoretical strength of glass, Eq. (3.8), is
about 14 GPa, whereas the actual strength of 1-mm-diameter glass fibers is only about
0.2 GPa, and for 5-mm-diameter fibers, this value is much lower (about 0.05 GPa). The
fact that such low actual strength is caused by surface cracks can be readily proved if
the fiber surface is smoothed by etching the fiber with acid. Then, the strength of 5-mm-
diameter fibers can be increased up to 2 GPa. If the fiber diameter is reduced by heating
and stretching the fibers to a diameter of about 0.0025 mm, the strength is increased to
6 GPa. Theoretical extrapolation of the experimental curve, showing the dependence of
the fiber strength on the fiber diameter for very small fiber diameters, yields
σ = 11 GPa,
which is close to
σ
t
= 14 GPa.
Thus, we arrive at the following conclusion, clarifying the nature of the high perfor-
mance of advanced composites and their place among modern structural materials.
The actual strength of advanced structural materials is much lower than their theoretical
strength. This difference is caused by defects in the material microstructure (e.g., crys-
talline structure) or macrocracks inside the material and on its surface. Using thin fibers,
we reduce the influence of cracks and thus increase the strength of materials reinforced
with these fibers. So, advanced composites comprise a special class of structural materials
in which we try to utilize the natural potential properties of the material, rather than the
possibilities of technology as we do developing high-strength alloys.
3.2.2. Statistical aspects of fiber strength
Fiber strength, being relatively high, is still less than the corresponding theoretical
strength, which means that fibers of advanced composites have microcracks or other
defects randomly distributed along the fiber length. This is supported by the fact that fiber
strength depends on the length of the tested fiber. The dependence of strength on length for
boron fibers (Mikelsons and Gutans, 1984) is shown in Fig. 3.11. The longer the fiber, the
higher the probability of a deleterious defect to exist within this length, and the lower the
fiber strength. The tensile strengths of fiber segments with the same length but taken from
different parts of a long continuous fiber, or from different fibers, also demonstrates the
strength deviation. A typical strength distribution for boron fibers is presented in Fig. 3.12.
The first important characteristic of the strength deviation is the strength scatter
σ =
σ
max
− σ
min
. For the case corresponding to Fig. 3.12, σ
max
= 4.2 GPa, σ
min
= 2 GPa,
and
σ = 2.2 GPa. To plot the diagram presented in Fig. 3.12,
σ is divided into a set
of increments, and a normalized number of fibers n = N
σ
/N (N
σ
is the number of fibers
failing at that stress within the increment, and N is the total number of tested fibers) is
calculated and shown on the vertical axis. Thus, the so-called frequency histogram can be
plotted. This histogram allows us to determine the mean value of the fiber strength as
σ
m
=
1
N
N
i=1
σ
i
(3.14)
Chapter 3. Mechanics of a unidirectional ply 67
0
1
2
3
4
10 20 30 40
s, GPa
L, mm
Fig. 3.11. Dependence of strength of boron fibers on the fiber length.
s, GPa
0
0.05
0.1
0.15
0.2
0.25
1
n
5432
Fig. 3.12. Strength distribution for boron fibers.
68 Advanced mechanics of composite materials
and the strength dispersion as
d
σ
=
1
N −1
N
i=1
(σ
m
−σ
i
)
2
(3.15)
The deviation of fiber strength is characterized by the coefficient of the strength variation,
which is presented as follows
r
σ
=
d
σ
σ
m
100% (3.16)
For the boron fibers under consideration, Eqs. (3.14)–(3.16) yield
σ
m
= 3.2 GPa, d
σ
=
0.4 GPa, and r
σ
= 12.5%.
To demonstrate the influence of fiber strength deviation on the strength of a unidi-
rectional ply, consider a bundle of fibers, i.e., a system of approximately parallel fibers
with different strength and slightly different lengths, as in Fig. 3.13. Typical stress–strain
diagrams for fibers tested under tension in a bundle are shown in Fig. 3.14 (Vasiliev and
Tarnopol’skii, 1990). As can be seen, the diagrams have two nonlinear segments. The
nonlinearity in the vicinity of zero stresses is associated with different lengths of fibers
in the bundles, whereas the nonlinear behavior of the bundle under stresses close to the
ultimate values is caused by fracture of the fibers with lower strength.
Useful qualitative results can be obtained if we consider model bundles consisting of
five fibers with different strengths. Five such bundles are presented in Table 3.1, showing
the normalized strength of each fiber. As can be seen, the deviation of fiber strength is
such that the mean strength, σ
m
= 1, is the same for all the bundles, whereas the variation
coefficient, r
σ
, changes from 31.6% for bundle No. 1 to zero for bundle No. 5. The last
row in the table shows the effective (observed) ultimate force,
F , for a bundle. Consider,
for example, the first bundle. When the force is increased to F = 3, the stresses in all the
fibers become σ
j
= 0.6, and fiber No. 1 fails. After this happens, the force F = 3 is taken
L
j
Fig. 3.13. Tension of a bundle of fibers.
Chapter 3. Mechanics of a unidirectional ply 69
0
0.5
1
1.5
2
0 0.5 1 1.5 2 2.5 3
s, GPa
∆L
L
2
1
Fig. 3.14. Stress–strain diagrams for bundles of carbon (1) and aramid (2) fibers.
Table 3.1
Strength of bundles consisting of fibers of different strengths.
Fiber number Bundle number
12345
10.60.70.85 0.91.0
20.80.90.90.95 1.0
31.01.01.01.01.0
41.21.11.11.05 1.0
51.41.31.15 1.11.0
σ
m
1.01.01.01.01.0
r
σ
(%) 31.622.412.87.80
F 3.23.64.25 4.55.0
by four fibers, and σ
j
= 0.75 (j = 2, 3, 4, 5). When the force reaches the value F = 3.2,
the stresses become σ
j
= 0.8, and fiber No. 2 fails. After that, σ
j
= 1.07 (j = 3, 4, 5).
This means that fiber No. 3 also fails at force F = 3.2. Then, for the two remaining fibers,
σ
4
= σ
5
= 1.6, and they also fail. Thus,
F = 3.2 for bundle No. 1. In a similar way,
F can be calculated for the other bundles in the table. As can be seen, the lower the fiber
strength variation, the higher the
F , which reaches its maximum value,
F = 5, for bundle
No. 5, consisting of fibers of the same strength.
Table 3.2 demonstrates that strength variation can be more important than the mean
strength. In fact, while the mean strength, σ
m
, goes down for bundles No. 1–5, the
ultimate force,
F , increases. So, it can be better to have fibers with relatively low strength
and low strength variation rather than high-strength fibers with high strength variation.
70 Advanced mechanics of composite materials
Table 3.2
Strength of bundles consisting of fibers of different strengths.
Fiber number Bundle number
12345
10.60.70.85 0.90.95
20.80.90.90.85 0.95
31.01.21.11.00.95
41.61.41.15 1.05 0.95
53.01.61.41.10.95
σ
m
1.41.16 1.08 1.00.95
r
σ
(%) 95.066.022.07.80
F 3.23.64.25 4.54.75
3.2.3. Stress diffusion in fibers interacting through the matrix
The foregoing discussion concerned individual fibers or bundles of fibers that are not
joined together. This is not the case for composite materials in which the fibers are embed-
ded in the matrix material. Usually, the stiffness of the matrix is much lower than that of
fibers (see Table 1.1), and the matrix practically does not take the load applied in the fiber
direction. However, the fact that the fibers are bonded with the matrix even having rela-
tively low stiffness changes the mechanism of fiber interaction and considerably increases
their effective strength. To show this, the strength of dry fiber bundles can be compared
with the strength of the same bundles after they were impregnated with epoxy resin and
cured. The results are listed in Table 3.3. As can be seen, composite bundles in which
fibers are joined together by the matrix demonstrate significantly higher strength, and the
higher the fiber sensitivity to damage, the higher the difference in strength of dry and
composite bundles. The influence of a matrix on the variation of strength is even more
significant. As follows from Table 3.4, the variation coefficients of composite bundles are
lower by an order of magnitude than those of individual fibers.
To clarify the role of a matrix in composite materials, consider the simple model of
a unidirectional ply shown in Fig. 3.15 and apply the method of analysis developed for
stringer panels (Goodey, 1946).
Table 3.3
Strength of dry bundles and composite bundles.
Fibers Sensitivity of fibers
to damage
Ultimate tensile load
F (N) Strength
increase (%)
Dry bundle Composite bundle
Carbon High 14 26 85.7
Glass Moderate 21 36 71.4
Aramid Low 66 84 27.3
Chapter 3. Mechanics of a unidirectional ply 71
Table 3.4
Variation coefficients for fibers and unidirectional composites.
Fibers Variation coefficient r
σ
(%)
Fibers Composite
Glass 29 2.0
Carbon 30 4.7
Aramid 24 5.0
Boron 23 3.0
(n −1)
x, u
k
y
(n +1)
(n +1)
σ
σ
σ
σ
σ
σ
n
n
1
1
1'
0
sym.
δ
sym.
a
a
m
a
f
Fig. 3.15. Model of a unidirectional ply with a broken fiber.
Let the ply of thickness δ consist of 2k fibers symmetrically distributed on both sides
of the central fiber n = 0. The fibers are joined with layers of the matrix material, and the
fiber volume fraction is
v
f
=
a
f
a
,a= a
f
+a
m
(3.17)
Let the central fiber have a crack induced by the fiber damage or by the shortage of this
fiber’s strength. At a distance from the crack, the fibers are uniformly loaded with stress σ
(see Fig. 3.15).
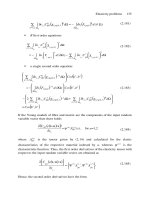
First, derive the set of equations describing the ply under study. Since the stiffness of
the matrix is much less than that of fibers, we neglect the stress in the matrix acting in
the x direction and assume that the matrix works only in shear. We also assume that there
are no displacements in the y direction.
72 Advanced mechanics of composite materials
Considering equilibrium of the last (n = k) fiber, an arbitrary fiber, and the central
(n = 0) fiber shown in Fig. 3.16, we arrive at the following equilibrium equations
a
f
σ
k
−τ
k
= 0
a
f
σ
n
+τ
n+1
−τ
n
= 0 (3.18)
a
f
σ
0
+2τ
1
= 0
in which
()
= d
()
/dx.
s
k
k
k
n +1
n
n
s
n
1
0
(s
0
+
ds
0
dx
dx)
(s
k
+
ds
k
dx
dx)
(s
n
+
ds
n
dx
dx)
s
0
(c)
(b)
(a)
t
n+1
t
n
t
1
t
1
t
k
Fig. 3.16. Stresses acting in fibers and matrix layers for the last (a), arbitrary n-th fiber (b), and the central
n = 0 fiber (c).
Chapter 3. Mechanics of a unidirectional ply 73
Constitutive equations for fibers and the matrix can be written as
σ
n
= E
f
ε
n
,τ
n
= G
m
γ
n
(3.19)
Here, E
f
is the fiber elasticity modulus and G
m
is the matrix shear modulus, whereas
ε
n
= u
n
(3.20)
is the fiber strain expressed in terms of the displacement in the x direction. The shear
strain in the matrix follows from Fig. 3.17, i.e.,
γ
n
=
1
a
m
(u
n
−u
n−1
) (3.21)
This set of equations, Eqs. (3.18)–(3.21), is complete – it includes 10k +3 equations and
contains the same number of unknown stresses, strains, and displacements.
Consider the boundary conditions. If there is no crack in the central fiber, the solution of
the problem is evident and has the form σ
n
= σ, τ
n
= 0. Assuming that the perturbation
of the stressed state induced by the crack vanishes at a distance from the crack, we
arrive at
σ
n
(x →∞) = σ, τ
n
(x →∞) = 0 (3.22)
As a result of the crack in the central fiber, we have
σ
0
(x = 0) = 0 (3.23)
For the remaining fibers, symmetry conditions yield
u
n
(x = 0) = 0 (n = 1, 2, 3 k) (3.24)
n
u
n
a
m
n −1
u
n−1
g
n
Fig. 3.17. Shear strain in the matrix layer.
74 Advanced mechanics of composite materials
To solve the problem, we use the stress formulation and, in accordance with Section 2.10,
should consider equilibrium equations in conjunction with compatibility equations
expressed in terms of stresses.
First, transform equilibrium equations introducing the stress function, F(x), such that
τ
n
= F
n
,F
n
(x →∞) = 0 (3.25)
Substituting Eqs. (3.25) into the equilibrium equations, Eqs. (3.18), integrating them from
x to ∞, and taking into account Eqs. (3.22) and (3.25), we obtain
σ
k
= σ +
1
a
f
F
k
σ
n
= σ −
1
a
f
(F
n+1
−F
n
) (3.26)
σ
0
= σ −
2
a
f
F
1
Compatibility equations follow from Eqs. (3.20) and (3.21), i.e.,
γ
n
=
1
a
m
(ε
n
−ε
n−1
)
Using constitutive equations, Eqs. (3.19), we can write them in terms of stresses
τ
n
=
G
m
a
m
E
f
(σ
n
−σ
n−1
)
Substituting stresses from Eqs. (3.25) and (3.26), and introducing the dimensionless coor-
dinate
x = x/a (see Fig. 3.15), we finally arrive at the following set of governing
equations:
F
k
−µ
2
(2F
k
−F
k−1
) = 0
F
n
+µ
2
(F
n+1
−2F
n
+F
n−1
) = 0 (3.27)
F
1
+µ
2
(F
2
−3F
1
) = 0
in which, in accordance with Eqs. (3.17),
µ
2
=
G
m
a
2
a
f
a
m
E
f
=
G
m
v
f
(1 −v
f
)E
f
(3.28)
With due regard to the second equation in Eqs. (3.25), we can take the general solution
of Eqs. (3.27) in the form
F
n
(x) = A
n
e
−λx
(3.29)
Chapter 3. Mechanics of a unidirectional ply 75
Substitution in Eqs. (3.27) yields:
A
k
2 −
λ
2
µ
2
−A
k−1
= 0 (3.30)
A
n+1
−A
n
2 −
λ
2
µ
2
+A
n−1
= 0 (3.31)
A
2
−A
1
3 −
λ
2
µ
2
= 0 (3.32)
The finite-difference equation, Eq. (3.31), can be reduced to the following form
A
n+1
−2A
n
cos θ +A
n−1
= 0 (3.33)
where
cos θ = 1 −
λ
2
2µ
2
(3.34)
As can be readily checked, the solution for Eq. (3.33) is
A
n
= B cos nθ +C sin nθ (3.35)
whereas Eq. (3.34) yields, after some transformation,
λ = 2µ sin
θ
2
(3.36)
Substituting the solution, Eq. (3.35), into Eq. (3.30), we obtain, after some transformation,
B =−C tan(k + 1)θ
Thus, Eq. (3.35) can be written as
A
n
= C[sin nθ −cos nθ ·tan(k + 1)θ] (3.37)
Substituting Eq. (3.37) into Eq. (3.32) and performing rather cumbersome trigonometric
transformations, we arrive at the following equation for θ
tan kθ =−tan
θ
2
(3.38)
The periodic properties of the tangent function in Eq. (3.38) mean that it has k+1 different
roots corresponding to intersection points of the curves z = tan kθ and z =−tan θ/2.
76 Advanced mechanics of composite materials
−6
−4
−2
0
1234
z = tan kq
z
q, ra
d
z = –tan
2
q
0
Fig. 3.18. Geometric interpretation of Eq. (3.38) for k = 4.
For the case k = 4, considered below as an example, these points are shown in Fig. 3.18.
Further transformation allows us to reduce Eq. (3.38) to
sin
2k +1
2
θ = 0
from which it follows that
θ
i
=
2πi
2k +1
(i = 0, 1, 2 k) (3.39)
The first root, θ
0
= 0, corresponds to λ = 0 and F
n
= const, i.e., to a ply without a crack
in the central fiber. So, Eq. (3.39) specifies k roots (i = 1, 2, 3, , k) for the ply under
study, and the solution in Eqs. (3.29) and (3.37) can be generalized as
F
n
(x) =
k
i=1
C
i
[sin nθ
i
−cos nθ
i
·tan(k + 1)θ
i
]e
−λ
i
x
(3.40)
where, in accordance with Eq. (3.36),
λ
i
= 2µ sin
θ
i
2
(3.41)
and θ
i
are determined by Eq. (3.39).
Using Eq. (3.38), we can transform Eq. (3.40) to the following final form
F
n
(x) =
k
i=1
C
i
S
n
(θ
i
)e
−λ
i
x
(3.42)
Chapter 3. Mechanics of a unidirectional ply 77
where
S
n
(θ
i
) =
sin(2n −1/2)θ
i
cos(θ
i
/2)
(3.43)
Applying Eqs. (3.25) and (3.26), we can find shear and normal stresses, i.e.,
τ
n
(x) =−
1
a
k
i=1
λ
i
C
i
S
n
(θ
i
)e
−λ
i
x
(n = 1, 2, 3 k) (3.44)
σ
k
(x) = σ +
1
a
f
k
i=1
C
i
S
k
(θ
i
)e
−λ
i
x
(3.45)
σ
n
(x) = σ −
1
a
f
k
i=1
C
i
[S
n+1
(θ
i
) −S
n
(θ
i
)]e
−λ
i
x
(n = 1, 2, 3 k− 1) (3.46)
σ
0
(x) = σ −
2
a
f
k
i=1
C
i
S
1
(θ
i
)e
−λ
i
x
(3.47)
Displacements can be determined with the aid of Eqs. (3.19), (3.21), and (3.25). Changing
x for
x = x/a,weget
u
n
(x) =
a
m
aG
m
F
n
(x) + u
n−1
(x)
For the first fiber (n = 1), we have
u
1
(x) =
a
m
aG
m
F
1
(x) + u
0
(x)
Substituting Eq. (3.42) into these equations, we arrive at
u
n
(x) =−
a
m
aG
m
k
i=1
C
i
λ
i
S
n
(θ
i
)e
−λ
i
x
+u
n−1
(x) (n = 2, 3, 4 k) (3.48)
u
1
(x) =−
a
m
aG
m
k
i=1
C
i
λ
i
S
1
(θ
i
)e
−λ
i
x
+u
0
(x) (3.49)
To determine coefficients C
i
, we should apply the boundary conditions and write
Eqs. (3.23) and (3.24) in the explicit form using Eqs. (3.47)–(3.49). Substituting S
n
from
78 Advanced mechanics of composite materials
Eq. (3.43) and λ
i
from Eq. (3.41), we have
k
i=1
C
i
tan
θ
i
2
=
σa
f
2
k
i=1
C
i
tan
θ
i
2
sin
2n −1
2
θ
i
= 0 (n = 2, 3, 4 k)
k
i=1
C
i
tan
θ
i
2
sin
θ
i
2
=
aG
m
2µa
m
u
0
(0)
Introducing new coefficients
D
i
= C
i
tan
θ
i
2
(3.50)
we arrive at the final form of the boundary conditions, i.e.,
k
i=1
D
i
=
σa
f
2
(3.51)
k
i=1
D
i
sin
2n −1
2
θ
i
= 0 (n = 2, 3, 4 k) (3.52)
k
i=1
D
i
sin
θ
i
2
=
aG
m
2µa
m
u
0
(0) (3.53)
This set contains k + 1 equations and includes k unknown coefficients D
i
and displace-
ment u
0
(0).
The foregoing set of equations allows us to obtain the exact analytical solution for any
number of fibers, k. To find this solution, some transformations are required. First, multiply
Eq. (3.52) by sin[(2n −1)θ
s
/2] and sum up all the equations from n = 2ton = k. Adding
Eq. (3.53) for n = 1 multiplied by sin(θ
s
/2), we obtain
k
n=1
k
i=1
D
i
sin
2n −1
2
θ
i
sin
2n −1
2
θ
s
=
aG
m
2µa
m
u
0
(0) sin
θ
s
2
Now, the sequence of summation can be changed, as follows
k
i=1
D
i
k
n=1
sin
2n −1
2
θ
i
sin
2n −1
2
θ
s
=
aG
m
2µa
m
u
0
(0) sin
θ
s
2
(3.54)
Chapter 3. Mechanics of a unidirectional ply 79
Using the following known series
k
n=1
cos(2n −1)θ =
sin 2kθ
2 sin θ
we get in several steps
R
is
=
k
n=1
sin
2n −1
2
θ
i
sin
2n −1
2
θ
s
=
1
2
k
n=1
cos
2n −1
2
(θ
i
−θ
s
) −cos
2n −1
2
(θ
i
+θ
s
)
=
1
4
sin k(θ
i
−θ
s
)
sin
1
2
(θ
i
−θ
s
)
−
sin k(θ
i
+θ
s
)
sin
1
2
(θ
i
+θ
s
)
=
cos(θ
i
/2) cos kθ
i
cos(θ
s
/2) cos kθ
s
cos θ
s
−cos θ
i
tan kθ
i
tan
θ
i
2
−tan kθ
s
tan
θ
s
2
Using Eq. (3.38), we can conclude that R
is
= 0 for i = s. For the case i = s, we have
R
ss
=
k
n=1
sin
2
2n −1
2
θ
s
=
1
2
k
n=1
[1 −cos(2n −1)θ
s
]=
1
2
k −
sin 2kθ
s
2 sin θ
s
As a result, Eq. (3.54) yields
D
s
=
2aG
m
u
0
(0) sin(θ
s
/2) sin θ
s
µa
m
(2k sin θ
s
−sin 2kθ
s
)
(s = 1, 2, 3 k) (3.55)
Substituting these coefficients into Eq. (3.51), we can find u
0
(0), i.e.,
u
0
(0) =
σµa
f
a
m
4aG
m
k
i=1
sin(θ
i
/2) sin θ
i
2k sin θ
i
−sin 2kθ
i
−1
(3.56)
Thus, the solution for the problem under study is specified by Eqs. (3.44)–(3.50), (3.55),
and (3.56).
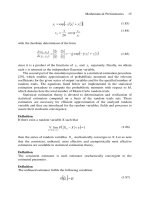
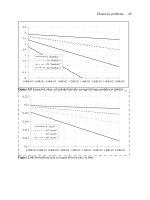
For example, consider a carbon–epoxy ply with the following parameters: E
f
=
250 GPa, G
m
= 1 GPa, v
f
= 0.6, and k = 4. The distribution of the normalized stresses
in the fibers along the ply is shown in Fig. 3.19, whereas the same distribution of shear
stresses in the matrix is presented in Fig. 3.20. As can be seen, in the vicinity of the crack
in the central fiber, the load carried by this fiber is transmitted by shear through the matrix
to adjacent fibers. At a distance from the end of the fiber, greater than
l
i
, the stress in
80 Advanced mechanics of composite materials
0
0.25
0.5
0.75
1
1.25
1.5
0 5 10 15 20 25 30 35 40 45 50
s
n
x
1
0
2
l
i
3,4
s
Fig. 3.19. Distribution of normal stresses along the fibers n = 0, 1, 2, 3, 4 for k = 4,E
f
= 250 GPa, and
G
m
= 1 GPa.
−0.1
−0.08
−0.06
−0.04
−0.02
0
0 5 10 15 20 25 30 35 40 45 50
t
n
x
s
Fig. 3.20. Distribution of shear stresses along the fibers for k = 4,E
f
= 250 GPa, and G
m
= 1 GPa.
Numbers of the matrix layers:
n = 1;
n = 2; n = 3; n = 4.
the broken fiber becomes close to σ, and for x>l
i
, the fiber behaves as if there is no
crack. A portion of the broken fiber corresponding to 0 ≤
x ≤
l
i
is not fully effective in
resisting the applied load, and l
i
= l
i
a is referred to as the fiber ineffective length. Since
the fiber defects are randomly distributed along its length, their influence on the strength
of the ply is minimal if there are no other defects in the central and its adjacent fibers
within distance l
i
from the crack. To minimize the probability of such defects, we should
minimize l
i
, which depends on fiber and matrix stiffnesses and material microstructure.
To evaluate l
i
, consider Eq. (3.47) and assume that σ
0
(x) becomes close to σ if
e
−λ
i
l
i
= k
Chapter 3. Mechanics of a unidirectional ply 81
where k is some small parameter indicating how close σ
0
(x) should be to σ to neglect the
difference between them (as a matter of fact, this difference vanishes only for
x →∞).
Taking approximately λ
i
= 2µ in accordance with Eq. (3.41) and using Eq. (3.28)
specifying µ, we arrive at
l
i
=−
1
2
ln k ·
v
f
(1 −v
f
)
E
f
G
m
For k = 0.01, we get
l
i
= 2.3a ·
v
f
(1 −v
f
)
E
f
G
m
(3.57)
For a typical carbon–epoxy ply (see Fig. 3.19) with a = 0.016 mm and v
f
= 0.6, Eq. (3.57)
yields 0.29 mm.
Thus, for real composites, the length l
i
is very small, and this explains why a uni-
directional composite demonstrates much higher strength in longitudinal tension than a
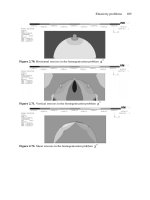
dry bundle of fibers (see Table 3.3). Reducing G
m
, i.e., the matrix stiffness, we increase
the fiber ineffective length, which becomes infinitely large for G
m
→ 0. This effect is
demonstrated in Fig. 3.21, which corresponds to a material whose matrix shear stiffness is
much lower than that in the foregoing example (see Fig. 3.19). For this case,
l
i
= 50, and
Eq. (3.57) yields l
i
= 0.8 mm. The distribution of shear stresses in this material is shown
in Fig. 3.22. Experiments with unidirectional glass–epoxy composites (E
f
= 86.8 GPa,
v
f
= 0.68, and a = 0.015) have shown that reduction of the matrix shear modulus from
1.08 GPa (l
i
= 0.14 mm) to 0.037 GPa (l
i
= 0.78 mm) results in reduction of longitudinal
tensile strength from 2010 MPa to 1290 MPa, i.e., by 35.8% (Chiao, 1979).
The ineffective length of a fiber in a matrix can be found experimentally by using the
single-fiber fragmentation test. For this test, a fiber is embedded in a matrix, and tensile
0
0.25
0.5
0.75
1
1.25
1.5
0 5 10 15 20 25 30 35 40 45 50
x
l
i
0
1
2
3,4
s
n
s
Fig. 3.21. Distribution of normal stresses along the fibres n = 0, 1, 2, 3, 4 for k = 4,E
f
= 250 GPa, and
G
m
= 0.125 GPa.