Harper’s Illustrated Biochemistry - Part 2 pptx
Bạn đang xem bản rút gọn của tài liệu. Xem và tải ngay bản đầy đủ của tài liệu tại đây (1.15 MB, 70 trang )
ENZYMES: KINETICS /61
For the reaction A + B → P+Q—
(4)
and for reaction (5)
(5)
(6)
—∆G
0
may be calculated from equation (3) if the con-
centrations of substrates and products present at equi-
librium are known. If ∆G
0
is a negative number, K
eq
will be greater than unity and the concentration of
products at equilibrium will exceed that of substrates. If
∆G
0
is positive, K
eq
will be less than unity and the for-
mation of substrates will be favored.
Notice that, since ∆G
0
is a function exclusively of
the initial and final states of the reacting species, it can
provide information only about the direction and equi-
librium state of the reaction. ∆G
0
is independent of the
mechanism of the reaction and therefore provides no
information concerning rates of reactions. Conse-
quently—and as explained below—although a reaction
may have a large negative ∆G
0
or ∆G
0′
, it may never-
theless take place at a negligible rate.
THE RATES OF REACTIONS
ARE DETERMINED BY THEIR
ACTIVATION ENERGY
Reactions Proceed via Transition States
The concept of the transition state is fundamental to
understanding the chemical and thermodynamic basis
of catalysis. Equation (7) depicts a displacement reac-
tion in which an entering group E displaces a leaving
group L, attached initially to R.
(7)
Midway through the displacement, the bond between
R and L has weakened but has not yet been completely
severed, and the new bond between E and R is as yet
incompletely formed. This transient intermediate—in
which neither free substrate nor product exists—is
termed the transition state, EؒؒؒRؒؒؒL. Dotted lines
represent the “partial” bonds that are undergoing for-
mation and rupture.
Reaction (7) can be thought of as consisting of two
“partial reactions,” the first corresponding to the forma-
tion (F) and the second to the subsequent decay (D) of
the transition state intermediate. As for all reactions,
ERL RL+
→
←
+−− E
K
eq
P
A
=
[]
[]
2
AA+
→
←
P
K
eq
PQ
AB
=
[][ ]
[][]
characteristic changes in free energy, ∆G
F
, and ∆G
D
are
associated with each partial reaction.
(8)
(9)
(8-10)
For the overall reaction (10), ∆G is the sum of ∆G
F
and
∆G
D
. As for any equation of two terms, it is not possi-
ble to infer from ∆G either the sign or the magnitude
of ∆G
F
or ∆G
D
.
Many reactions involve multiple transition states,
each with an associated change in free energy. For these
reactions, the overall ∆G represents the sum of all of
the free energy changes associated with the formation
and decay of all of the transition states. Therefore, it is
not possible to infer from the overall ⌬G the num-
ber or type of transition states through which the re-
action proceeds. Stated another way: overall thermo-
dynamics tells us nothing about kinetics.
∆G
F
Defines the Activation Energy
Regardless of the sign or magnitude of ∆G, ∆G
F
for the
overwhelming majority of chemical reactions has a pos-
itive sign. The formation of transition state intermedi-
ates therefore requires surmounting of energy barriers.
For this reason, ∆G
F
is often termed the activation en-
ergy, E
act
, the energy required to surmount a given en-
ergy barrier. The ease—and hence the frequency—with
which this barrier is overcome is inversely related to
E
act
. The thermodynamic parameters that determine
how fast a reaction proceeds thus are the ∆G
F
values for
formation of the transition states through which the re-
action proceeds. For a simple reaction, where ϰ means
“proportionate to,”
(11)
The activation energy for the reaction proceeding in the
opposite direction to that drawn is equal to −∆G
D
.
NUMEROUS FACTORS AFFECT
THE REACTION RATE
The kinetic theory—also called the collision theory—
of chemical kinetics states that for two molecules to
react they must (1) approach within bond-forming dis-
tance of one another, or “collide”; and (2) must possess
sufficient kinetic energy to overcome the energy barrier
for reaching the transition state. It therefore follows
Rate e
E
RT
act
∝
−
ERL RL G G G
FD
+
→
←
+=+−− E ∆∆ ∆
ERL RLLL E G
D
→
←
+−∆
ERL+
→
←
− E R L G
F
LL ∆
ch08.qxd 2/13/2003 2:23 PM Page 61
62 / CHAPTER 8
CBA
Energy barrier
Kinetic energy
0
∞
∞
Number of
molecules
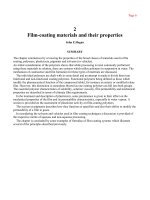
Figure 8–1. The energy barrier for chemical
reactions.
that anything which increases the frequency or energy of
collision between substrates will increase the rate of the
reaction in which they participate.
Temperature
Raising the temperature increases the kinetic energy of
molecules. As illustrated in Figure 8–1, the total num-
ber of molecules whose kinetic energy exceeds the en-
ergy barrier E
act
(vertical bar) for formation of products
increases from low (A), through intermediate (B), to
high (C) temperatures. Increasing the kinetic energy of
molecules also increases their motion and therefore the
frequency with which they collide. This combination of
more frequent and more highly energetic and produc-
tive collisions increases the reaction rate.
Reactant Concentration
The frequency with which molecules collide is directly
proportionate to their concentrations. For two different
molecules A and B, the frequency with which they col-
lide will double if the concentration of either A or B is
doubled. If the concentrations of both A and B are dou-
bled, the probability of collision will increase fourfold.
For a chemical reaction proceeding at constant tem-
perature that involves one molecule each of A and B,
(12)
the number of molecules that possess kinetic energy
sufficient to overcome the activation energy barrier will
be a constant. The number of collisions with sufficient
energy to produce product P therefore will be directly
proportionate to the number of collisions between A
and B and thus to their molar concentrations, denoted
by square brackets.
(13)
Similarly, for the reaction represented by
(14)
ABP+→2
Rate A B∝[][]
AB P+→
which can also be written as
(15)
the corresponding rate expression is
(16)
or
(17)
For the general case when n molecules of A react with
m molecules of B,
(18)
the rate expression is
(19)
Replacing the proportionality constant with an equal
sign by introducing a proportionality or rate constant
k characteristic of the reaction under study gives equa-
tions (20) and (21), in which the subscripts 1 and −1
refer to the rate constants for the forward and reverse
reactions, respectively.
(20)
(21)
K
eq
Is a Ratio of Rate Constants
While all chemical reactions are to some extent re-
versible, at equilibrium the overall concentrations of re-
actants and products remain constant. At equilibrium,
the rate of conversion of substrates to products there-
fore equals the rate at which products are converted to
substrates.
(22)
Therefore,
(23)
and
(24)
The ratio of k
1
to k
−1
is termed the equilibrium con-
stant, K
eq
. The following important properties of a sys-
tem at equilibrium must be kept in mind:
(1)
The equilibrium constant is a ratio of the reaction
rate constants (not the reaction rates).
k
k
P
AB
nm
1
1−
=
[]
[][]
kA B k P
nm
11
[][] []=
−
Rate Rate
11
=
−
Rate k P
−−11
= []
Rate k A B
nm
11
= [][]
Rate A B
nm
∝[][]
nA mB P+→
Rate A B∝[][]
2
Rate A B B∝[][][]
ABB P++→
ch08.qxd 2/13/2003 2:23 PM Page 62
ENZYMES: KINETICS /63
(2)
At equilibrium, the reaction rates (not the rate
constants) of the forward and back reactions are
equal.
(3)
Equilibrium is a dynamic state. Although there is
no net change in the concentration of substrates
or products, individual substrate and product
molecules are continually being interconverted.
(4)
The numeric value of the equilibrium constant
K
eq
can be calculated either from the concentra-
tions of substrates and products at equilibrium or
from the ratio k
1
/k
−1
.
THE KINETICS OF
ENZYMATIC CATALYSIS
Enzymes Lower the Activation Energy
Barrier for a Reaction
All enzymes accelerate reaction rates by providing tran-
sition states with a lowered ∆G
F
for formation of the
transition states. However, they may differ in the way
this is achieved. Where the mechanism or the sequence
of chemical steps at the active site is essentially the same
as those for the same reaction proceeding in the absence
of a catalyst, the environment of the active site lowers
⌬G
F
by stabilizing the transition state intermediates. As
discussed in Chapter 7, stabilization can involve (1)
acid-base groups suitably positioned to transfer protons
to or from the developing transition state intermediate,
(2) suitably positioned charged groups or metal ions
that stabilize developing charges, or (3) the imposition
of steric strain on substrates so that their geometry ap-
proaches that of the transition state. HIV protease (Fig-
ure 7–6) illustrates catalysis by an enzyme that lowers
the activation barrier by stabilizing a transition state in-
termediate.
Catalysis by enzymes that proceeds via a unique re-
action mechanism typically occurs when the transition
state intermediate forms a covalent bond with the en-
zyme (covalent catalysis). The catalytic mechanism of
the serine protease chymotrypsin (Figure 7–7) illus-
trates how an enzyme utilizes covalent catalysis to pro-
vide a unique reaction pathway.
ENZYMES DO NOT AFFECT K
eq
Enzymes accelerate reaction rates by lowering the acti-
vation barrier ∆G
F
. While they may undergo transient
modification during the process of catalysis, enzymes
emerge unchanged at the completion of the reaction.
The presence of an enzyme therefore has no effect on
∆G
0
for the overall reaction, which is a function solely
of the initial and final states of the reactants. Equation
(25) shows the relationship between the equilibrium
constant for a reaction and the standard free energy
change for that reaction:
(25)
If we include the presence of the enzyme (E) in the cal-
culation of the equilibrium constant for a reaction,
(26)
the expression for the equilibrium constant,
(27)
reduces to one identical to that for the reaction in the
absence of the enzyme:
(28)
Enzymes therefore have no effect on K
eq
.
MULTIPLE FACTORS AFFECT THE RATES
OF ENZYME-CATALYZED REACTIONS
Temperature
Raising the temperature increases the rate of both uncat-
alyzed and enzyme-catalyzed reactions by increasing the
kinetic energy and the collision frequency of the react-
ing molecules. However, heat energy can also increase
the kinetic energy of the enzyme to a point that exceeds
the energy barrier for disrupting the noncovalent inter-
actions that maintain the enzyme’s three-dimensional
structure. The polypeptide chain then begins to unfold,
or denature, with an accompanying rapid loss of cat-
alytic activity. The temperature range over which an
enzyme maintains a stable, catalytically competent con-
formation depends upon—and typically moderately
exceeds—the normal temperature of the cells in which
it resides. Enzymes from humans generally exhibit sta-
bility at temperatures up to 45–55 °C. By contrast,
enzymes from the thermophilic microorganisms that re-
side in volcanic hot springs or undersea hydrothermal
vents may be stable up to or above 100 °C.
The Q
10
, or temperature coefficient, is the factor
by which the rate of a biologic process increases for a
10 °C increase in temperature. For the temperatures
over which enzymes are stable, the rates of most bio-
logic processes typically double for a 10 °C rise in tem-
perature (Q
10
= 2). Changes in the rates of enzyme-
catalyzed reactions that accompany a rise or fall in body
temperature constitute a prominent survival feature for
“cold-blooded” life forms such as lizards or fish, whose
body temperatures are dictated by the external environ-
ment. However, for mammals and other homeothermic
organisms, changes in enzyme reaction rates with tem-
perature assume physiologic importance only in cir-
cumstances such as fever or hypothermia.
K
eq
PQ
AB
=
[][ ]
[][]
K
eq
P Q Enz
A B Enz
=
[][ ][ ]
[][][ ]
A B Enz++
→
←
P+Q +Enz
∆GRT
o
eq
=− ln K
ch08.qxd 2/13/2003 2:23 PM Page 63
64 / CHAPTER 8
0
Low High
100
%
X
pH
SH
+
E
–
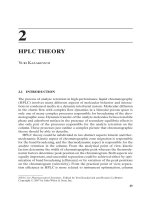
Figure 8–2. Effect of pH on enzyme activity. Con-
sider, for example, a negatively charged enzyme (EH
−
)
that binds a positively charged substrate (SH
+
). Shown
is the proportion (%) of SH
+
[\\\] and of EH
−
[///] as a
function of pH. Only in the cross-hatched area do both
the enzyme and the substrate bear an appropriate
charge.
K
m
V
max
V
max
/2
V
max
/2
v
i
[S]
A
B
C
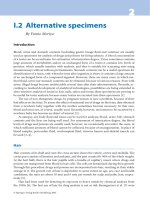
Figure 8–3. Effect of substrate concentration on the
initial velocity of an enzyme-catalyzed reaction.
Hydrogen Ion Concentration
The rate of almost all enzyme-catalyzed reactions ex-
hibits a significant dependence on hydrogen ion con-
centration. Most intracellular enzymes exhibit optimal
activity at pH values between 5 and 9. The relationship
of activity to hydrogen ion concentration (Figure 8–2)
reflects the balance between enzyme denaturation at
high or low pH and effects on the charged state of the
enzyme, the substrates, or both. For enzymes whose
mechanism involves acid-base catalysis, the residues in-
volved must be in the appropriate state of protonation
for the reaction to proceed. The binding and recogni-
tion of substrate molecules with dissociable groups also
typically involves the formation of salt bridges with the
enzyme. The most common charged groups are the
negative carboxylate groups and the positively charged
groups of protonated amines. Gain or loss of critical
charged groups thus will adversely affect substrate bind-
ing and thus will retard or abolish catalysis.
ASSAYS OF ENZYME-CATALYZED
REACTIONS TYPICALLY MEASURE
THE INITIAL VELOCITY
Most measurements of the rates of enzyme-catalyzed re-
actions employ relatively short time periods, conditions
that approximate initial rate conditions. Under these
conditions, only traces of product accumulate, hence
the rate of the reverse reaction is negligible. The initial
velocity (v
i
) of the reaction thus is essentially that of
the rate of the forward reaction. Assays of enzyme activ-
ity almost always employ a large (10
3
–10
7
) molar excess
of substrate over enzyme. Under these conditions, v
i
is
proportionate to the concentration of enzyme. Measur-
ing the initial velocity therefore permits one to estimate
the quantity of enzyme present in a biologic sample.
SUBSTRATE CONCENTRATION AFFECTS
REACTION RATE
In what follows, enzyme reactions are treated as if they
had only a single substrate and a single product. While
most enzymes have more than one substrate, the princi-
ples discussed below apply with equal validity to en-
zymes with multiple substrates.
For a typical enzyme, as substrate concentration is
increased, v
i
increases until it reaches a maximum value
V
max
(Figure 8–3). When further increases in substrate
concentration do not further increase v
i
, the enzyme is
said to be “saturated” with substrate. Note that the
shape of the curve that relates activity to substrate con-
centration (Figure 8–3) is hyperbolic. At any given in-
stant, only substrate molecules that are combined with
the enzyme as an ES complex can be transformed into
product. Second, the equilibrium constant for the for-
mation of the enzyme-substrate complex is not infi-
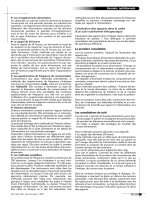
nitely large. Therefore, even when the substrate is pre-
sent in excess (points A and B of Figure 8–4), only a
fraction of the enzyme may be present as an ES com-
plex. At points A or B, increasing or decreasing [S]
therefore will increase or decrease the number of ES
complexes with a corresponding change in v
i
. At point
C (Figure 8–4), essentially all the enzyme is present as
the ES complex. Since no free enzyme remains available
for forming ES, further increases in [S] cannot increase
the rate of the reaction. Under these saturating condi-
tions, v
i
depends solely on—and thus is limited by—
the rapidity with which free enzyme is released to com-
bine with more substrate.
ch08.qxd 2/13/2003 2:23 PM Page 64
ENZYMES: KINETICS /65
ABC
= S
= E
Figure 8–4. Representation of an enzyme at low (A), at high (C), and at a substrate concentration
equal to K
m
(B). Points A, B, and C correspond to those points in Figure 8–3.
THE MICHAELIS-MENTEN & HILL
EQUATIONS MODEL THE EFFECTS
OF SUBSTRATE CONCENTRATION
The Michaelis-Menten Equation
The Michaelis-Menten equation (29) illustrates in
mathematical terms the relationship between initial re-
action velocity v
i
and substrate concentration [S],
shown graphically in Figure 8–3.
(29)
The Michaelis constant K
m
is the substrate concen-
tration at which v
i
is half the maximal velocity
(V
max
/2) attainable at a particular concentration of
enzyme. K
m
thus has the dimensions of substrate con-
centration. The dependence of initial reaction velocity
on [S] and K
m
may be illustrated by evaluating the
Michaelis-Menten equation under three conditions.
(1) When [S] is much less than K
m
(point A in Fig-
ures 8–3 and 8–4), the term K
m
+ [S] is essentially equal
to K
m
. Replacing K
m
+ [S] with K
m
reduces equation
(29) to
(30)
where ≈ means “approximately equal to.” Since V
max
and K
m
are both constants, their ratio is a constant. In
other words, when [S] is considerably below K
m
, v
i
∝
k[S]. The initial reaction velocity therefore is directly
proportionate to [S].
(2) When [S] is much greater than K
m
(point C in
Figures 8–3 and 8–4), the term K
m
+ [S] is essentially
v
V
K
v
V
K
V
K
11
=
+
≈≈
max max max
[]
[]
[]
[]
S
S
S
S
mmm
v
S
S
i
=
+
V
K
max
[]
[]
m
equal to [S]. Replacing K
m
+ [S] with [S] reduces equa-
tion (29) to
(31)
Thus, when [S] greatly exceeds K
m
, the reaction velocity
is maximal (V
max
) and unaffected by further increases in
substrate concentration.
(3) When [S] = K
m
(point B in Figures 8–3 and
8–4).
(32)
Equation (32) states that when [S] equals K
m
, the initial
velocity is half-maximal. Equation (32) also reveals that
K
m
is—and may be determined experimentally from—
the substrate concentration at which the initial velocity
is half-maximal.
A Linear Form of the Michaelis-Menten
Equation Is Used to Determine K
m
& V
max
The direct measurement of the numeric value of V
max
and therefore the calculation of K
m
often requires im-
practically high concentrations of substrate to achieve
saturating conditions. A linear form of the Michaelis-
Menten equation circumvents this difficulty and per-
mits V
max
and K
m
to be extrapolated from initial veloc-
ity data obtained at less than saturating concentrations
of substrate. Starting with equation (29),
(29)
v
S
S
i
=
+
V
K
max
[]
[]
m
v
S
S
S
S
i
m
=
+
==
V
K
VV
max max max
[]
[]
[]
[]22
v
S
S
S
[S]
i
m
=
+
≈≈
V
K
v
V
V
max max
max
[]
[]
[]
i
ch08.qxd 2/13/2003 2:23 PM Page 65
66 / CHAPTER 8
[S]
1
K
m
1
–
v
i
1
V
max
1
V
max
K
m
Slope =
0
Figure 8–5. Double reciprocal or Lineweaver-Burk
plot of 1/v
i
versus 1/[S] used to evaluate K
m
and V
max
.
invert
(33)
factor
(34)
and simplify
(35)
Equation (35) is the equation for a straight line, y = ax
+ b, where y = 1/v
i
and x = 1/[S]. A plot of 1/v
i
as y as a
function of 1/[S] as x therefore gives a straight line
whose y intercept is 1/V
max
and whose slope is K
m
/V
max
.
Such a plot is called a double reciprocal or
Lineweaver-Burk plot (Figure 8–5). Setting the y term
of equation (36) equal to zero and solving for x reveals
that the x intercept is −1/K
m
.
(36)
K
m
is thus most easily calculated from the x intercept.
K
m
May Approximate a Binding Constant
The affinity of an enzyme for its substrate is the inverse
of the dissociation constant K
d
for dissociation of the
enzyme substrate complex ES.
(37)
(38)
K
k
k
d
=
−1
1
ES
k
k
ES+
→
←
1
1−
0 =+ =ax b
m
; therefore, x =
b
a
1−−
K
111
v
S
i
m
=
+
K
VV
max max
[]
1
v
S
S
S
i
m
=+
K
VV
max max
[]
[]
[]
1
v
S
S
1
m
=
+K
V
[]
[]
max
Stated another way, the smaller the tendency of the en-
zyme and its substrate to dissociate, the greater the affin-
ity of the enzyme for its substrate. While the Michaelis
constant K
m
often approximates the dissociation con-
stant K
d
, this is by no means always the case. For a typi-
cal enzyme-catalyzed reaction,
(39)
the value of [S] that gives v
i
= V
max
/2 is
(40)
When k
−1
» k
2
, then
(41)
and
(42)
Hence, 1/K
m
only approximates 1/K
d
under conditions
where the association and dissociation of the ES com-
plex is rapid relative to the rate-limiting step in cataly-
sis. For the many enzyme-catalyzed reactions for which
k
−1
+ k
2
is not approximately equal to k
−1
, 1/K
m
will
underestimate 1/K
d
.
The Hill Equation Describes the Behavior
of Enzymes That Exhibit Cooperative
Binding of Substrate
While most enzymes display the simple saturation ki-
netics depicted in Figure 8–3 and are adequately de-
scribed by the Michaelis-Menten expression, some en-
zymes bind their substrates in a cooperative fashion
analogous to the binding of oxygen by hemoglobin
(Chapter 6). Cooperative behavior may be encountered
for multimeric enzymes that bind substrate at multiple
sites. For enzymes that display positive cooperativity in
binding substrate, the shape of the curve that relates
changes in v
i
to changes in [S] is sigmoidal (Figure
8–6). Neither the Michaelis-Menten expression nor its
derived double-reciprocal plots can be used to evaluate
cooperative saturation kinetics. Enzymologists therefore
employ a graphic representation of the Hill equation
originally derived to describe the cooperative binding of
O
2
by hemoglobin. Equation (43) represents the Hill
equation arranged in a form that predicts a straight line,
where k′ is a complex constant.
[]S
k
k
≈≈
1
1−
K
d
kkk
−−12 1
+≈
[]S
kk
k
m
=
+
=
−12
1
K
ES
k
k
ES
k
EP+
→
←
→
+
1
1
2
−
ch08.qxd 2/13/2003 2:23 PM Page 66
ENZYMES: KINETICS /67
Log [S]
S
50
1
Slope = n
0
– 1
– 4 – 3
Log
v
i
V
max
– v
i
Figure 8–7. A graphic representation of a linear
form of the Hill equation is used to evaluate S
50
, the
substrate concentration that produces half-maximal
velocity, and the degree of cooperativity n.
[S]
v
i
0
∞
∞
Figure 8–6. Representation of sigmoid substrate
saturation kinetics.
(43)
Equation (43) states that when [S] is low relative to k′,
the initial reaction velocity increases as the nth power
of [S].
A graph of log v
i
/(V
max
− v
i
) versus log[S] gives a
straight line (Figure 8–7), where the slope of the line n
is the Hill coefficient, an empirical parameter whose
value is a function of the number, kind, and strength of
the interactions of the multiple substrate-binding sites
on the enzyme. When n = 1, all binding sites behave in-
dependently, and simple Michaelis-Menten kinetic be-
havior is observed. If n is greater than 1, the enzyme is
said to exhibit positive cooperativity. Binding of the
log
log
v
log[S] k
1
max
V −
−′
v
n
1
=
first substrate molecule then enhances the affinity of the
enzyme for binding additional substrate. The greater
the value for n, the higher the degree of cooperativity
and the more sigmoidal will be the plot of v
i
versus [S].
A perpendicular dropped from the point where the y
term log v
i
/(V
max
− v
i
) is zero intersects the x axis at a
substrate concentration termed S
50
, the substrate con-
centration that results in half-maximal velocity. S
50
thus
is analogous to the P
50
for oxygen binding to hemoglo-
bin (Chapter 6).
KINETIC ANALYSIS DISTINGUISHES
COMPETITIVE FROM
NONCOMPETITIVE INHIBITION
Inhibitors of the catalytic activities of enzymes provide
both pharmacologic agents and research tools for study
of the mechanism of enzyme action. Inhibitors can be
classified based upon their site of action on the enzyme,
on whether or not they chemically modify the enzyme,
or on the kinetic parameters they influence. Kinetically,
we distinguish two classes of inhibitors based upon
whether raising the substrate concentration does or
does not overcome the inhibition.
Competitive Inhibitors Typically
Resemble Substrates
The effects of competitive inhibitors can be overcome
by raising the concentration of the substrate. Most fre-
quently, in competitive inhibition the inhibitor, I,
binds to the substrate-binding portion of the active site
and blocks access by the substrate. The structures of
most classic competitive inhibitors therefore tend to re-
semble the structures of a substrate and thus are termed
substrate analogs. Inhibition of the enzyme succinate
dehydrogenase by malonate illustrates competitive inhi-
bition by a substrate analog. Succinate dehydrogenase
catalyzes the removal of one hydrogen atom from each
of the two methylene carbons of succinate (Figure 8–8).
Both succinate and its structural analog malonate
(
−
OOCCH
2
COO
−
) can bind to the active site of
succinate dehydrogenase, forming an ES or an EI com-
plex, respectively. However, since malonate contains
HC
H
H
SUCCINATE
DEHYDROGENASE
–2H
C COO
–
H
–
OOC HC
C COO
–
H
–
OOC
Succinate Fumarate
Figure 8–8. The succinate dehydrogenase reaction.
ch08.qxd 2/13/2003 2:23 PM Page 67
68 / CHAPTER 8
[S]
1
K
m
1
–
K′
m
1
–
v
i
1
V
max
1
0
+ Inhibitor
No inhibitor
Figure 8–9. Lineweaver-Burk plot of competitive in-
hibition. Note the complete relief of inhibition at high
[S] (ie, low 1/[S]).
only one methylene carbon, it cannot undergo dehy-
drogenation. The formation and dissociation of the EI
complex is a dynamic process described by
(44)
for which the equilibrium constant K
i
is
(45)
In effect, a competitive inhibitor acts by decreasing
the number of free enzyme molecules available to
bind substrate, ie, to form ES, and thus eventually
to form product, as described below:
(46)
A competitive inhibitor and substrate exert reciprocal
effects on the concentration of the EI and ES com-
plexes. Since binding substrate removes free enzyme
available to combine with inhibitor, increasing the [S]
decreases the concentration of the EI complex and
raises the reaction velocity. The extent to which [S]
must be increased to completely overcome the inhibi-
tion depends upon the concentration of inhibitor pre-
sent, its affinity for the enzyme K
i
, and the K
m
of the
enzyme for its substrate.
Double Reciprocal Plots Facilitate the
Evaluation of Inhibitors
Double reciprocal plots distinguish between competi-
tive and noncompetitive inhibitors and simplify evalua-
tion of inhibition constants K
i
. v
i
is determined at sev-
eral substrate concentrations both in the presence and
in the absence of inhibitor. For classic competitive inhi-
bition, the lines that connect the experimental data
points meet at the y axis (Figure 8–9). Since the y inter-
cept is equal to 1/V
max
, this pattern indicates that when
1/[S] approaches 0, v
i
is independent of the presence
of inhibitor. Note, however, that the intercept on the
x axis does vary with inhibitor concentration—and that
since −1/K
m
′ is smaller than 1/K
m
, K
m
′ (the “apparent
K
m
”) becomes larger in the presence of increasing con-
centrations of inhibitor. Thus, a competitive inhibitor
has no effect on V
max
but raises K ′
m
, the apparent
K
m
for the substrate.
E
E-S
E + P
E-I
± I
± S
K
Enz I
EnzI
k
k
1
1
1
==
[][]
[]
−
EnzI
k
k
Enz I
1
1
→
←
+
−
For simple competitive inhibition, the intercept on
the x axis is
(47)
Once K
m
has been determined in the absence of in-
hibitor, K
i
can be calculated from equation (47). K
i
val-
ues are used to compare different inhibitors of the same
enzyme. The lower the value for K
i
, the more effective
the inhibitor. For example, the statin drugs that act as
competitive inhibitors of HMG-CoA reductase (Chap-
ter 26) have K
i
values several orders of magnitude lower
than the K
m
for the substrate HMG-CoA.
Simple Noncompetitive Inhibitors Lower
V
max
but Do Not Affect K
m
In noncompetitive inhibition, binding of the inhibitor
does not affect binding of substrate. Formation of both
EI and EIS complexes is therefore possible. However,
while the enzyme-inhibitor complex can still bind sub-
strate, its efficiency at transforming substrate to prod-
uct, reflected by V
max
, is decreased. Noncompetitive
inhibitors bind enzymes at sites distinct from the sub-
strate-binding site and generally bear little or no struc-
tural resemblance to the substrate.
For simple noncompetitive inhibition, E and EI
possess identical affinity for substrate, and the EIS com-
plex generates product at a negligible rate (Figure 8–10).
More complex noncompetitive inhibition occurs when
binding of the inhibitor does affect the apparent affinity
of the enzyme for substrate, causing the lines to inter-
cept in either the third or fourth quadrants of a double
reciprocal plot (not shown).
x
I
mi
=+
−1
1
K
[]
K
ch08.qxd 2/13/2003 2:23 PM Page 68
ENZYMES: KINETICS /69
[S]
1
K
m
1
–
V ′
max
1
–
v
i
1
V
max
1
0
+ Inhibitor
No inhibitor
Figure 8–10. Lineweaver-Burk plot for simple non-
competitive inhibition.
EAB-EPQ
EAB-EPQ
F FB-EQ EEA-FPE
A
A
AB PQ
B
B
A
P
EQ
EP
EA
EB
Q
Q
P
PBQ
EE
EQ EEAE
Figure 8–11. Representations of three classes of Bi-
Bi reaction mechanisms. Horizontal lines represent the
enzyme. Arrows indicate the addition of substrates and
departure of products. Top: An ordered Bi-Bi reaction,
characteristic of many NAD(P)H-dependent oxidore-
ductases. Center: A random Bi-Bi reaction, characteris-
tic of many kinases and some dehydrogenases. Bot-
tom: A ping-pong reaction, characteristic of
aminotransferases and serine proteases.
Irreversible Inhibitors “Poison” Enzymes
In the above examples, the inhibitors form a dissocia-
ble, dynamic complex with the enzyme. Fully active en-
zyme can therefore be recovered simply by removing
the inhibitor from the surrounding medium. However,
a variety of other inhibitors act irreversibly by chemi-
cally modifying the enzyme. These modifications gen-
erally involve making or breaking covalent bonds with
aminoacyl residues essential for substrate binding, catal-
ysis, or maintenance of the enzyme’s functional confor-
mation. Since these covalent changes are relatively sta-
ble, an enzyme that has been “poisoned” by an
irreversible inhibitor remains inhibited even after re-
moval of the remaining inhibitor from the surrounding
medium.
MOST ENZYME-CATALYZED REACTIONS
INVOLVE TWO OR MORE SUBSTRATES
While many enzymes have a single substrate, many oth-
ers have two—and sometimes more than two—sub-
strates and products. The fundamental principles dis-
cussed above, while illustrated for single-substrate
enzymes, apply also to multisubstrate enzymes. The
mathematical expressions used to evaluate multisub-
strate reactions are, however, complex. While detailed
kinetic analysis of multisubstrate reactions exceeds the
scope of this chapter, two-substrate, two-product reac-
tions (termed “Bi-Bi” reactions) are considered below.
Sequential or Single
Displacement Reactions
In sequential reactions, both substrates must combine
with the enzyme to form a ternary complex before
catalysis can proceed (Figure 8–11, top). Sequential re-
actions are sometimes referred to as single displacement
reactions because the group undergoing transfer is usu-
ally passed directly, in a single step, from one substrate
to the other. Sequential Bi-Bi reactions can be further
distinguished based on whether the two substrates add
in a random or in a compulsory order. For random-
order reactions, either substrate A or substrate B may
combine first with the enzyme to form an EA or an EB
complex (Figure 8–11, center). For compulsory-order
reactions, A must first combine with E before B can
combine with the EA complex. One explanation for a
compulsory-order mechanism is that the addition of A
induces a conformational change in the enzyme that
aligns residues which recognize and bind B.
Ping-Pong Reactions
The term “ping-pong” applies to mechanisms in
which one or more products are released from the en-
zyme before all the substrates have been added. Ping-
pong reactions involve covalent catalysis and a tran-
sient, modified form of the enzyme (Figure 7–4).
Ping-pong Bi-Bi reactions are double displacement re-
actions. The group undergoing transfer is first dis-
placed from substrate A by the enzyme to form product
ch08.qxd 2/13/2003 2:23 PM Page 69
70 / CHAPTER 8
Increasing
[S
2
]
1
v
i
1
S
1
Figure 8–12. Lineweaver-Burk plot for a two-sub-
strate ping-pong reaction. An increase in concentra-
tion of one substrate (S
1
) while that of the other sub-
strate (S
2
) is maintained constant changes both the x
and y intercepts, but not the slope.
P and a modified form of the enzyme (F). The subse-
quent group transfer from F to the second substrate B,
forming product Q and regenerating E, constitutes the
second displacement (Figure 8–11, bottom).
Most Bi-Bi Reactions Conform to
Michaelis-Menten Kinetics
Most Bi-Bi reactions conform to a somewhat more
complex form of Michaelis-Menten kinetics in which
V
max
refers to the reaction rate attained when both sub-
strates are present at saturating levels. Each substrate
has its own characteristic K
m
value which corresponds
to the concentration that yields half-maximal velocity
when the second substrate is present at saturating levels.
As for single-substrate reactions, double-reciprocal plots
can be used to determine V
max
and K
m
. v
i
is measured as
a function of the concentration of one substrate (the
variable substrate) while the concentration of the other
substrate (the fixed substrate) is maintained constant. If
the lines obtained for several fixed-substrate concentra-
tions are plotted on the same graph, it is possible to dis-
tinguish between a ping-pong enzyme, which yields
parallel lines, and a sequential mechanism, which yields
a pattern of intersecting lines (Figure 8–12).
Product inhibition studies are used to complement
kinetic analyses and to distinguish between ordered and
random Bi-Bi reactions. For example, in a random-
order Bi-Bi reaction, each product will be a competitive
inhibitor regardless of which substrate is designated the
variable substrate. However, for a sequential mecha-
nism (Figure 8–11, bottom), only product Q will give
the pattern indicative of competitive inhibition when A
is the variable substrate, while only product P will pro-
duce this pattern with B as the variable substrate. The
other combinations of product inhibitor and variable
substrate will produce forms of complex noncompeti-
tive inhibition.
SUMMARY
• The study of enzyme kinetics—the factors that affect
the rates of enzyme-catalyzed reactions—reveals the
individual steps by which enzymes transform sub-
strates into products.
• ∆G, the overall change in free energy for a reaction,
is independent of reaction mechanism and provides
no information concerning rates of reactions.
• Enzymes do not affect K
eq
. K
eq
, a ratio of reaction
rate constants, may be calculated from the concentra-
tions of substrates and products at equilibrium or
from the ratio k
1
/k
−1
.
• Reactions proceed via transition states in which ∆G
F
is the activation energy. Temperature, hydrogen ion
concentration, enzyme concentration, substrate con-
centration, and inhibitors all affect the rates of en-
zyme-catalyzed reactions.
• A measurement of the rate of an enzyme-catalyzed
reaction generally employs initial rate conditions, for
which the essential absence of product precludes the
reverse reaction.
• A linear form of the Michaelis-Menten equation sim-
plifies determination of K
m
and V
max
.
• A linear form of the Hill equation is used to evaluate
the cooperative substrate-binding kinetics exhibited
by some multimeric enzymes. The slope n, the Hill
coefficient, reflects the number, nature, and strength
of the interactions of the substrate-binding sites. A
ch08.qxd 2/13/2003 2:23 PM Page 70
value of n greater than 1 indicates positive coopera-
tivity.
• The effects of competitive inhibitors, which typically
resemble substrates, are overcome by raising the con-
centration of the substrate. Noncompetitive in-
hibitors lower V
max
but do not affect K
m
.
• Substrates may add in a random order (either sub-
strate may combine first with the enzyme) or in a
compulsory order (substrate A must bind before sub-
strate B).
• In ping-pong reactions, one or more products are re-
leased from the enzyme before all the substrates have
added.
REFERENCES
Fersht A: Structure and Mechanism in Protein Science: A Guide to
Enzyme Catalysis and Protein Folding. Freeman, 1999.
Schultz AR: Enzyme Kinetics: From Diastase to Multi-enzyme Sys-
tems. Cambridge Univ Press, 1994.
Segel IH: Enzyme Kinetics. Wiley Interscience, 1975.
ENZYMES: KINETICS /71
ch08.qxd 2/13/2003 2:23 PM Page 71
Enzymes: Regulation of Activities
9
72
Victor W. Rodwell, PhD, & Peter J. Kennelly, PhD
BIOMEDICAL IMPORTANCE
The 19th-century physiologist Claude Bernard enunci-
ated the conceptual basis for metabolic regulation. He
observed that living organisms respond in ways that are
both quantitatively and temporally appropriate to per-
mit them to survive the multiple challenges posed by
changes in their external and internal environments.
Walter Cannon subsequently coined the term “homeo-
stasis” to describe the ability of animals to maintain a
constant intracellular environment despite changes in
their external environment. We now know that organ-
isms respond to changes in their external and internal
environment by balanced, coordinated changes in the
rates of specific metabolic reactions. Many human dis-
eases, including cancer, diabetes, cystic fibrosis, and
Alzheimer’s disease, are characterized by regulatory dys-
functions triggered by pathogenic agents or genetic mu-
tations. For example, many oncogenic viruses elaborate
protein-tyrosine kinases that modify the regulatory
events which control patterns of gene expression, con-
tributing to the initiation and progression of cancer. The
toxin from Vibrio cholerae, the causative agent of cholera,
disables sensor-response pathways in intestinal epithelial
cells by ADP-ribosylating the GTP-binding proteins
(G-proteins) that link cell surface receptors to adenylyl
cyclase. The consequent activation of the cyclase triggers
the flow of water into the intestines, resulting in massive
diarrhea and dehydration. Yersinia pestis, the causative
agent of plague, elaborates a protein-tyrosine phos-
phatase that hydrolyzes phosphoryl groups on key cy-
toskeletal proteins. Knowledge of factors that control the
rates of enzyme-catalyzed reactions thus is essential to an
understanding of the molecular basis of disease. This
chapter outlines the patterns by which metabolic
processes are controlled and provides illustrative exam-
ples. Subsequent chapters provide additional examples.
REGULATION OF METABOLITE FLOW
CAN BE ACTIVE OR PASSIVE
Enzymes that operate at their maximal rate cannot re-
spond to an increase in substrate concentration, and
can respond only to a precipitous decrease in substrate
concentration. For most enzymes, therefore, the aver-
age intracellular concentration of their substrate tends
to be close to the K
m
value, so that changes in substrate
concentration generate corresponding changes in me-
tabolite flux (Figure 9–1). Responses to changes in sub-
strate level represent an important but passive means for
coordinating metabolite flow and maintaining homeo-
stasis in quiescent cells. However, they offer limited
scope for responding to changes in environmental vari-
ables. The mechanisms that regulate enzyme activity in
an active manner in response to internal and external
signals are discussed below.
Metabolite Flow Tends
to Be Unidirectional
Despite the existence of short-term oscillations in
metabolite concentrations and enzyme levels, living
cells exist in a dynamic steady state in which the mean
concentrations of metabolic intermediates remain rela-
tively constant over time (Figure 9–2). While all chemi-
cal reactions are to some extent reversible, in living cells
the reaction products serve as substrates for—and are
removed by—other enzyme-catalyzed reactions. Many
nominally reversible reactions thus occur unidirection-
ally. This succession of coupled metabolic reactions is
accompanied by an overall change in free energy that
favors unidirectional metabolite flow (Chapter 10). The
unidirectional flow of metabolites through a pathway
with a large overall negative change in free energy is
analogous to the flow of water through a pipe in which
one end is lower than the other. Bends or kinks in the
pipe simulate individual enzyme-catalyzed steps with a
small negative or positive change in free energy. Flow of
water through the pipe nevertheless remains unidirec-
tional due to the overall change in height, which corre-
sponds to the overall change in free energy in a pathway
(Figure 9–3).
COMPARTMENTATION ENSURES
METABOLIC EFFICIENCY
& SIMPLIFIES REGULATION
In eukaryotes, anabolic and catabolic pathways that in-
terconvert common products may take place in specific
subcellular compartments. For example, many of the
enzymes that degrade proteins and polysaccharides re-
side inside organelles called lysosomes. Similarly, fatty
acid biosynthesis occurs in the cytosol, whereas fatty
ch09.qxd 2/13/2003 2:27 PM Page 72
ENZYMES: REGULATION OF ACTIVITIES /73
∆S
K
m
∆V
A
∆V
B
[ S ]
∆S
V
Figure 9–1. Differential response of the rate of an
enzyme-catalyzed reaction, ∆V, to the same incremen-
tal change in substrate concentration at a substrate
concentration of K
m
(∆V
A
) or far above K
m
(∆V
B
).
B
A
Figure 9–3. Hydrostatic analogy for a pathway with
a rate-limiting step (A) and a step with a ∆G value near
zero (B).
acid oxidation takes place within mitochondria (Chap-
ters 21 and 22). Segregation of certain metabolic path-
ways within specialized cell types can provide further
physical compartmentation. Alternatively, possession of
one or more unique intermediates can permit apparently
opposing pathways to coexist even in the absence of
physical barriers. For example, despite many shared in-
termediates and enzymes, both glycolysis and gluconeo-
genesis are favored energetically. This cannot be true if
all the reactions were the same. If one pathway was fa-
vored energetically, the other would be accompanied by
a change in free energy G equal in magnitude but op-
posite in sign. Simultaneous spontaneity of both path-
ways results from substitution of one or more reactions
by different reactions favored thermodynamically in the
opposite direction. The glycolytic enzyme phospho-
fructokinase (Chapter 17) is replaced by the gluco-
neogenic enzyme fructose-1,6-bisphosphatase (Chapter
19). The ability of enzymes to discriminate between the
structurally similar coenzymes NAD
+
and NADP
+
also
results in a form of compartmentation, since it segre-
gates the electrons of NADH that are destined for ATP
generation from those of NADPH that participate in
the reductive steps in many biosynthetic pathways.
Controlling an Enzyme That Catalyzes
a Rate-Limiting Reaction Regulates
an Entire Metabolic Pathway
While the flux of metabolites through metabolic path-
ways involves catalysis by numerous enzymes, active
control of homeostasis is achieved by regulation of only
a small number of enzymes. The ideal enzyme for regu-
latory intervention is one whose quantity or catalytic ef-
ficiency dictates that the reaction it catalyzes is slow rel-
ative to all others in the pathway. Decreasing the
catalytic efficiency or the quantity of the catalyst for the
“bottleneck” or rate-limiting reaction immediately re-
duces metabolite flux through the entire pathway. Con-
versely, an increase in either its quantity or catalytic ef-
ficiency enhances flux through the pathway as a whole.
For example, acetyl-CoA carboxylase catalyzes the syn-
thesis of malonyl-CoA, the first committed reaction of
fatty acid biosynthesis (Chapter 21). When synthesis of
malonyl-CoA is inhibited, subsequent reactions of fatty
acid synthesis cease due to lack of substrates. Enzymes
that catalyze rate-limiting steps serve as natural “gover-
nors” of metabolic flux. Thus, they constitute efficient
targets for regulatory intervention by drugs. For exam-
ple, inhibition by “statin” drugs of HMG-CoA reduc-
tase, which catalyzes the rate-limiting reaction of cho-
lesterogenesis, curtails synthesis of cholesterol.
REGULATION OF ENZYME QUANTITY
The catalytic capacity of the rate-limiting reaction in a
metabolic pathway is the product of the concentration
of enzyme molecules and their intrinsic catalytic effi-
ciency. It therefore follows that catalytic capacity can be
Nutrients Wastes
Small
molecules
Small
molecules
Small
molecules
Large
molecules
~
P
~
P
Figure 9–2. An idealized cell in steady state. Note
that metabolite flow is unidirectional.
ch09.qxd 2/13/2003 2:27 PM Page 73
74 / CHAPTER 9
influenced both by changing the quantity of enzyme
present and by altering its intrinsic catalytic efficiency.
Control of Enzyme Synthesis
Enzymes whose concentrations remain essentially con-
stant over time are termed constitutive enzymes. By
contrast, the concentrations of many other enzymes de-
pend upon the presence of inducers, typically sub-
strates or structurally related compounds, that initiate
their synthesis. Escherichia coli grown on glucose will,
for example, only catabolize lactose after addition of a
β-galactoside, an inducer that initiates synthesis of a
β-galactosidase and a galactoside permease (Figure 39–3).
Inducible enzymes of humans include tryptophan pyr-
rolase, threonine dehydrase, tyrosine-α-ketoglutarate
aminotransferase, enzymes of the urea cycle, HMG-CoA
reductase, and cytochrome P450. Conversely, an excess
of a metabolite may curtail synthesis of its cognate
enzyme via repression. Both induction and repression
involve cis elements, specific DNA sequences located up-
stream of regulated genes, and trans-acting regulatory
proteins. The molecular mechanisms of induction and
repression are discussed in Chapter 39.
Control of Enzyme Degradation
The absolute quantity of an enzyme reflects the net bal-
ance between enzyme synthesis and enzyme degrada-
tion, where k
s
and k
deg
represent the rate constants for
the overall processes of synthesis and degradation, re-
spectively. Changes in both the k
s
and k
deg
of specific
enzymes occur in human subjects.
Protein turnover represents the net result of en-
zyme synthesis and degradation. By measuring the rates
of incorporation of
15
N-labeled amino acids into pro-
tein and the rates of loss of
15
N from protein, Schoen-
heimer deduced that body proteins are in a state of “dy-
namic equilibrium” in which they are continuously
synthesized and degraded. Mammalian proteins are de-
graded both by ATP and ubiquitin-dependent path-
ways and by ATP-independent pathways (Chapter 29).
Susceptibility to proteolytic degradation can be influ-
enced by the presence of ligands such as substrates,
coenzymes, or metal ions that alter protein conforma-
tion. Intracellular ligands thus can influence the rates at
which specific enzymes are degraded.
Enzyme
Amino acids
k
s
k
deg
Enzyme levels in mammalian tissues respond to a
wide range of physiologic, hormonal, or dietary factors.
For example, glucocorticoids increase the concentration
of tyrosine aminotransferase by stimulating k
s
, and
glucagon—despite its antagonistic physiologic effects—
increases k
s
fourfold to fivefold. Regulation of liver
arginase can involve changes either in k
s
or in k
deg
. After
a protein-rich meal, liver arginase levels rise and argi-
nine synthesis decreases (Chapter 29). Arginase levels
also rise in starvation, but here arginase degradation de-
creases, whereas k
s
remains unchanged. Similarly, injec-
tion of glucocorticoids and ingestion of tryptophan
both elevate levels of tryptophan oxygenase. While the
hormone raises k
s
for oxygenase synthesis, tryptophan
specifically lowers k
deg
by stabilizing the oxygenase
against proteolytic digestion.
MULTIPLE OPTIONS ARE AVAILABLE FOR
REGULATING CATALYTIC ACTIVITY
In humans, the induction of protein synthesis is a com-
plex multistep process that typically requires hours to
produce significant changes in overall enzyme level. By
contrast, changes in intrinsic catalytic efficiency ef-
fected by binding of dissociable ligands (allosteric reg-
ulation) or by covalent modification achieve regula-
tion of enzymic activity within seconds. Changes in
protein level serve long-term adaptive requirements,
whereas changes in catalytic efficiency are best suited
for rapid and transient alterations in metabolite flux.
ALLOSTERIC EFFECTORS REGULATE
CERTAIN ENZYMES
Feedback inhibition refers to inhibition of an enzyme
in a biosynthetic pathway by an end product of that
pathway. For example, for the biosynthesis of D from A
catalyzed by enzymes Enz
1
through Enz
3
,
high concentrations of D inhibit conversion of A to B.
Inhibition results not from the “backing up” of inter-
mediates but from the ability of D to bind to and in-
hibit Enz
1
. Typically, D binds at an allosteric site spa-
tially distinct from the catalytic site of the target
enzyme. Feedback inhibitors thus are allosteric effectors
and typically bear little or no structural similarity to the
substrates of the enzymes they inhibit. In this example,
the feedback inhibitor D acts as a negative allosteric
effector of Enz
1
.
Enz Enz
23
Enz
ABCD
1
→→→
ch09.qxd 2/13/2003 2:27 PM Page 74
ENZYMES: REGULATION OF ACTIVITIES /75
S
1
S
2
S
3
S
4
S
5
A B
D
C
Figure 9–4. Sites of feedback inhibition in a
branched biosynthetic pathway. S
1
–S
5
are intermedi-
ates in the biosynthesis of end products A–D. Straight
arrows represent enzymes catalyzing the indicated con-
versions. Curved arrows represent feedback loops and
indicate sites of feedback inhibition by specific end
products.
S
1
S
2
S
3
S
4
S
5
A B
D
C
Figure 9–5. Multiple feedback inhibition in a
branched biosynthetic pathway. Superimposed on sim-
ple feedback loops (dashed, curved arrows) are multi-
ple feedback loops (solid, curved arrows) that regulate
enzymes common to biosynthesis of several end prod-
ucts.
In a branched biosynthetic pathway, the initial reac-
tions participate in the synthesis of several products.
Figure 9–4 shows a hypothetical branched biosynthetic
pathway in which curved arrows lead from feedback in-
hibitors to the enzymes whose activity they inhibit. The
sequences S
3
→ A, S
4
→ B, S
4
→ C, and S
3
→→D
each represent linear reaction sequences that are feed-
back-inhibited by their end products. The pathways of
nucleotide biosynthesis (Chapter 34) provide specific
examples.
The kinetics of feedback inhibition may be competi-
tive, noncompetitive, partially competitive, or mixed.
Feedback inhibitors, which frequently are the small
molecule building blocks of macromolecules (eg, amino
acids for proteins, nucleotides for nucleic acids), typi-
cally inhibit the first committed step in a particular
biosynthetic sequence. A much-studied example is inhi-
bition of bacterial aspartate transcarbamoylase by CTP
(see below and Chapter 34).
Multiple feedback loops can provide additional fine
control. For example, as shown in Figure 9–5, the pres-
ence of excess product B decreases the requirement for
substrate S
2
. However, S
2
is also required for synthesis
of A, C, and D. Excess B should therefore also curtail
synthesis of all four end products. To circumvent this
potential difficulty, each end product typically only
partially inhibits catalytic activity. The effect of an ex-
cess of two or more end products may be strictly addi-
tive or, alternatively, may be greater than their individ-
ual effect (cooperative feedback inhibition).
Aspartate Transcarbamoylase Is a Model
Allosteric Enzyme
Aspartate transcarbamoylase (ATCase), the catalyst for
the first reaction unique to pyrimidine biosynthesis
(Figure 34–7), is feedback-inhibited by cytidine tri-
phosphate (CTP). Following treatment with mercuri-
als, ATCase loses its sensitivity to inhibition by CTP
but retains its full activity for synthesis of carbamoyl as-
partate. This suggests that CTP is bound at a different
(allosteric) site from either substrate. ATCase consists
of multiple catalytic and regulatory subunits. Each cat-
alytic subunit contains four aspartate (substrate) sites
and each regulatory subunit at least two CTP (regula-
tory) sites (Chapter 34).
Allosteric & Catalytic Sites Are
Spatially Distinct
The lack of structural similarity between a feedback in-
hibitor and the substrate for the enzyme whose activity
it regulates suggests that these effectors are not isosteric
with a substrate but allosteric (“occupy another
space”). Jacques Monod therefore proposed the exis-
tence of allosteric sites that are physically distinct from
the catalytic site. Allosteric enzymes thus are those
whose activity at the active site may be modulated by
the presence of effectors at an allosteric site. This hy-
pothesis has been confirmed by many lines of evidence,
including x-ray crystallography and site-directed muta-
genesis, demonstrating the existence of spatially distinct
active and allosteric sites on a variety of enzymes.
Allosteric Effects May Be on K
m
or on V
max
To refer to the kinetics of allosteric inhibition as “com-
petitive” or “noncompetitive” with substrate carries
misleading mechanistic implications. We refer instead
to two classes of regulated enzymes: K-series and V-se-
ries enzymes. For K-series allosteric enzymes, the sub-
strate saturation kinetics are competitive in the sense
that K
m
is raised without an effect on V
max
. For V-series
allosteric enzymes, the allosteric inhibitor lowers V
max
ch09.qxd 2/13/2003 2:27 PM Page 75
76 / CHAPTER 9
without affecting the K
m
. Alterations in K
m
or V
max
probably result from conformational changes at the cat-
alytic site induced by binding of the allosteric effector
at the allosteric site. For a K-series allosteric enzyme,
this conformational change may weaken the bonds be-
tween substrate and substrate-binding residues. For a
V-series allosteric enzyme, the primary effect may be to
alter the orientation or charge of catalytic residues, low-
ering V
max
. Intermediate effects on K
m
and V
max
, how-
ever, may be observed consequent to these conforma-
tional changes.
FEEDBACK REGULATION
IS NOT SYNONYMOUS WITH
FEEDBACK INHIBITION
In both mammalian and bacterial cells, end products
“feed back” and control their own synthesis, in many
instances by feedback inhibition of an early biosyn-
thetic enzyme. We must, however, distinguish between
feedback regulation, a phenomenologic term devoid
of mechanistic implications, and feedback inhibition,
a mechanism for regulation of enzyme activity. For ex-
ample, while dietary cholesterol decreases hepatic syn-
thesis of cholesterol, this feedback regulation does not
involve feedback inhibition. HMG-CoA reductase, the
rate-limiting enzyme of cholesterologenesis, is affected,
but cholesterol does not feedback-inhibit its activity.
Regulation in response to dietary cholesterol involves
curtailment by cholesterol or a cholesterol metabolite of
the expression of the gene that encodes HMG-CoA re-
ductase (enzyme repression) (Chapter 26).
MANY HORMONES ACT THROUGH
ALLOSTERIC SECOND MESSENGERS
Nerve impulses—and binding of hormones to cell sur-
face receptors—elicit changes in the rate of enzyme-
catalyzed reactions within target cells by inducing the re-
lease or synthesis of specialized allosteric effectors called
second messengers. The primary or “first” messenger is
the hormone molecule or nerve impulse. Second mes-
sengers include 3′,5′-cAMP, synthesized from ATP by
the enzyme adenylyl cyclase in response to the hormone
epinephrine, and Ca
2+
, which is stored inside the endo-
plasmic reticulum of most cells. Membrane depolariza-
tion resulting from a nerve impulse opens a membrane
channel that releases calcium ion into the cytoplasm,
where it binds to and activates enzymes involved in the
regulation of contraction and the mobilization of stored
glucose from glycogen. Glucose then supplies the in-
creased energy demands of muscle contraction. Other
second messengers include 3′,5′-cGMP and polyphos-
phoinositols, produced by the hydrolysis of inositol
phospholipids by hormone-regulated phospholipases.
REGULATORY COVALENT
MODIFICATIONS CAN BE
REVERSIBLE OR IRREVERSIBLE
In mammalian cells, the two most common forms of
covalent modification are partial proteolysis and
phosphorylation. Because cells lack the ability to re-
unite the two portions of a protein produced by hydrol-
ysis of a peptide bond, proteolysis constitutes an irre-
versible modification. By contrast, phosphorylation is a
reversible modification process. The phosphorylation of
proteins on seryl, threonyl, or tyrosyl residues, catalyzed
by protein kinases, is thermodynamically spontaneous.
Equally spontaneous is the hydrolytic removal of these
phosphoryl groups by enzymes called protein phos-
phatases.
PROTEASES MAY BE SECRETED AS
CATALYTICALLY INACTIVE PROENZYMES
Certain proteins are synthesized and secreted as inactive
precursor proteins known as proproteins. The propro-
teins of enzymes are termed proenzymes or zymogens.
Selective proteolysis converts a proprotein by one or
more successive proteolytic “clips” to a form that ex-
hibits the characteristic activity of the mature protein,
eg, its enzymatic activity. Proteins synthesized as pro-
proteins include the hormone insulin (proprotein =
proinsulin), the digestive enzymes pepsin, trypsin, and
chymotrypsin (proproteins = pepsinogen, trypsinogen,
and chymotrypsinogen, respectively), several factors of
the blood clotting and blood clot dissolution cascades
(see Chapter 51), and the connective tissue protein col-
lagen (proprotein = procollagen).
Proenzymes Facilitate Rapid
Mobilization of an Activity in Response
to Physiologic Demand
The synthesis and secretion of proteases as catalytically
inactive proenzymes protects the tissue of origin (eg,
the pancreas) from autodigestion, such as can occur in
pancreatitis. Certain physiologic processes such as di-
gestion are intermittent but fairly regular and pre-
dictable. Others such as blood clot formation, clot dis-
solution, and tissue repair are brought “on line” only in
response to pressing physiologic or pathophysiologic
need. The processes of blood clot formation and dis-
solution clearly must be temporally coordinated to
achieve homeostasis. Enzymes needed intermittently
but rapidly often are secreted in an initially inactive
form since the secretion process or new synthesis of the
required proteins might be insufficiently rapid for re-
sponse to a pressing pathophysiologic demand such as
the loss of blood.
ch09.qxd 2/13/2003 2:27 PM Page 76
ENZYMES: REGULATION OF ACTIVITIES /77
Activation of Prochymotrypsin
Requires Selective Proteolysis
Selective proteolysis involves one or more highly spe-
cific proteolytic clips that may or may not be accompa-
nied by separation of the resulting peptides. Most im-
portantly, selective proteolysis often results in
conformational changes that “create” the catalytic site
of an enzyme. Note that while His 57 and Asp 102 re-
side on the B peptide of α-chymotrypsin, Ser 195 re-
sides on the C peptide (Figure 9–6). The conforma-
tional changes that accompany selective proteolysis of
prochymotrypsin (chymotrypsinogen) align the three
residues of the charge-relay network, creating the cat-
alytic site. Note also that contact and catalytic residues
can be located on different peptide chains but still be
within bond-forming distance of bound substrate.
REVERSIBLE COVALENT MODIFICATION
REGULATES KEY MAMMALIAN ENZYMES
Mammalian proteins are the targets of a wide range of
covalent modification processes. Modifications such as
glycosylation, hydroxylation, and fatty acid acylation
introduce new structural features into newly synthe-
sized proteins that tend to persist for the lifetime of the
protein. Among the covalent modifications that regu-
late protein function (eg, methylation, adenylylation),
the most common by far is phosphorylation-dephos-
phorylation. Protein kinases phosphorylate proteins by
catalyzing transfer of the terminal phosphoryl group of
ATP to the hydroxyl groups of seryl, threonyl, or tyro-
syl residues, forming O-phosphoseryl, O-phosphothre-
onyl, or O-phosphotyrosyl residues, respectively (Figure
9–7). Some protein kinases target the side chains of his-
tidyl, lysyl, arginyl, and aspartyl residues. The unmodi-
fied form of the protein can be regenerated by hy-
drolytic removal of phosphoryl groups, catalyzed by
protein phosphatases.
A typical mammalian cell possesses over 1000 phos-
phorylated proteins and several hundred protein kinases
and protein phosphatases that catalyze their intercon-
version. The ease of interconversion of enzymes be-
tween their phospho- and dephospho- forms in part
1 13 14 15 16 146 149
1 13 14 15 16 146 149
1 13 16 146 149
SSSS
245
245
245
π-CT
α-CT
Pro-CT
14-15 147-148
Figure 9–6. Selective proteolysis and associated conformational changes form the
active site of chymotrypsin, which includes the Asp102-His57-Ser195 catalytic triad.
Successive proteolysis forms prochymotrypsin (pro-CT), π-chymotrypsin (π-CT), and ul-
timately α-chymotrypsin (α-CT), an active protease whose three peptides remain asso-
ciated by covalent inter-chain disulfide bonds.
OH
P
i
H
2
O
ATP
Mg
2
+
Mg
2
+
ADP
Enz Ser OEnz Ser PO
3
2
–
KINASE
PHOSPHATASE
Figure 9–7. Covalent modification of a regulated en-
zyme by phosphorylation-dephosphorylation of a seryl
residue.
ch09.qxd 2/13/2003 2:27 PM Page 77
78 / CHAPTER 9
Table 9–1. Examples of mammalian enzymes
whose catalytic activity is altered by covalent
phosphorylation-dephosphorylation.
Activity State
1
Enzyme Low High
Acetyl-CoA carboxylase EP E
Glycogen synthase EP E
Pyruvate dehydrogenase EP E
HMG-CoA reductase EP E
Glycogen phosphorylase E EP
Citrate lyase E EP
Phosphorylase b kinase E EP
HMG-CoA reductase kinase E EP
1
E, dephosphoenzyme; EP, phosphoenzyme.
accounts for the frequency of phosphorylation-dephos-
phorylation as a mechanism for regulatory control.
Phosphorylation-dephosphorylation permits the func-
tional properties of the affected enzyme to be altered
only for as long as it serves a specific need. Once the
need has passed, the enzyme can be converted back to
its original form, poised to respond to the next stimula-
tory event. A second factor underlying the widespread
use of protein phosphorylation-dephosphorylation lies
in the chemical properties of the phosphoryl group it-
self. In order to alter an enzyme’s functional properties,
any modification of its chemical structure must influ-
ence the protein’s three-dimensional configuration.
The high charge density of protein-bound phosphoryl
groups—generally −2 at physiologic pH—and their
propensity to form salt bridges with arginyl residues
make them potent agents for modifying protein struc-
ture and function. Phosphorylation generally targets
amino acids distant from the catalytic site itself. Conse-
quent conformational changes then influence an en-
zyme’s intrinsic catalytic efficiency or other properties.
In this sense, the sites of phosphorylation and other co-
valent modifications can be considered another form of
allosteric site. However, in this case the “allosteric li-
gand” binds covalently to the protein.
PROTEIN PHOSPHORYLATION
IS EXTREMELY VERSATILE
Protein phosphorylation-dephosphorylation is a highly
versatile and selective process. Not all proteins are sub-
ject to phosphorylation, and of the many hydroxyl
groups on a protein’s surface, only one or a small subset
are targeted. While the most common enzyme function
affected is the protein’s catalytic efficiency, phosphory-
lation can also alter the affinity for substrates, location
within the cell, or responsiveness to regulation by al-
losteric ligands. Phosphorylation can increase an en-
zyme’s catalytic efficiency, converting it to its active
form in one protein, while phosphorylation of another
converts it into an intrinsically inefficient, or inactive,
form (Table 9–1).
Many proteins can be phosphorylated at multiple
sites or are subject to regulation both by phosphoryla-
tion-dephosphorylation and by the binding of allosteric
ligands. Phosphorylation-dephosphorylation at any one
site can be catalyzed by multiple protein kinases or pro-
tein phosphatases. Many protein kinases and most pro-
tein phosphatases act on more than one protein and are
themselves interconverted between active and inactive
forms by the binding of second messengers or by cova-
lent modification by phosphorylation-dephosphoryla-
tion.
The interplay between protein kinases and protein
phosphatases, between the functional consequences of
phosphorylation at different sites, or between phosphory-
lation sites and allosteric sites provides the basis for
regulatory networks that integrate multiple environ-
mental input signals to evoke an appropriate coordi-
nated cellular response. In these sophisticated regula-
tory networks, individual enzymes respond to different
environmental signals. For example, if an enzyme can
be phosphorylated at a single site by more than one
protein kinase, it can be converted from a catalytically
efficient to an inefficient (inactive) form, or vice versa,
in response to any one of several signals. If the protein
kinase is activated in response to a signal different from
the signal that activates the protein phosphatase, the
phosphoprotein becomes a decision node. The func-
tional output, generally catalytic activity, reflects the
phosphorylation state. This state or degree of phos-
phorylation is determined by the relative activities of
the protein kinase and protein phosphatase, a reflection
of the presence and relative strength of the environ-
mental signals that act through each. The ability of
many protein kinases and protein phosphatases to tar-
get more than one protein provides a means for an en-
vironmental signal to coordinately regulate multiple
metabolic processes. For example, the enzymes 3-hy-
droxy-3-methylglutaryl-CoA reductase and acetyl-CoA
carboxylase—the rate-controlling enzymes for choles-
terol and fatty acid biosynthesis, respectively—are
phosphorylated and inactivated by the AMP-activated
protein kinase. When this protein kinase is activated ei-
ther through phosphorylation by yet another protein
kinase or in response to the binding of its allosteric acti-
vator 5′-AMP, the two major pathways responsible for
the synthesis of lipids from acetyl-CoA both are inhib-
ited. Interconvertible enzymes and the enzymes respon-
sible for their interconversion do not act as mere on
and off switches working independently of one another.
ch09.qxd 2/13/2003 2:27 PM Page 78
ENZYMES: REGULATION OF ACTIVITIES /79
They form the building blocks of biomolecular com-
puters that maintain homeostasis in cells that carry out
a complex array of metabolic processes that must be
regulated in response to a broad spectrum of environ-
mental factors.
Covalent Modification Regulates
Metabolite Flow
Regulation of enzyme activity by phosphorylation-
dephosphorylation has analogies to regulation by feed-
back inhibition. Both provide for short-term, readily
reversible regulation of metabolite flow in response to
specific physiologic signals. Both act without altering
gene expression. Both act on early enzymes of a pro-
tracted, often biosynthetic metabolic sequence, and
both act at allosteric rather than catalytic sites. Feed-
back inhibition, however, involves a single protein and
lacks hormonal and neural features. By contrast, regula-
tion of mammalian enzymes by phosphorylation-
dephosphorylation involves several proteins and ATP
and is under direct neural and hormonal control.
SUMMARY
• Homeostasis involves maintaining a relatively con-
stant intracellular and intra-organ environment de-
spite wide fluctuations in the external environment
via appropriate changes in the rates of biochemical
reactions in response to physiologic need.
• The substrates for most enzymes are usually present
at a concentration close to K
m
. This facilitates passive
control of the rates of product formation response to
changes in levels of metabolic intermediates.
• Active control of metabolite flux involves changes in
the concentration, catalytic activity, or both of an en-
zyme that catalyzes a committed, rate-limiting reac-
tion.
• Selective proteolysis of catalytically inactive proen-
zymes initiates conformational changes that form the
active site. Secretion as an inactive proenzyme facili-
tates rapid mobilization of activity in response to in-
jury or physiologic need and may protect the tissue
of origin (eg, autodigestion by proteases).
• Binding of metabolites and second messengers to
sites distinct from the catalytic site of enzymes trig-
gers conformational changes that alter V
max
or the
K
m
.
• Phosphorylation by protein kinases of specific seryl,
threonyl, or tyrosyl residues—and subsequent de-
phosphorylation by protein phosphatases—regulates
the activity of many human enzymes. The protein ki-
nases and phosphatases that participate in regulatory
cascades which respond to hormonal or second mes-
senger signals constitute a “bio-organic computer”
that can process and integrate complex environmen-
tal information to produce an appropriate and com-
prehensive cellular response.
REFERENCES
Bray D: Protein molecules as computational elements in living
cells. Nature 1995;376:307.
Graves DJ, Martin BL, Wang JH: Co- and Post-translational Modi-
fication of Proteins: Chemical Principles and Biological Effects.
Oxford Univ Press, 1994.
Johnson LN, Barford D: The effect of phosphorylation on the
structure and function of proteins. Annu Rev Biophys Bio-
mol Struct 1993;22:199.
Marks F (editor): Protein Phosphorylation. VCH Publishers, 1996.
Pilkis SJ et al: 6-Phosphofructo-2-kinase/fructose-2,6-bisphospha-
tase: A metabolic signaling enzyme. Annu Rev Biochem
1995;64:799.
Scriver CR et al (editors): The Metabolic and Molecular Bases of
Inherited Disease, 8th ed. McGraw-Hill, 2000.
Sitaramayya A (editor): Introduction to Cellular Signal Transduction.
Birkhauser, 1999.
Stadtman ER, Chock PB (editors): Current Topics in Cellular Regu-
lation. Academic Press, 1969 to the present.
Weber G (editor): Advances in Enzyme Regulation. Pergamon Press,
1963 to the present.
ch09.qxd 2/13/2003 2:27 PM Page 79
Bioenergetics:The Role of ATP
10
80
Peter A. Mayes, PhD, DSc, & Kathleen M. Botham, PhD, DSc
SECTION II
Bioenergetics & the Metabolism
of Carbohydrates & Lipids
BIOMEDICAL IMPORTANCE
Bioenergetics, or biochemical thermodynamics, is the
study of the energy changes accompanying biochemical
reactions. Biologic systems are essentially isothermic
and use chemical energy to power living processes.
How an animal obtains suitable fuel from its food to
provide this energy is basic to the understanding of nor-
mal nutrition and metabolism. Death from starvation
occurs when available energy reserves are depleted, and
certain forms of malnutrition are associated with energy
imbalance (marasmus). Thyroid hormones control the
rate of energy release (metabolic rate), and disease re-
sults when they malfunction. Excess storage of surplus
energy causes obesity, one of the most common dis-
eases of Western society.
FREE ENERGY IS THE USEFUL ENERGY
IN A SYSTEM
Gibbs change in free energy (∆G) is that portion of the
total energy change in a system that is available for
doing work—ie, the useful energy, also known as the
chemical potential.
Biologic Systems Conform to the General
Laws of Thermodynamics
The first law of thermodynamics states that the total
energy of a system, including its surroundings, re-
mains constant. It implies that within the total system,
energy is neither lost nor gained during any change.
However, energy may be transferred from one part of
the system to another or may be transformed into an-
other form of energy. In living systems, chemical en-
ergy may be transformed into heat or into electrical, ra-
diant, or mechanical energy.
The second law of thermodynamics states that the
total entropy of a system must increase if a process
is to occur spontaneously. Entropy is the extent of
disorder or randomness of the system and becomes
maximum as equilibrium is approached. Under condi-
tions of constant temperature and pressure, the rela-
tionship between the free energy change (∆G) of a re-
acting system and the change in entropy (∆S) is
expressed by the following equation, which combines
the two laws of thermodynamics:
where ∆H is the change in enthalpy (heat) and T is the
absolute temperature.
In biochemical reactions, because ∆H is approxi-
mately equal to ∆E, the total change in internal energy
of the reaction, the above relationship may be expressed
in the following way:
If ∆G is negative, the reaction proceeds sponta-
neously with loss of free energy; ie, it is exergonic. If,
in addition, ∆G is of great magnitude, the reaction goes
virtually to completion and is essentially irreversible.
On the other hand, if ∆G is positive, the reaction pro-
ceeds only if free energy can be gained; ie, it is ender-
gonic. If, in addition, the magnitude of ∆G is great, the
∆G =∆E − T∆S
∆G =∆H − T∆S
ch10.qxd 3/16/04 10:42 AM Page 80
BIOENERGETICS: THE ROLE OF ATP /81
system is stable, with little or no tendency for a reaction
to occur. If ∆G is zero, the system is at equilibrium and
no net change takes place.
When the reactants are present in concentrations of
1.0 mol/L, ∆G
0
is the standard free energy change. For
biochemical reactions, a standard state is defined as
having a pH of 7.0. The standard free energy change at
this standard state is denoted by ∆G
0′
.
The standard free energy change can be calculated
from the equilibrium constant K
eq
.
where R is the gas constant and T is the absolute tem-
perature (Chapter 8). It is important to note that the
actual ∆G may be larger or smaller than ∆G
0′
depend-
ing on the concentrations of the various reactants, in-
cluding the solvent, various ions, and proteins.
In a biochemical system, an enzyme only speeds up
the attainment of equilibrium; it never alters the final
concentrations of the reactants at equilibrium.
ENDERGONIC PROCESSES PROCEED BY
COUPLING TO EXERGONIC PROCESSES
The vital processes—eg, synthetic reactions, muscular
contraction, nerve impulse conduction, and active
transport—obtain energy by chemical linkage, or cou-
pling, to oxidative reactions. In its simplest form, this
type of coupling may be represented as shown in Figure
10–1. The conversion of metabolite A to metabolite B
∆G
0′
= −RT ln K ′
eq
occurs with release of free energy. It is coupled to an-
other reaction, in which free energy is required to con-
vert metabolite C to metabolite D. The terms exer-
gonic and endergonic rather than the normal chemical
terms “exothermic” and “endothermic” are used to in-
dicate that a process is accompanied by loss or gain, re-
spectively, of free energy in any form, not necessarily as
heat. In practice, an endergonic process cannot exist in-
dependently but must be a component of a coupled ex-
ergonic-endergonic system where the overall net change
is exergonic. The exergonic reactions are termed catab-
olism (generally, the breakdown or oxidation of fuel
molecules), whereas the synthetic reactions that build
up substances are termed anabolism. The combined
catabolic and anabolic processes constitute metabo-
lism.
If the reaction shown in Figure 10–1 is to go from
left to right, then the overall process must be accompa-
nied by loss of free energy as heat. One possible mecha-
nism of coupling could be envisaged if a common oblig-
atory intermediate (I) took part in both reactions, ie,
Some exergonic and endergonic reactions in biologic
systems are coupled in this way. This type of system has
a built-in mechanism for biologic control of the rate of
oxidative processes since the common obligatory inter-
mediate allows the rate of utilization of the product of
the synthetic path (D) to determine by mass action the
rate at which A is oxidized. Indeed, these relationships
supply a basis for the concept of respiratory control,
the process that prevents an organism from burning out
of control. An extension of the coupling concept is pro-
vided by dehydrogenation reactions, which are coupled
to hydrogenations by an intermediate carrier (Figure
10–2).
An alternative method of coupling an exergonic to
an endergonic process is to synthesize a compound of
high-energy potential in the exergonic reaction and to
incorporate this new compound into the endergonic re-
action, thus effecting a transference of free energy from
the exergonic to the endergonic pathway (Figure 10–3).
The biologic advantage of this mechanism is that the
compound of high potential energy, ∼᭺
E
, unlike I
A + C →I → B+D
Figure 10–1. Coupling of an exergonic to an ender-
gonic reaction.
∆G =∆H − T∆S
Figure 10–2. Coupling of dehydrogenation and hy-
drogenation reactions by an intermediate carrier.
ch10.qxd 3/16/04 10:42 AM Page 81
82 / CHAPTER 10
Figure 10–3. Transfer of free energy from an exer-
gonic to an endergonic reaction via a high-energy in-
termediate compound (∼
᭺
E
).
Figure 10–4. Adenosine triphosphate (ATP) shown
as the magnesium complex. ADP forms a similar com-
plex with Mg
2
+
.
in the previous system, need not be structurally related
to A, B, C, or D, allowing ᭺
E
to serve as a transducer of
energy from a wide range of exergonic reactions to an
equally wide range of endergonic reactions or processes,
such as biosyntheses, muscular contraction, nervous ex-
citation, and active transport. In the living cell, the
principal high-energy intermediate or carrier com-
pound (designated ∼᭺
E
in Figure 10–3) is adenosine
triphosphate (ATP).
HIGH-ENERGY PHOSPHATES PLAY A
CENTRAL ROLE IN ENERGY CAPTURE
AND TRANSFER
In order to maintain living processes, all organisms
must obtain supplies of free energy from their environ-
ment. Autotrophic organisms utilize simple exergonic
processes; eg, the energy of sunlight (green plants), the
reaction Fe
2
+
→ Fe
3
+
(some bacteria). On the other
hand, heterotrophic organisms obtain free energy by
coupling their metabolism to the breakdown of com-
plex organic molecules in their environment. In all
these organisms, ATP plays a central role in the trans-
ference of free energy from the exergonic to the ender-
gonic processes (Figure 10–3). ATP is a nucleoside
triphosphate containing adenine, ribose, and three
phosphate groups. In its reactions in the cell, it func-
tions as the Mg
2
+
complex (Figure 10–4).
The importance of phosphates in intermediary me-
tabolism became evident with the discovery of the role
of ATP, adenosine diphosphate (ADP), and inorganic
phosphate (P
i
) in glycolysis (Chapter 17).
The Intermediate Value for the Free
Energy of Hydrolysis of ATP Has Important
Bioenergetic Significance
The standard free energy of hydrolysis of a number of
biochemically important phosphates is shown in Table
10–1. An estimate of the comparative tendency of each
of the phosphate groups to transfer to a suitable accep-
tor may be obtained from the ∆G
0′
of hydrolysis at
37 °C. The value for the hydrolysis of the terminal
Table 10–1. Standard free energy of hydrolysis
of some organophosphates of biochemical
importance.
1,2
⌬G
0
Compound kJ/mol kcal/mol
Phosphoenolpyruvate −61.9 −14.8
Carbamoyl phosphate −51.4 −12.3
1,3-Bisphosphoglycerate −49.3 −11.8
(to 3-phosphoglycerate)
Creatine phosphate −43.1 −10.3
ATP → ADP + P
i
−30.5 −7.3
ADP → AMP + P
i
−27.6 −6.6
Pyrophosphate −27.6 −6.6
Glucose 1-phosphate −20.9 −5.0
Fructose 6-phosphate −15.9 −3.8
AMP −14.2 −3.4
Glucose 6-phosphate −13.8 −3.3
Glycerol 3-phosphate −9.2 −2.2
1
P
i
, inorganic orthophosphate.
2
Values for ATP and most others taken from Krebs and Kornberg
(1957). They differ between investigators depending on the pre-
cise conditions under which the measurements are made.
ch10.qxd 3/16/04 10:42 AM Page 82
BIOENERGETICS: THE ROLE OF ATP /83
Figure 10–5. Structure of ATP, ADP, and AMP show-
ing the position and the number of high-energy phos-
phates (∼
᭺
P
).
phosphate of ATP divides the list into two groups.
Low-energy phosphates, exemplified by the ester
phosphates found in the intermediates of glycolysis,
have ∆G
0′
values smaller than that of ATP, while in
high-energy phosphates the value is higher than that
of ATP. The components of this latter group, including
ATP, are usually anhydrides (eg, the 1-phosphate of
1,3-bisphosphoglycerate), enolphosphates (eg, phos-
phoenolpyruvate), and phosphoguanidines (eg, creatine
phosphate, arginine phosphate). The intermediate posi-
tion of ATP allows it to play an important role in en-
ergy transfer. The high free energy change on hydrolysis
of ATP is due to relief of charge repulsion of adjacent
negatively charged oxygen atoms and to stabilization of
the reaction products, especially phosphate, as reso-
nance hybrids. Other “high-energy compounds” are
thiol esters involving coenzyme A (eg, acetyl-CoA), acyl
carrier protein, amino acid esters involved in protein
synthesis, S-adenosylmethionine (active methionine),
UDPGlc (uridine diphosphate glucose), and PRPP
(5-phosphoribosyl-1-pyrophosphate).
High-Energy Phosphates Are
Designated by ~
᭺
P
The symbol ∼
᭺
P
indicates that the group attached to
the bond, on transfer to an appropriate acceptor, results
in transfer of the larger quantity of free energy. For this
reason, the term group transfer potential is preferred
by some to “high-energy bond.” Thus, ATP contains
two high-energy phosphate groups and ADP contains
one, whereas the phosphate in AMP (adenosine mono-
phosphate) is of the low-energy type, since it is a nor-
mal ester link (Figure 10–5).
HIGH-ENERGY PHOSPHATES ACT AS THE
“ENERGY CURRENCY” OF THE CELL
ATP is able to act as a donor of high-energy phosphate
to form those compounds below it in Table 10–1. Like-
wise, with the necessary enzymes, ADP can accept
high-energy phosphate to form ATP from those com-
pounds above ATP in the table. In effect, an ATP/
ADP cycle connects those processes that generate ∼
᭺
P
to those processes that utilize ∼
᭺
P
(Figure 10–6), con-
tinuously consuming and regenerating ATP. This oc-
curs at a very rapid rate, since the total ATP/ADP pool
is extremely small and sufficient to maintain an active
tissue for only a few seconds.
There are three major sources of ∼
᭺
P
taking part in
energy conservation or energy capture:
(1) Oxidative phosphorylation: The greatest quan-
titative source of ∼
᭺
P
in aerobic organisms. Free energy
Figure 10–6. Role of ATP/ADP cycle in transfer of
high-energy phosphate.
ch10.qxd 3/16/04 10:42 AM Page 83
84 / CHAPTER 10
comes from respiratory chain oxidation using molecular
O
2
within mitochondria (Chapter 11).
(2) Glycolysis: A net formation of two ∼
᭺
P
results
from the formation of lactate from one molecule of glu-
cose, generated in two reactions catalyzed by phospho-
glycerate kinase and pyruvate kinase, respectively (Fig-
ure 17–2).
(3) The citric acid cycle: One ∼
᭺
P
is generated di-
rectly in the cycle at the succinyl thiokinase step (Figure
16–3).
Phosphagens act as storage forms of high-energy
phosphate and include creatine phosphate, occurring in
vertebrate skeletal muscle, heart, spermatozoa, and
brain; and arginine phosphate, occurring in inverte-
brate muscle. When ATP is rapidly being utilized as a
source of energy for muscular contraction, phosphagens
permit its concentrations to be maintained, but when
the ATP/ADP ratio is high, their concentration can in-
crease to act as a store of high-energy phosphate (Figure
10–7).
When ATP acts as a phosphate donor to form those
compounds of lower free energy of hydrolysis (Table
10–1), the phosphate group is invariably converted to
one of low energy, eg,
ATP Allows the Coupling of
Thermodynamically Unfavorable
Reactions to Favorable Ones
The phosphorylation of glucose to glucose 6-phos-
phate, the first reaction of glycolysis (Figure 17–2), is
highly endergonic and cannot proceed under physio-
logic conditions.
To take place, the reaction must be coupled with an-
other—more exergonic—reaction such as the hydroly-
sis of the terminal phosphate of ATP.
When (1) and (2) are coupled in a reaction catalyzed by
hexokinase, phosphorylation of glucose readily pro-
ceeds in a highly exergonic reaction that under physio-
logic conditions is irreversible. Many “activation” reac-
tions follow this pattern.
Adenylyl Kinase (Myokinase)
Interconverts Adenine Nucleotides
This enzyme is present in most cells. It catalyzes the fol-
lowing reaction:
This allows:
(1) High-energy phosphate in ADP to be used in
the synthesis of ATP.
(2) AMP, formed as a consequence of several acti-
vating reactions involving ATP, to be recovered by
rephosphorylation to ADP.
(3) AMP to increase in concentration when ATP
becomes depleted and act as a metabolic (allosteric) sig-
nal to increase the rate of catabolic reactions, which in
turn lead to the generation of more ATP (Chapter 19).
When ATP Forms AMP, Inorganic
Pyrophosphate (PP
i
) Is Produced
This occurs, for example, in the activation of long-
chain fatty acids (Chapter 22):
This reaction is accompanied by loss of free energy
as heat, which ensures that the activation reaction will
go to the right; and is further aided by the hydrolytic
splitting of PP
i
, catalyzed by inorganic pyrophospha-
tase, a reaction that itself has a large ∆G
0′
of −27.6 kJ/
(2) ATP→ ADP+P
i
(∆G
0′
=−30.5 kJ/mol)
(1) Glucose+P
i
→ Glucose 6- phosphate+ H
2
O
( ∆G
0′
= +13.8 kJ/ mol)
Figure 10–7. Transfer of high-energy phosphate be-
tween ATP and creatine.
ch10.qxd 3/16/04 10:42 AM Page 84
BIOENERGETICS: THE ROLE OF ATP /85
mol. Note that activations via the pyrophosphate path-
way result in the loss of two ∼
᭺
P
rather than one ∼
᭺
P
as
occurs when ADP and P
i
are formed.
A combination of the above reactions makes it pos-
sible for phosphate to be recycled and the adenine nu-
cleotides to interchange (Figure 10–8).
Other Nucleoside Triphosphates
Participate in the Transfer of
High-Energy Phosphate
By means of the enzyme nucleoside diphosphate ki-
nase, UTP, GTP, and CTP can be synthesized from
their diphosphates, eg,
All of these triphosphates take part in phosphoryla-
tions in the cell. Similarly, specific nucleoside mono-
phosphate kinases catalyze the formation of nucleoside
diphosphates from the corresponding monophosphates.
Thus, adenylyl kinase is a specialized monophosphate
kinase.
SUMMARY
• Biologic systems use chemical energy to power the
living processes.
• Exergonic reactions take place spontaneously with
loss of free energy (∆G is negative). Endergonic reac-
tions require the gain of free energy (∆G is positive)
and only occur when coupled to exergonic reactions.
• ATP acts as the “energy currency” of the cell, trans-
ferring free energy derived from substances of higher
energy potential to those of lower energy potential.
REFERENCES
de Meis L: The concept of energy-rich phosphate compounds:
Water, transport ATPases, and entropy energy. Arch Bio-
chem Biophys 1993;306:287.
Ernster L (editor): Bioenergetics. Elsevier, 1984.
Harold FM: The Vital Force: A Study of Bioenergetics. Freeman,
1986.
Klotz IM: Introduction to Biomolecular Energetics. Academic Press,
1986.
Krebs HA, Kornberg HL: Energy Transformations in Living Matter.
Springer, 1957.
Figure 10–8. Phosphate cycles and interchange of
adenine nucleotides.
ch10.qxd 3/16/04 10:42 AM Page 85