Retrovirology Research BioMed Central Open Access Characteristic expression of HTLV-1 basic ppsx
Bạn đang xem bản rút gọn của tài liệu. Xem và tải ngay bản đầy đủ của tài liệu tại đây (335.04 KB, 11 trang )
BioMed Central
Page 1 of 11
(page number not for citation purposes)
Retrovirology
Open Access
Research
Characteristic expression of HTLV-1 basic zipper factor (HBZ)
transcripts in HTLV-1 provirus-positive cells
Tetsuya Usui
1
, Katsunori Yanagihara
1
, Kunihiro Tsukasaki
2
, Ken Murata
1
,
Hiroo Hasegawa
1
, Yasuaki Yamada
1
and Shimeru Kamihira*
1
Address:
1
Department of Laboratory Medicine Nagasaki University Graduate School of Biomedical Sciences, Nagasaki City, Japan and
2
Department of Hematology, Nagasaki University Graduate School of Biomedical Sciences, Nagasaki City, Japan
Email: Tetsuya Usui - ; Katsunori Yanagihara - ; Kunihiro Tsukasaki - tsukasak@nagasaki-
u.ac.jp; Ken Murata - ; Hiroo Hasegawa - ; Yasuaki Yamada - ;
Shimeru Kamihira* -
* Corresponding author
Abstract
Background: HTLV-1 causes adult T-cell leukemia (ATL). Although there have been many studies
on the oncogenesis of the viral protein Tax, the precise oncogenic mechanism remains to be
elucidated. Recently, a new viral factor, HTLV-1 basic Zip factor (HBZ), encoded from the minus
strand mRNA was discovered and the current models of Tax-centered ATL cell pathogenesis are
in conflict with this discovery. HBZs consisting of non-spliced and spliced isoforms (HBZ-SI) are
thought to be implicated in viral replication and T-cell proliferation but there is little evidence on
the HBZ expression profile on a large scale.
Results: To investigate the role of HBZ-SI in HTLV-1 provirus-positive cells, the HBZ-SI and Tax
mRNA loads in samples with a mixture of infected and non-infected cells were measured and then
adjusted by dividing by the HTLV-I proviral load. We show here that the HBZ-SI mRNA level is 4-
fold higher than non-spliced HBZ and is expressed by almost all cells harboring HTLV-1 provirus
with variable intensity. The proviral-adjusted HBZ-SI and Tax quantification revealed a
characteristic imbalanced expression feature of high HBZ and low Tax expression levels in primary
ATL cells or high HBZ and very high Tax levels in HTLV-1-related cell lines (cell lines) compared
with a standard expression profile of low HBZ and low Tax in infected cells. Interestingly, according
to the mutual Tax and HBZ expression status, HTLV-1-related cell lines were subcategorized into
two groups, an ATL cell type with high HBZ and low Tax levels and another type with high Tax and
either high or low HBZ, which was closely related to its cell origin.
Conclusion: This is the first comprehensive study to evaluate the mutual expression profile of
HBZ and Tax in provirus-positive cells, revealing that there are quantitative and relative
characteristic features among infected cells, primary ATL cells, and cell lines.
Introduction
Adult T-cell leukemia (ATL) is a unique T-cell malignancy
derived from T-cells infected with a retrovirus of human T-
cell leukemia virus type-1 (HTLV-1) [1-3]. ATL is clinically
and hematologically characterized to develop step by step
through smoldering, chronic, and acute stages after a long
Published: 22 April 2008
Retrovirology 2008, 5:34 doi:10.1186/1742-4690-5-34
Received: 6 March 2008
Accepted: 22 April 2008
This article is available from: />© 2008 Usui et al; licensee BioMed Central Ltd.
This is an Open Access article distributed under the terms of the Creative Commons Attribution License ( />),
which permits unrestricted use, distribution, and reproduction in any medium, provided the original work is properly cited.
Retrovirology 2008, 5:34 />Page 2 of 11
(page number not for citation purposes)
latency of HTLV-1 infection, revealing that ATL is a good
experimental model of multi-step carcinogenesis.
Although it is a fact that HTLV-1 reaches an oncogenic
event and causes ATL, the oncogenic mechanism of HTLV-
1 is not fully understood. The HTLV-1 genome, in addi-
tion to the structural and enzymatic proteins gag, pol, and
env, encodes the regulatory and accessory proteins tax,
rex, p12
I
, p13
II
, and p30
II
[4,5]. Among these viral pro-
teins, Tax, encoded by pX in a double splicing manner, is
thought to be mainly implicated in the oncogenesis of
ATL via indirect and direct interactions between Tax and
cellular molecules [6,7]. Indeed, there have been many
studies showing that Tax is expressed abundantly in
infected T-cells and HTLV-1-associated cell lines, and Tax
acts as a main player indispensable for the malignant
transformation of infected cells in the early stage of ATL
development. However, ATL cells often contain genetic
and epigenetic alterations of the 5'LTR of the HTLV-1 pro-
virus, resulting in the loss of Tax expression [8]. On the
other hand, the 3' end of the provirus encompassing the
Tax gene is invariably maintained in leukemic cells from
patients suggesting the possibility of minus strand tran-
scription.
A novel viral protein, HTLV-1 basic zipper factor (HBZ),
which is encoded by the minus strand RNA of the HTLV-
1 genome, has been identified recently [9,10]. We and
others identified and sequenced a novel splicing form of
HBZ transcripts, named HBZ-splicing isoform (SI), which
encodes a 206 amino acid protein and is generated by
alternative splicing between part of the HBZ gene and a
novel exon located in the 3' LTR of the HTLV-1 genome
[11,12]. HBZ-SI is equivalent to the HBZ spliced variant
(SPI) initiating in the 3'LTR reported by Cavanagh et al. as
an alternative spliced form and to be one of the most
abundant HBZ isoforms [13]. Since the spliced and non-
spliced HBZ mRNAs have been reported to be detectable
in almost all ATL cells tested, HBZ is expected to be closely
involved in ATL cell biology corresponding to the late
stages of multi-step carcinogenesis of ATL [14].
In this study, to investigate the role of HBZ in the multi-
step development of ATL, the quantitative expression lev-
els of HBZ and Tax transcripts were measured by real-time
reverse-transcription PCR using HTLV-1-infected cells
well characterized by HTLV-1 proviral integration status.
Consequently, HBZ transcripts were observed ubiqui-
tously in almost all cells harboring HTLV-1 provirus, and
primary ATL cells were characteristic with the very high
HBZ transcript levels relative to Tax.
Materials and methods
HTLV-1-infected cells, ATL cells, and cell lines
Blood specimens with cells carrying HTLV-1 provirus
from ATL patients and healthy persons were collected in
our hospital under the approval of the Research Ethics
Committee of our Institute.
According to the status of cytomorphological and clinico-
oncological findings, HTLV-1 proviral load and the HTLV-
1 proviral integration status were determined by Southern
blot analysis and classified into 31 asymptomatic carriers
(AC), and 35 patients with ATL. ATL was subtyped accord-
ing to the JLSG criteria [15]; acute and chronic ATL and
ATL in remission. HTLV-1-related cell lines MT1, MT2,
HUT102, KK1, KOB, ST1, SO4, OMT, and MT1s were
examined in this study. The cell origins of MT1, KK1,
KOB, ST1, SO4, and MT1s are ATL cells, whereas those of
MT2, HUT102, and OMT are infected normal T-cells.
MT1s is a CD4
+
T-cell line derived from MT1 during many
passages [16]. All of these cell lines were documented to
have 2 or more HTLV-1 proviruses monoclonally inte-
grated into their genomic DNA. KK1, KOB, ST1, OMT,
and SO4 were established in our laboratory [17,18].
HTLV-1 infection was demonstrated by a commercial
anti-HTLV-1 assay kit (Fujirebio Inc. Tokyo, Japan). In this
study, infected cells were defined as non-malignant T-cells
randomly integrated with HTLV-1 provirus, while ATL
cells were defined as malignant T-cells monoclonally inte-
grated with the provirus.
Methods
DNA and RNA preparation
High molecular weight DNA was extracted from mononu-
clear blood cells and cell-lines using a QIAmp DNA Blood
Mini kit (Qiagen GmbH, Hilden, Germany). Total RNA
was extracted using ISOGEN (Nippon Gene, Toyama,
Japan). After removing contaminating-genomic DNA
using a Message Clean kit, two types of anti-sense cDNA
and sense cDNA were synthesized. Sense cDNA was syn-
thesized using Oligo(dT)12–18 Primer and Super-
ScriptTM RT (Invitrogen). The first anti-sense strand
cDNAs used to amplify both HBZ and HBZ-SI mRNAs
were reverse-transcribed using a minus-strand-specific
primer, 5'-cccatgtctcaatactacaagaaag-3', in order to avoid
contamination of cDNA from the HTLV-1 sense strand
genome.
Real-time quantitative RT-PCR for HBZ and HBZ-SI
Real-time RT-PCR was performed using a LightCycler
Technology System (Roche Diagnostics) as described pre-
viously [11]. Briefly, HBZ or HBZ-SI mRNAs were ampli-
fied using anti-sense cDNA as a template and forward and
reverse primers specific to the respective transcripts [11].
For the quantification of the amplicons, newly designed
Retrovirology 2008, 5:34 />Page 3 of 11
(page number not for citation purposes)
reporter and quencher Hybri-probes common to HBZ and
HBZ-SI were used. The reporter and quencher probes were
5'-cagggctgtttcgatgcttgcctgt3'-FITC, and LC-Red-5'-tcat-
gcccggaggacctgctggt-3'-P, respectively. After 50 cycles, the
HBZ or HBZ-SI copy number per 50 ng total RNA was esti-
mated from the standard curves generated by serial dilu-
tion of the HBZ and HBZ-SI PCR products derived from
ST1 cell line, respectively [11]. Assays were carried out in
duplicate and the average value was used as absolute
amounts of HBZ mRNA in samples from HTLV-1-infected
individuals.
RT-PCR quantification for Tax
The HTLV-1 Tax mRNA load was measured from a tem-
plate of sense cDNA using the same LightCycler PCR Sys-
tem as described previously [19]. Briefly, PCR
amplification was performed according to the manufac-
turer's instruction using the primers and probes as fol-
lows; forward primer, 5'-cccacttcccagggtttggacagag-3';
reverse primer, 5'-cgcgttatcggctcagctctcag-3', reporter
probe; 5'-cttttccagaccccggactccg-3'-FITC, and quencher
probe, LC-Red-5'-cccaaaacctgtacaccctctg-3'-p. After 50
cycles, the absolute amounts of HTLV-1 Tax mRNA was
interpolated from the standard curves generated by the
dilution method using Tax plasmids derived from a clone
transfected with pGEM Easy Vector containing an ampli-
con of the Tax. To normalize these results for variability in
RNA and cDNA integrity, we monitored abl gene in each
sample as an internal control.
SBH and HTLV-1 proviral load
Using restriction enzymes of EcoRI and PstI and a digoxi-
genin-labeled whole HTLV-1 probe, SBH analysis was per-
formed as described previously [20,21]. Visible sharp
band(s) from EcoRI digestion and the presence of external
band(s) from PstI digestion were considered to be posi-
tive, indicating that the cells tested harbor the provirus
integrated monoclonally into their genomic DNA. The
detection sensitivity was at least 5%.
Next, HTLV-1 proviral load was quantified using a real-
time DNA PCR LightCycler Technology System according
to our previously described method [22,23]. The primers
and probes used were from highly conserved sequences of
the Tax gene; sense 5'-cccacttcccagggtttggacagag-3', anti-
sense 5'-cgcgttatcggctcagctctcag-3', reporter probe 5'-cttttc-
cagaccccggactccg-3'-FITC, and quencher probe LC-Red-5'-
cccaaaacctgtacaccctctg-3'-P. The sample copy number was
estimated by interpolation from the standard curve gener-
ated by serial dilution of a Tax-containing plasmid. The
detection sensitivity was 10
-3
(one infected cell relative to
1000 non-infected cells). Normalization was done by
using β-globin quantification as an internal control.
Assuming one provirus per infected cell (one band in SBH
analysis), proviral load was considered to be equivalent to
the number of infected cells, namely infected-cell number
per 10000 cells = (copy number of Tax)/(copy number of
β-globin/2) × 10000.
Statistical analysis
Using the Stat View software, the Mann-Whitney U test or
Student's t-test were used to compare data between two
groups, and Spearman's rank correlation was used to
examine the two groups.
Results
HBZ and spliced HBZ-SI mRNA load in individuals infected
with HTLV-1
The HTLV-1 proviral load represents the population of
infected cells in blood mononuclear cells when one cell
harbors one provirus. Accordingly, we first examined the
band status of SBH analysis. Using EcoRI digested DNA
samples, SBH analysis revealed one sharp band in 28 ATL
samples, two bands in 2 ATL samples, and smeared-bands
in 36 AC samples including 5 ATL patients in remission.
The samples with two bands were adjusted when the
infected cell number was estimated based on the HTLV-1
proviral load. The cell lines used here were also demon-
strated to contain multiple proviruses in their genomes,
e.g. 8 bands in HUT102 and 2 bands in ST1. Subse-
quently, the mean value of the HTLV-1 proviral load per
10
4
cells was 316 in ACs, 2739 in ATL patients, and 7600
in cell lines.
HBZs are known to consist of non-spliced and spliced iso-
forms, HBZ and HBZ-SI, as shown in Figure 1. We firstly
evaluated which HBZ isoform was dominant in the 54
samples from sero-positive individuals infected with
HTLV-1, including 26 ACs and 28 ATL patients. The
median value of un-spliced and spliced HBZ mRNA
expression was 0.06 × 10
3
and 0.2 × 10
3
in ACs, 1.3 × 10
3
and 6.0 × 10
3
in ATL samples, respectively. Of all samples
tested, the expression load of HBZ-SI was about 4-fold
higher than that of HBZ (mean; 4.9 × 10
3
vs 1.2 × 10
3
; p <
0.001). Accordingly, HBZ-SI was analyzed in this study.
HBZ-SI mRNA load was detected in all but 5 of the 72
samples (3 ACs, one ATL, and one cell line of MT1s and
ranged from 0.0 to 6.0 × 10
5
. As shown in Figure 2, the
HBZ-SI mRNA load was significantly higher in ATL
patients than carriers and lower in ATL patients than cell
lines (p < 0.01, Mann-Whitney U-test). The relative
expression load of the HBZ-SI mRNA among ACs, patients
with ATL, and cell lines was 1 : 28 : 350 on average (Table
1). Furthermore, as shown in Figure 3, the HBZ-SI mRNA
load was significantly correlated to the infected cell
number interpolated from HTLV-1 proviral load analysis.
This data reveals that, in order to understand the differ-
ence in the expression level of only provirus-positive cells,
the absolute amount of HBZ-SI mRNA load should be
Retrovirology 2008, 5:34 />Page 4 of 11
(page number not for citation purposes)
adjusted a value per infected cell number. Accordingly, to
adjust the absolute amount of HBZ-SI mRNA load in the
samples consisting of a mixture of infected and non-
infected cells, the proviral-adjusted HBZ-SI mRNA level
(HBZ-SI/HTLV-1) was calculated as follows; (HBZ-SI
mRNA load)/(HTLV-1 proviral DNA load) × 10
4
. Conse-
quently, the HBZ-SI mRNA expression level after adjust-
ment, as shown in Figure 4, revealed that there was a
subtle difference among infected cells, ATL cells, and cell
lines. The mean values of the HBZ-SI mRNA load and
level before and after adjustment are summarized in Table
1, showing the changes of the relative ratio among ACs
(infected cells), ATL patients (ATL cells), and cell lines,
from 1 : 28 : 350 to 1 : 6 : 6.
Comparison of HBZ-SI mRNA load with Tax mRNA load
in provirus-positive cells
Tax mRNA levels were quantifiable in samples from
almost all ATL patients and cell lines, and varied from 0.0
to 10
7
. However, there was no correlation between Tax
mRNA load and either HBZ-SI mRNA load or proviral
load. As shown in Figure 5 and Table 1, although the Tax
mRNA load before adjustment was extremely high in only
the cell lines, the data after adjustment (Tax/HTLV-1) clar-
ified that ATL cells express Tax at an intensity of 15-fold
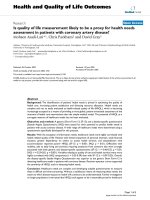
The structure of the HBZ un-spliced (HBZ) and spliced (HBZ-SI) anti-sense transcripts (ATL-YS)Figure 1
The structure of the HBZ un-spliced (HBZ) and spliced (HBZ-SI) anti-sense transcripts (ATL-YS). HBZ-encod-
ing transcripts initiate in the 3'LTR and are alternatively spliced. The HBZ-SI transcript is about 2.4 kb, consisting of exon 2
corresponding to part of the HBZ ORF (7292 to 6666) and the additional exon 1 (8682 to 8670) at the 3' LTR (11). (ATL-YS;
accession no. U19949).
env
3̉
̉̉
̉LTR
9036bp
8281bp
6649bp
Tax
7305bp 8362bp
rex
7814bp
5183bp
HBZ-SI
spliced
7270bp 8670bp 8682bp
1400bp
8868bp
6382bp
HBZ ORF
6666bp 7292bp
HBZ
non-spliced
Provirus
genome
Sense ψ
φantisense
Table 1: Comparison of HBZ-SI and Tax mRNA
ACs ATL cells Cell lines Relative intensity
‡
(Acs:ATL : cell lines)
HBZ-SI
raw data* 0.04 ± 0.06 1.13 ± 1.41 14.01 ± 23.2 (1: 28: 350)
§
adjusted* 3.34 ± 4.71 19.82 ± 54.31 19.02 ± 22.2 (1: 6: 6)
Tax
raw data* 0.009 ± 0.01 0.01 ± 0.02 590.0 ± 989.1 (1: 1: 6600)
#
adjusted* 0.9 ± 1.2 0.06 ± 0.01 813.0 ± 1460.0 (1: 1/15: 900)
§
HBZ-SI/Tax
†
3.7 ± 12.0 330 ± 440
&
0.023 ± 0.125
low HBZ/low Tax high HBZ/low Tax high HBZ/very high Tax
The proviral adjusted data was calculated by dividing the raw data by HTLV-1 proviral load. Each adjusted value and HBZ-SI/Tax show the
characteristic features of the mutual expression patternbetween HBZ-SI and Tax from the viewpoint of relative and absolute transcript levels. * ×
104 † ratio ‡ relative expression intensity among three groups §P < 0.01 among three cell types # P < 0.01 among ATL cells and cell lines3); P <
0.01 for ACs and cell lines.
Retrovirology 2008, 5:34 />Page 5 of 11
(page number not for citation purposes)
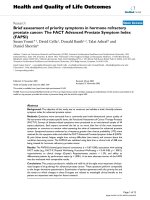
The distribution plots of HBZ-SI mRNA load in different sample groupsFigure 2
The distribution plots of HBZ-SI mRNA load in different sample groups. Among sero-negative controls, asympto-
matic carriers (ACs), patients with ATL, ATL patients in remission, and HTLV-1-related cell lines, there is statistical difference
in the median (horizontal bar) among ACs (0.2 × 10
3
) and patients withATL (6.0 × 10
3
) and cell lines (7.5 × 10
5
) (p < 0.01).
ACs ATL ATL
in remission
Cell line
10
2
10
3
10
4
10
5
10
6
1
10
1
HBZ-SI mRNA load
HCጏ
ጏጏ
ጏ
The correlation between HBZ-SI mRNA and HTLV-1 proviral loadsFigure 3
The correlation between HBZ-SI mRNA and HTLV-1 proviral loads. The positive correlation between the expres-
sion level of HBZ-SI mRNA (Y-axis) and the proviral load (X-axis) equivalent to the infected cell number (r = 0.483, P < 0.05),
indicating that an adjusted HBZ-SI value is indispensable to evaluate the expression level in heterogeneous samples with a mix-
ture of infected and uninfected cells.
10
2
10
3
10
4
10
5
10
6
10
1
1
10
1
10
2
10
3
10
4
10
5
HBZ-SI mRNA load
HTLV-1 proviral load
r=0.483
P<0.05
Retrovirology 2008, 5:34 />Page 6 of 11
(page number not for citation purposes)
The distribution of HBZ-SI expression level adjusted by HTLV-1 proviral load (HBZ-SI/HTLV-1 ratio) in each cell groupFigure 4
The distribution of HBZ-SI expression level adjusted by HTLV-1 proviral load (HBZ-SI/HTLV-1 ratio) in each
cell group. The relative intensity on average among the three cell types of carriers, ATL cells from patients with ATL, and cell
line cells. was about 1:6:6, but was not significantly different.
ACs ATL Cell line
10
2
10
3
10
4
10
5
10
6
10
7
1
10
1
HBZ-SI
ޓ
ޓ
ޓ
ޓadjusted load
Comparison of Tax mRNA load before (A) and after (B) adjusting by the HTLV-1 proviral loadFigure 5
Comparison of Tax mRNA load before (A) and after (B) adjusting by the HTLV-1 proviral load. The data before
adjustment (A) shows extremely high expression levels in only the cell lines, but that after adjustment shows apparent down-
regulation in ATL cells relative to ACs and cell lines.
10
2
10
3
10
4
10
5
10
6
10
7
10
8
1
10
1
ACs ATL
Cell line
Tax mRNA load
10
2
10
3
10
4
10
5
10
6
10
7
10
8
1
10
1
ACs ATL
Cell line
Tax adjusted
(A)
(B)
Retrovirology 2008, 5:34 />Page 7 of 11
(page number not for citation purposes)
less than infected cells and approximately 10
4
-fold less
than ell lines.
Then, to investigate the mutual expression status in the
three provirus-positive cell types of non-malignant
infected cells, ATL cells, and HTLV-1-related cell lines, the
ratio of HBZ-SI/Tax was calculated. The mean ratio of
HBZ-SI/Tax was 3.7 in infected cells, 330 in ATL cells, and
0.02 in the cell lines, representing an imbalanced expres-
sion between HBZ and Tax in ATL cells and cell lines com-
pared to the base line of the 3.7 in infected cells. This
feature is depicted as a twin dot plot of HBZ-SI and Tax
loads in Figure 6, showing that each cell type distributes
in a specific area implying the characteristic expression
status of HBZ and Tax; ATL cells in an area of high HBZ-SI
and low Tax, infected cells from ACs in the center area
near the ATL cell area, and the majority of cell lines in an
area of high Tax and either high or low HBZ. Interestingly,
four cell lines (MT1, KK1, SO4, and ST1 in Fig 6 corre-
sponding to the symbols of
1),2),3), and 4)
) distributed in the
area of high HBZ-SI and low Tax (the ATL cell area) all
originated from an ATL cell clone, while three other lines
(OMT, MT2, and HUT102 in Fig 6;
5),7), and 8)
) out of 4 dis-
tributed in the area of high-Tax and either high or low-
HBZ-SI were derived from infected cells.
Since loss of HBZ-SI or Tax transcripts in MT1s and under-
estimation of proviral copy number in KK1 was observed
in this study, we examined the genomic structure of the
provirus by DNA PCR amplifying between nucleotides
(nt) 6461 to 8853 including the region of the HBZ gene.
Interestingly, as shown in panel B of Figure 7, the expected
wild-type band of 2393 bp was undetectable for KK1 and
MT1s, whereas MT1s, as shown in panel C, was negative
for the full-length cDNA band (994 bp) derived from
HBZ-SI anti-sense transcripts. These findings suggest that
loss of HBZ and underestimation of the HTLV-1 proviral
load could be in part explained by this genomic altera-
tion.
Dot plot graph for the proviral-adjusted HBZ-SI mRNA load and the proviral-adjusted Tax mRNA loadFigure 6
Dot plot graph for the proviral-adjusted HBZ-SI mRNA load and the proviral-adjusted Tax mRNA load. Each
plot (Y-axis; HBZ-SI/HTLV-1 ratio, and X-axis; tax/HTLV-1 ratio) reveals the characteristic expression balance between HBZ
and Tax in each cell type. ATL samples and AC samples are clustered in a low tax and high HBZ-SI area and in a central area,
respectively. Of HTLV-1-related cell lines, there are two distribution types, one is ATL sample type with high HBZ-SI and low
Tax, and another is a type with high Tax and either high or low HBZ-SI. Open circle; infected cells of ACs, closed circle; ATL
cells, solid triangle; cell lines.
1)
; MT-1,
2)
; KK1,
3)
; SO4,
4)
; ST1,
5)
; OMT,
6)
; KOB,
7)
;MT2,
8)
; Hut102, and
9)
;MT1s.
ው
ውው
ው
ው
ውው
ውው
ውው
ው0
ው
ውው
ው0
ው
ውው
ው00
ው
ውው
ው000
ው
ውው
ው0000
ው
ውው
ው00 ው
ውው
ው000 ው
ውው
ው0000
0.ው
ውው
ው
0.0ው
ውው
ው
0.00ው
ውው
ው
0.000ው
ውው
ው
0.ው
ውው
ው0.0ው
ውው
ው0.00ው
ውው
ው
Tax adjusted load
HBZ-SI adjusted load
2)
3)
4)
5)
7)
6)
8)
1)
9)
Retrovirology 2008, 5:34 />Page 8 of 11
(page number not for citation purposes)
Discussion
Many studies have indicated that Tax is likely to be a cen-
tral player in the induction of ATL. However, nobody has
answered the paradoxical question why T-cell transforma-
tion and clonal proliferation of ATL cells is associated
with a Tax-low or -negative phenotype. HBZ, a novel viral
factor encoded from the minus-strand RNA of HTLV-1, is
expected to play an important role in HTLV-1 biology by
counteracting the action of Tax. Indeed, HBZ has been
shown to interact with the cellular transcription factor
CREB to inhibit HTLV-1 transcription [24]. However,
there has not yet been a comprehensive study regarding
the mutual expression profiles of HBZ and Tax in HTLV-1-
provirus-positive cells, including infected cells, primary
ATL cells, and HTLV-1-related cell lines.
This study demonstrated a ubiquitous expression of HBZ
isoforms, mainly the spliced isoform of HBZ-SI, in almost
all provirus-positive cells. Furthermore, in contrast to Tax,
up-regulation of HBZ was characteristic of primary ATL
cells, although the increase in level was subtle. These
results were supported by previous studies describing that
HBZ mRNA is expressed in all fresh ATL cells and HTLV-1
cell lines [11,12,25], but no quantitative observations
have been reported in a large scale study. First of all, we
evaluated the difference in the expression intensity
between unspliced HBZ and spliced HBZ-SI (correspond-
ing to HBZ (SP1)). Consistent with the data from a small
range of samples by Cavanagh et al. [13], our results in a
large range of samples clarified that HBZ-SI is the most
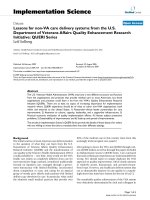
DNA and RT-PCR analyses for the pX region including HBZ gene and for anti-sense transcript, HBZ-SIFigure 7
DNA and RT-PCR analyses for the pX region including HBZ gene and for anti-sense transcript, HBZ-SI. (A):
Schematic representation of HTLV-1 genome at the position of the HBZ antisense ORF, the initiation site of the transcript, and
the primer-setting positions. (B): PCR product band of the genomic region corresponding to the full-length antisense tran-
script. No band of the expected 2393 bp size was observed in the MT1s lane and an aberrant band was detected in the KK1
lane. (C): RT-PCR product band of anti-sense products of HBZ-SI. No band corresponding to the transcript was observed in
MT1s, and only one band was visible in the other samples.
6461bp
A
HTLV-1 genome
ޓޓ
ޓޓޓޓ
ޓޓ HBZ-SI anti-strand mRNA
7305bp
8362bp
994ዾጌ
ዾጌዾጌ
ዾጌ
M
M
KK1
OMT
KOB
SO4
ST1
2393ዾጌ
ዾጌዾጌ
ዾጌ
SO4
KK1
ST1 KOB
OMT
MT2MT1sHut102
B Genomic DNA PCR
C HBZ-SI cDNA PCR
env
LTR
9036bp8281bp
Tax
rex
7814bp
5183bp
2393
bp
6666bp
7292bp
HBZ
7270bp6666bp 8670ޓ
ޓޓ
ޓ8682
1400bp
8868bp6382bp
primer
primer
primer
primer
8853bp
994bp
SO4
KK1
ST1 KOB
OMT
MT2MT1s
Hut102
Retrovirology 2008, 5:34 />Page 9 of 11
(page number not for citation purposes)
abundant isoform, about 4-fold higher than unspliced
HBZ.
Interestingly, HBZ-SI mRNA was detectable in samples
from almost ACs and ATL patients. Furthermore, the HBZ-
SI mRNA load was significantly correlated with the HTLV-
proviral load, but not the Tax mRNA load. On the other
hand, although Tax mRNA was also subtly detectable in
blood samples from ACs and patients with ATL, it was not
correlated with the HTLV-1 proviral load. These results
indicate that the expression profile of HBZ is different
from Tax, namely HBZ is near-equally expressed by all
provirus-positive cells, while Tax levels are variable and
can be actively up-regulated when necessary. In other
words, the absolute amount of HBZ-SI mRNA load is
dependent on the total of infected cells estimated by the
proviral load within samples consisting of a mixture of
infected and non-infected cells. Accordingly, in order to
compare the expression intensity per provirus-positive
cells only, it is reasonable to adjust by dividing the HBZ-
SI mRNA load by the proviral copy number estimated by
the HTLV-1 proviral load [26]. Actually, although the data
before adjustment was generally low in ACs and patients
with ATL, the adjusted data elucidated that there are no or
only subtle differences in HBZ-SI expression level among
infected cells, primary ATL cells, and cell lines. In particu-
lar, the relative HBZ-SI intensity of primary ATL cells and
cell lines to infected cells changed from 1 : 28 : 350 before
to 1 : 6 : 6 after adjustment. This up-regulation of 6-fold
higher levels in primary ATL cells than infected cells is
noteworthy in implication of HBZ for oncogenesis
because it has been suggested that HBZ may play an
important role in HTLV-1 biology by counteracting the
action of Tax. Therefore, we examined the mutual expres-
sion profiles of HBZ and Tax. Our quantification analysis
showed that infected cells express Tax at low levels, while
primary ATL cells down-regulate Tax expression levels by
15-fold, and cell lines highly up-regulate Tax levels by
900-fold (1 : 1/15 : 900). The ratio of HBZ-SI against Tax
was 4 in infected cells, 330 in primary ATL cells, and 0.02
in cell lines. Our data of the 0.02 ratio in cell lines is sim-
ilar to previous data that HBZ mRNA levels are 20- to 50-
fold lower (0.02) than Tax mRNA levels [12,14,27]. All of
these findings indicate a characteristic imbalanced expres-
sion feature of high-HBZ and low-Tax in primary ATL cells
and high-HBZ and very high-Tax in cell lines compared
with a standard expression of low-HBZ and low-Tax in
infected cells.
What does the difference in the mutual expression pat-
terns, such as low-HBZ and low-Tax in infected cells, high-
HBZ and no or subtle-Tax in primary ATL cells, and varia-
ble high or low HBZ and Tax in cell lines mean? Currently,
only the role of Tax is stressed for oncogenic pathogenesis
of HTLV-1, so the co-operative occurrence of up-regulated
HBZ and down-regulated Tax may be closely associated
with the oncogenic process in the early stage and with the
persistent maintenance of malignancy in the late stage.
Interestingly, recent reports on HBZs encoded from the
minus strand of HTLV-1 seem to be providing a new
insight in the current models of Tax-centered HTLV-1
pathogenesis, such as ATL oncogenesis and viral replica-
tion. In particular, the bimodal function of HBZs is of
interest, in which the HBZ protein suppresses Tax transac-
tivation of E2F1 and the HBZ mRNA promotes T-cell pro-
liferation [12,25]. Furthermore, activation of telomerase
is a critical and late event in tumor progression, HBZ also
was reported to have the potential to activate telomerase
through transcriptional up-regulation of hTERT by inter-
action with JunD and to contribute the development and
maintenance of the ATL development [28]. Thus, since
HBZs and Tax are thought to mutually interact with each
other in the process of the multi-step oncogenesis, the
imbalanced expression of HBZ and Tax in ATL cells can
lead to better understand of ATL cell biology.
Another important point of this study is a mutual correla-
tion of Tax and HBZ mRNA expression level in HTLV-1-
associated cell lines. Although Tax mRNA is generally said
to be low or negative in all ATL cells and extremely high
in cell lines, our Tax mRNA quantification clarified that
Tax mRNA was detectable in almost ATL cells at the inten-
sity of approximately 10
4
fold less than that in MT2 cells,
which is consistent with previous results as reported by
Furukawa et al. [29]. In contrast, cell lines are known to
have high levels of Tax mRNA, but our quantitative results
showed that there are two types of Tax expression pattern;
low Tax and high HBZ (ATL cell type) and high Tax and
low (rarely high) HBZ (non-ATL cell type). This inverse
correlation of Tax and HBZ expression may be explained
by the HBZ function to control HTLV-1 replication as
mentioned above (29). However, the existence of excep-
tional cases with both high Tax and HBZ expression sug-
gests that HBZ is not everything to control Tax.
Additionally, the mutual characteristic expression from
cell lines appeared to correlate with its cell origin.
Namely, the cell origin of cell lines having the ATL cell
type of HBZ and Tax expression was a leukemic clone,
while that of the non-ATL cell type was derived from
HTLV-1-infected non-leukemic cells. That is, HTLV-1-
related cell lines preserve the essential Tax and HBZ
expression features of the original cell type.
KK1 and MT1s were found to harbor defective proviruses
involving the pX/HBZ gene region, probably resulting in
the loss of tax and HBZ mRNA expression in the MT1s.
Despite the absence of HBZ, the cells have immortalized
and survived for many generations, suggesting the possi-
bility that HBZ may not be required in ATL cells, at least
in cell lines.
Retrovirology 2008, 5:34 />Page 10 of 11
(page number not for citation purposes)
In conclusion, our study provides better understanding of
multi-step leukomogenesis in ATL through the character-
istic expression of HBZ isoforms. Among the isoforms of
HBZ, HBZ-SI is dominant over non-spliced HBZ. HBZ-SI
is constantly and ubiquitously expressed in all cells har-
boring HTLV-1 provirus and is more highly expressed in
ATL cells than in infected cells. To address ATL cell pathol-
ogy induced by viral factors, it is of importance to evaluate
simultaneously Tax and HBZ mRNA levels and proviral
load.
Abbreviations
HBZ: HTLV-1 basic zipper factor; SBH: Southern blot
hybridization; PCR: polymerase chain reaction; AC:
asymptomatic carriers; HTLV-1: human T-cell leukemia
virus type-1; ATL: adult T-cell leukemia.
Competing interests
The authors declare that they have no competing interests.
Authors' contributions
TU designed the study, and performed the analysis. KY,
KT, KM and HH recruited and monitored the subjects. YY
provided the cell lines. SK made substantial contributions
to the conception and design of the study, wrote and
drafted the manuscript, and contributed to data interpre-
tation.
Acknowledgements
We thank Prof Toshiki Watanabe and Dr Kazunari Yamaguchi, core mem-
bers of the Joint Study on Predisposing Factors of ATL Development, in
conducting this study. This study was supported financially by Japan Society
for the Promotion of Science (No 17390165).
References
1. Uchiyama T, Yodoi J, Sagawa K, Takatsuki K, Uchino H: Adult T-cell
leukemia: clinical and hematologic features of 16 cases. Blood
1977, 50:481-92.
2. Hinuma Y, Nagata K, Hanaoka M, Nakai M, Matsumoto T, Kinoshita
KI, Shirakawa S, Miyoshi I: Adult T-cell leukemia: antigen in an
ATL cell line and detection of antibodies to the antigen in
human sera. Proc Natl Acad Sci USA 1981, 78:6476-6480.
3. Poiesz BJ, Ruscetti FW, Gazdar AF, Bunn PA, Minna JD, Gallo RC:
Detection and isolation of type C retrovirus particles from
fresh and cultured lymphocytes of a patient with cutaneous
T-cell lymphoma. Proc Natl Acad Sci USA 1980, 77:7415-7419.
4. Peloponese JM Jr, Kinjo T, Jeang KT: Human T-cell leukemia virus
type 1 Tax and cellular transformation. Int J Hematol 2007,
86:101-106.
5. Yasunaga J, Matsuoka M: Leukaemogenic mechanism of human
T-cell leukaemia virus type I. Rev Med Virol 2007, 17:301-311.
6. Giam CZ, Jeang KT: HTLV-1 Tax and adult T-cell leukemia.
Front Biosci 2007, 12:1496-1507.
7. Nicot C, Harrod RL, Ciminale V, Franchini G: Human T-cell leuke-
mia/lymphoma virus type 1 nonstructural genes and their
functions. Oncogene 2005, 24:6026-6034.
8. Matsuoka M: Human T-cell leukemia virus type I (HTLV-I)
infection and the onset of adult T-cell leukemia (ATL). Retro-
virology 2005, 2:27.
9. Larocca D, Chao LA, Seto MH, Brunck TK: Human T-cell leuke-
mia virus minus strand transcription in infected T-cells. Bio-
chem Biophys Res Commun 1989, 163:1006-10013.
10. Gaudray G, Gachon F, Basbous J, Biard-Piechaczyk M, Devaux C,
Mesnard JM: The complementary strand of the human T-cell
leukemia virus type 1 RNA genome encodes a bZIP tran-
scription factor that down-regulates viral transcription. J
Virol 2002, 76:12813-12822.
11. Murata K, Hayashibara T, Sugahara K, Uemura A, Yamaguchi T, Har-
asawa H, Hasegawa H, Tsuruda K, Okazaki T, Koji T, Miyanishi T,
Yamada Y, Kamihira S: A novel altemative splicing isoform of
human T-cell leukemia virus type 1 bZIP factor (HBZ-SI)
targets distinct subnuclear localization. J Virol 2006,
80:2495-2505.
12. Satou Y, Yasunaga J, Yoshida M, Matsuoka M: HTLV-I basic leucine
zipper factor gene mRNA supports proliferation of adult T
cell leukemia cells. Proc Natl Acad Sci USA 2006, 103:720-725.
13. Cavanagh MH, Landry S, Audet B, Arpin-André C, Hivin P, Paré ME,
Thête J, Wattel E, Marriott SJ, Mesnard JM, Barbeau B: HTLV-I anti-
sense transcripts initiating in the 3'LTR are alternatively
spliced and polyadenylated. Retrovirology 2006, 3:15.
14. Mesnard JM, Barbeau B, Devaux C: HBZ, a new important player
in the mystery of adult T-cell leukemia. Blood 2006,
108:3979-3982.
15. Shimoyama M: Diagnostic criteria and classification of clinical
subtypes of adult T-cell leukaemia-lymphoma. A report
from the Lymphoma Study Group (1984–87). Br J Haematol
1991, 79:428-437.
16. Miyoshi I, Kubonishi I, Yoshimoto S, Akagi T, Ohtsuki Y, Shiraishi Y,
Nagara K, Hinuma Y: Type C virus particles in a cord T-cell line
derived by co-cultivating normal human cord leukocytes and
human leukaemic T-cells. Nature 1981, 294:770-771.
17. Yamada Y, Sugawara K, Hata T, Tsuruta K, Moriuchi R, Maeda T, Ato-
gami S, Murata K, Fujimoto K, Kohno T, Tsukasaki K, Tomonaga M,
Hirakata Y, Kamihira S: Interleukin-15 (IL-15) can replace the
IL-2 signal in IL-2-dependent adult T-cell leukemia (ATL)
cell lines: expression of IL-15 receptor alpha on ATL cells.
Blood 1998, 91:4265-4272.
18. Maeda T, Yamada Y, Moriuchi R, Sugahara K, Tsuruda K, Joh T, Ato-
gami S, Tsukasaki K, Tomonaga M, Kamihira S: Fas gene mutation
in the progression of adult T cell leukemia. J Exp Med 1999,
189:1063-1071.
19. Hasegawa H, Yamada Y, Harasawa H, Tsuji T, Murata K, Sugahara K,
Tsuruda K, Ikeda S, Imaizumi Y, Tomonaga M, Masuda M, Takasu N,
Kamihira S: Sensitivity of adult T-cell leukaemia lymphoma
cells to tumour necrosis factor-related apoptosis-inducing
ligand. Br J Haematol 2005, 128:253-265.
20. Kamihira S, Sugahara K, Tsuruda K, Minami S, Uemura A, Akamatsu
N, Nagai H, Murata K, Hasegawa H, Hirakata Y, Takasaki Y, Tsukasaki
K, Yamada Y: Proviral status of HTLV-1 integrated into the
host genomic DNA of adult T-cell leukemia cells. Clin Lab Hae-
matol 2005, 27:235-241.
21. Uemura A, Sugahara K, Nagai H, Murata K, Hasegawa H, Hirakata Y,
Tsukasaki K, Yamada Y, Kamihira S: An ATL cell line with an IgH
pseudo-rearranged band pattern by southern blotting: a pit-
fall of genetic diagnosis. Lab Hematol 2005, 11:8-13.
22. Kamihira S, Dateki N, Sugahara K, Hayashi T, Harasawa H, Minami S,
Hirakata Y, Yamada Y: Significance of HTLV-1 proviral load
quantification by real-time PCR as asurrogate marker for
HTLV-1-infected cell count. Clin Lab Haematol 2003, 25:111-117.
23. Kamihira S, Dateki N, Sugahara K, Yamada Y, Tomonaga M, Maeda T,
Tahara M: Real-time polymerase chain reaction for quantifica-
tion of HTLV-1 proviral load: application for analyzing aber-
rant integration of the proviral DNA in adult T-cell
leukemia. Int J Hematol 2000, 72:79-84.
24. Lemasson I, Lewis MR, Polakowski N, Hivin P, Vavanagh M-H, The-
bault S, Barbeau B, Nyborg JK, Mesnard J-M: HTLV-1 bZIP protein
interacts with the cellular transcription factor CREB to
inhibit HTLV-1 transcription. J Virol 2007, 81:1543-1553.
25. Satou Y, Matsuoka M: Implication of the HTLV-I bZIP factor
gene in the leukemogenesis of adult T-cell leukemia. Int J
Hematol 2007, 86:107-112.
26. Yamano Y, Nagai M, Brennan M, Mora CA, Soldan SS, Tomaru U, Tak-
enouchi N, Izumo S, Osame M, Jacobson S: Correlation of human
T-cell lymphotropic virus type 1 (HTLV-1) mRNA with pro-
viral DNA load, virus-specific CD8(+) T cells, and disease
severity in HTLV-1-associated myelopathy (HAM/TSP).
Blood 2002, 99:88-94.
27. Arnold J, Yamamoto B, Li M, Phipps AJ, Younis I, Lairmore MD, Green
P: Enhancement of infectivity and persistence in vivo by HBZ,
Publish with BioMed Central and every
scientist can read your work free of charge
"BioMed Central will be the most significant development for
disseminating the results of biomedical research in our lifetime."
Sir Paul Nurse, Cancer Research UK
Your research papers will be:
available free of charge to the entire biomedical community
peer reviewed and published immediately upon acceptance
cited in PubMed and archived on PubMed Central
yours — you keep the copyright
Submit your manuscript here:
/>BioMedcentral
Retrovirology 2008, 5:34 />Page 11 of 11
(page number not for citation purposes)
a natural antisense coded protein of HTLV-1. Blood 2006,
107:3976-3982.
28. Kuhlmann A-S, Villaudy J, Gazzolo L, Castellazzi M, Mesnard J-M, Duc
Dodon M: HTLV-1 HBZ cooperates with JunD to enhance
transcription of the human telomerase transcriptase gene
(hTERT). Retrovirology 2007, 4:92.
29. Furukawa Y, Osame M, Kubota R, Tara M, Yoshida M: Human T-
cell leukemia virus type-1 (HTLV-1) Tax is expressed at the
same level in infected cells of HTLV-1-associated myelopa-
thy or tropical spastic paraparesis patients as in asympto-
matic carriers but at a lower level in adult T-cell leukemia
cells. Blood 1995, 85:1865-1870.