Encyclopedia of Smart Materials (Vols 1 and 2) - M. Schwartz (2002) Episode 9 ppt
Bạn đang xem bản rút gọn của tài liệu. Xem và tải ngay bản đầy đủ của tài liệu tại đây (1.11 MB, 80 trang )
P1: FCH/FYX P2: FCH/FYX QC: FCH/UKS T1: FCH
PB091-P-DRV January 18, 2002 21:0
762 PEST CONTROL APPLICATIONS
Influence on wild norway rat population
Pre treatment Post treatment
Treatment
1
0.8
0.6
Index of treated results vs total
0.4
0.2
0
−2642
Days
0
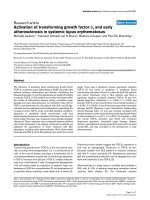
Figure 1. The influence of ultrasonic noise on the Norway rat
population.
Figure 1 shows the effect of treatment on the Norway
rat. Figure 2 shows the effect of the treatment on wild
house mice. The influence on both populations is most sig-
nificant for food consumption. The tracking activity of the
wild house mice is not heavily influenced by the ultrasonic
effect.
The rodents’ hearing was checked before and after the
testing. Only rodents that had good hearing were selected
for the study. It has been postulated that the rodents might
eventually become accustomed to the noise, but this was
not the case. There were instances where rodents were not
influenced, but this was due to hearing loss.
The sound patterns (frequency and amplitude) of four
of the pace electronic pest repeller units were measured.
1
0
−20 2 4 6
Days
81012
0.2
0.4
0.6
Index of treated results vs total
0.8
Pre treatment
Treatment
Post treatment
Influence on wild housemice population
Figure 2. The influence of ultrasonictreatment on the wild house
mice population.
The primary source of total sound output was at 40 kHz
and above. The sound output dropped slightly at 31.5 kHz.
Sound output below 20 kHz was negligible.
CAVITATION AS A DESTRUCTOR
Piezoceramic elements are commonly used to induce cavi-
tation in fluids in biological applications for scaling in-
struments, but killing microorganisms is normally done by
high-temperature sterilization. The erosive effect of cavi-
tation is what is useful in removing a variety of type of
scales. Cavitation is caused when the localized pressure
drops below the fluid vapor pressure. This results in cavi-
tating bubbles.
The collapse of cavitating bubbles is accompanied by a
rapid release of energy. It is the collapse of the cavitat-
ing bubbles that is used to destroy microorganisms. It is
not clear whether the microorganism population is imme-
diately killed by the bubble collapse, or if the population is
just weakened enough to limit its viability.
The generation of cavitation is limited to areas fairly
close to the pressure/sound source. Cavitation can be ap-
plied to a large volume of fluid either by moving the source
through the fluid or by moving the fluid past the source.
The application described here moves the fluid past the
source by pumping the volume through tubing to ensure
fairly even exposure of the liquid to the pressure field. This
does not sterilize the fluid, but it does eliminate a signifi-
cant portion of the microorganism population.
The biological test results available indicate that cavita-
tion does significantly reduce the population in both water
and diesel fuel, butthe effect varies for the typesofmicroor-
ganisms tested. The population reduction is of the order of
50%.
It is expected that piezoceramically induced cavitation
could be used to reduce zebra mussel population in nuclear
reactor water intake tubes by interfering with the zebra
mussels during an early stage of their development, such
as the larval stage.
The specific engineering design that follows was based
on controlling microbial growth in military marine diesel
tanks. These populations are currently controlled by “good
housekeeping” of ships’ tanks and by using environmen-
tally harmful biocides. If an ultrasonic cavitation system
were to be installed on a ship, it would be necessary to in-
clude an antinoise system to cancel the ultrasonic sound
that creates the cavitation. This would be needed to mini-
mize the likelihood that the vessel would be detected by
unfriendly ships.
Engineering Application/Design
The cavitation of a fluid is induced when local pressure
drops below its vapor pressure. It involves the release of
relatively small amounts of energy (compared to boiling),
so that though there is a temperature change in the fluid;
it is small (of the order of 1–2
◦
C, depending on exposure
time and volume).
One of thewell-known side effects of cavitation is itsero-
sive effects on materials. This presents a practical problem
P1: FCH/FYX P2: FCH/FYX QC: FCH/UKS T1: FCH
PB091-P-DRV January 18, 2002 21:0
PEST CONTROL APPLICATIONS 763
Driver
electronics
Cavitation bubbles
Inner tube
Working medium
Piezoceramic rings
Transmission medium
Figure 3. Schematic of cavitation concept.
in trying to use cavitation. The components used to cause
the cavitation need specialconsiderationto survive the ero-
sive environment.
A general requirement for pest control is that it is
needed for large volumes. Cavitation is a fairly local ef-
fect. To apply it to a large liquid volume, the fluid must
be brought into a fairly local range. One way of achiev-
ing this is a flow-through system. The liquid is pumped
through tubesthat are exposed to thecavitating field. Such
an arrangement could involve expenditures of significant
amounts of power.
A flow-through configuration was studied analytically
to achieve maximum fluid cavitation at minimum power
consumption. The particular system modeled was based
on a two-fluid system to avoid the electrode erosion that
would be induced by cavitation. Figure 3 shows the con-
ceptual arrangement. The fluid immediately adjacent to
the electrodes is pressurized to eliminate cavitation. This
fluid is used to transmit energy through a thin-walled pipe
(stainless steel) into the fluid that contains the microor-
ganism. The analytical model of the system was a piezo-
dynamic field modeled by using finite elements. It is based
on a finite element formulation of the piezoceramic ele-
ments, the physical piping structure, a liquid transmis-
sion medium, and the sound pressure field experienced
by the microorganism-borne fluid (either water or diesel
fuel).
The model was then test verified before applying it to a
specific design.
Finite Element Formulation. The finite element method
is an analytic technique for solving general field problems.
It offers a number of advantages over competing meth-
ods. It can handle arbitrary geometries and both static
and dynamic problems. It uses matrix numerical methods
for which very efficient and general algorithms have been
developed.
The special purpose FE formulation developed to han-
dle both the fluid characteristics and the electrical input
(as well as the normalstructuralcharacteristics) was based
on the principles of the FE method in (2). The code mod-
eled the structural behavior of the elements that represent
the piezoelectric components, as outlined in (2, p. 22). The
piezoelectric behavior was included using the approach of
(3, p. 86). The fluid areas of the model were analyzed using
the approach described in (2, p. 540).
The degrees of freedom of the model are the group of
r
nodal displacements of the solid components,
r
nodal pressures of the fluid components,
r
nodal electrical potentials of the piezoelectric compo-
nents, and
r
the junction voltages of an external electrical circuit
connected to the piezoelectric components (this latter
capability was not used, though it is included for pos-
sible future use).
Then, the defining equations of the finite element approach
used are
[A
2
]
d
2
w
dt
2
+ [A
1
]
dw
dt
+ [A
0
]{w}+[A
−1
]
{w}dt
+ [A
−2
]
{w}dt.dt ={b}, (1)
where
[A
2
] =
M 000
SG00
0000
0000
, [A
1
] =
c 000
0 f 00
00 00
00 00
,
[A
0
] =
K
1
ρ
S
T
E 0
0 H 00
E
T
0 −∇
2
0
00 0C
,
[A
−1
] =
0000
0000
0000
000R
, [A
−2
] =
0000
0000
0000
000I
,
{b}=
F
0
Q
Q
N
, {w}=
U
P
ν
.
P1: FCH/FYX P2: FCH/FYX QC: FCH/UKS T1: FCH
PB091-P-DRV January 18, 2002 21:0
764 PEST CONTROL APPLICATIONS
In these equations,
M =
[N
s
]
T
ρ
s
[N
s
]dV
s
S =
S
[N
f
]
T
ρ
f
[N
s
]dS
sf
G =
[N
f
]
1
a
2
[N
f
]dV
f
c =
[N
s
]
T
µ
s
[N
s
]dV
s
f =
[N
f
]
T
µ
f
[N
f
]dV
f
K =
[B]
T
[D][B]dV
p
E =
[B
e
]
T
[][B
e
]dV
p
H =
[∇N
f
]
T
[∇N
f
]dV
f
I = external circuit inductance
C = external circuit capacitance
R = external circuit resistance
U = solid element nodal displacements
P = fluid element nodal pressures
V = external circuit voltages
F = externally imposed force on solid element nodes
Q = externally imposed charges on piezoelectric
elements
Q
N
= externally imposed charges on external circuit
φ = piezoelectric element nodal potentials
a = speed of sound in fluid
where
[N
s
] = shape function matrix for solid elements
[
N
f
]
= shape function matrix for fluid elements
[
B
]
= shape function derivatives giving strain in solid
elements
[
B
e
]
= derivatives of potential shape function in piezo-
electric elements
ρ = mass density (subscript s for solid, f for fluid)
µ = damping (subscript s for solid, f for fluid).
The model assumed axisymmetry which was imple-
mented as described in (2, p. 119). The elements describe
the cross section of the complete unit from the centerline
out, that is, that section which is rotated about the axis
of symmetry to sweep out the 3-D geometry of the unit.
The elements used were eight-node, isoparametric quadri-
laterals, using quadratic shape functions for all fields (2-D
solid displacements, fluid pressures, and electrical fields).
Third-order Gaussian numerical integration was used for
all element integrals. The integrals across volume are
done by the usual finite element approach of integrating
across each elementindependently, followed by assembling
the resulting equations into matrix form, as described in
(2, p. 9).
Damping was included in the model by adding mate-
rial damping to the fluid regions, as described in the pre-
ceding equations. Based on experimental measurements,
enough damping was included to give a resonant amplifica-
tion (Q factor) of 5 to 8. Two extreme conditions were used.
In the first, damping was distributed across both the trans-
mission and working media. In the second, damping was
concentrated in the working medium. The first case corre-
sponds most closely to low excitation levels, whereas the
second should more closely match high excitations when
cavitation is occurring. Then, the energy dissipation will
be concentrated in the working medium because of the
cavitation.
The model is linear. This is expected to give good re-
sults up to the point at which cavitation begins. Beyond
that point, the response of the system is no longer linear
because the fluid behaves effectively less stiff on the nega-
tive side of the pressure wave than on the positive side due
to the formation of cavitating bubbles. In principle, this
effect could be modeled using the nonlinear approaches
described in (2, p. 450). This simplification was accepted
because the objective was to compare alternative designs,
rather than to analyze the behavior in absolute terms. It is
assumed that systems that give a greater linear response
will also give a greater nonlinear response. This may not
be true in unusual cases, and it may not represent the ef-
fect of changes in the spatial distribution of the acoustic
field in all cases (it would be expected that the “softening”
nonlinearity which will occur here would tend to make the
energy distribution more uniform in the system, compared
to the linear case).
Figure 4 shows typical results from the model. These
show the pressure distribution across the fluid cross sec-
tion for 100 volt peak–peak excitation of the piezo rings for
various excitation frequencies. It can be seen that the en-
ergy in the working medium in all cases is concentrated at
the center. At low frequencies, only a single pressure peak
occurs. At higher frequencies, when the wavelength of the
sound waves in the fluid becomes comparable to the di-
mensions of the device, two and then three pressure peaks
Figure 4. Finite element predictions of cavitating field.
P1: FCH/FYX P2: FCH/FYX QC: FCH/UKS T1: FCH
PB091-P-DRV January 18, 2002 21:0
PEST CONTROL APPLICATIONS 765
Table 2. Finite Element Model Parameters
Parameter Material Dimensions
Inner tubing Stainless steel tube 1.5 in outer diameter
(E = 30E6 psi) 0.012 in wall thickness
Piezoceramic rings PZT4 2 in diameter
(stack of four) 0.125 in wall thickness
0.5 in height
Transmission fluid SAE 10W30 motor oil Density,
speed of sound
Working fluid Water or diesel fuel Density,
speed of sound
occur axially along the centerline. These observations are
consistent with qualitative results. These results were ob-
tained by suspending an aluminum foil strip in the cavi-
tating field. Because it is known that cavitation erodes alu-
minum, the distribution and degree of perforation provide
an indication of the cavitating intensity.
The specific parameters of the model are listed in
Table 2.
Test Verification of Analytical Model. Modeling a com-
bined electrical/piezoelectric/structural/fluid system is
complex. A number of approximations and simplifications
were made. For this reason, some model correlation was
done in advance of prototype development (experimental
data taken from breadboard unit). The FE model was done
for a four-ring prototype. The experimental testing was
done on a three-ring arrangement.
There were two type of measurements made for the
correlation exercise, the current–voltage relationship and
sound pressure measurements. The predicted and mea-
sured current versus voltage relationship for the system is
shown in Figure 5. Measured values are shown at 22.7 kHz
10
0
10
0
10
1
10
2
10
−1
10
−2
P-P Piezo current (A)
P-P Piezo voltage (V)
Piezo current vs voltage
Measured at 22.7 kHz
Model at 26.5 kHz
Model at 22.7 kHz
Figure 5. Measured and predicted current vs voltage.
which gives the peak piezo current. Model values are
shown for both this frequency and for 26.5 kHz, which is
the frequency at which the model shows peak current. It
can be seen that the measured values at low voltages are
about 60% of the modeled values. This is mainly due to
the four rings in the model versus three in the breadboard.
The sound pressure field was measuredusing the Specialty
Engineering Associates needle hydrophone, Model SPRH-
2-0500.
Figure 6 shows the response of the hydrophone at two
different excitatory voltage levels, as captured on a digi-
tal storage oscilloscope. Note that the two cases were
at slightly different frequencies. These frequencies corre-
spond to the peak responses at each excitatory level. That
they are different indicates nonlinearity in the model. It
can be seen that the hydrophone response waveform is un-
symmetrical and has pressure spikes on the positive volt-
age (low pressure) side. This is an indication of cavitation.
It is more prominent at the higher excitatory voltage.
The model predicts that the peak pressure in the unit
should be 1 kPa per volt of excitation. The transducer out-
put should be 0.25 mV per volt of excitation. The results
in Fig. 6 show a 20-mV peak-to-peak response at 130-V
peak-to-peak excitation in (a) and 65 mV response at 240 V
excitation, or 0.16 mV/V and 0.27 mV/ V, respectively. This
agreement is reasonable given the uncertainty of the hy-
drophone (it was being used somewhat out of its design fre-
quency range). The model predictsthat thepressure should
lead the voltage by 10 to 20
◦
, and it can be seen that this
is reasonable, though the experimental measurements do
not really allow testing this.
Figure 7 shows the pressure distribution measured
along the centerline of the device for low voltage excita-
tion (where the nonlinearity of the system does not con-
fuse the results), and Fig. 8 shows the pressure distribu-
tion measured across the centerline at the midheight of the
piezo rings. The hydrophone readings in these figures have
been converted to acoustic pressures. The model predic-
tions are also shown. It can beseen thatthe model andmea-
sured values show the same trends and the differences are
1–3dB.
Design Studies
Outer Diameter of Transmission Medium. A design was
studied to optimize the outer diameter of the transmission
medium on the sound intensity in the working medium.
P1: FCH/FYX P2: FCH/FYX QC: FCH/UKS T1: FCH
PB091-P-DRV January 18, 2002 21:0
766 PEST CONTROL APPLICATIONS
0
−150
150
(a)
100
50
0
−50
50
0
−50
−100
20 40 60
Time (µ sec)
Response at 26.8 kHz
80 100 120
0 20406080100120
Piezo excitation (V)Hydrophone output (mV)
100
(b)
50
0
−50
Response at 26.2 kHz
0 20 40 60 80 100 120
−100
20
10
0
−10
−20
0 204060
Time (µ sec)
80 100 120
Piezo excitation (V)Hydrophone output (mV)
Figure 6. Hydrophone response at (a) 130 V p–p excitation;
(b) 240 V p–p excitation.
The integral of acoustic pressure across the volume of the
working medium was used as a performance indicator.
Two extremes of damping models were used—damping
concentrated in the working medium and damping dis-
tributed over both working and transmission media. Fig-
ure 9 shows the results for both cases (as the integral
of pressure vs. the outer diameter, (OD) of the transmis-
sion medium. It can be seen that when damping is concen-
trated in the working medium, the optimum occurs at an
OD of 113 mm because the spacing between the outside
of the piezo ring and the OD of the transmission medium
is about one-half an acoustic wavelength. Such a condition
would be expected to result in translating the high acoustic
impedance condition at the rigid outer wall to a low acous-
tic impedance at the ring [see (8), p. 18 for an example].
This low acoustic impedance of the transmission medium
Rings
Model at 25.0 kHz
13 V P−P Excitation
Measured at 23.7 kHz
Measured at 26.0 kHz
84
82
80
78
76
74
72
70
68
66
−50 500
Z (mm)
Axial pressure distribution on centerline
P−P Pressure (dB re 1 Pa)
Figure 7. Acoustic pressure distribution along centerline.
at the ring is mismatched to that of the ring so that the
coupling between the ring and transmission medium is
poor at the outside of the ring. Little energy is launched
outward from the ring, leaving more to be launched inward
to the working medium.
The figure also shows that when damping is distributed
across both transmission and working media, the optimum
occurs at a lower OD. This may be due to the fact that
when damping is included in the transmission medium,
the increase in transmission medium volume, which oc-
curs as its OD is increased, results in more energy losses
in the system, thus biasing the optimum to a smaller
diameter.
84
82
80
78
76
P−P Pressure (dB re 1 Pa)
74
72
70
68
66
−10
r/R
1
13 V P-P Excitation
Measured at 26.0 kHz (assumed symmetrical)
Measured at 23.7 kHz (assumed symmetrical)
Model at 26.0 kHz
Radial pressure distribution at ring mid-height
Figure 8. Acoustic pressure distribution across diameter at ring
midheight.
P1: FCH/FYX P2: FCH/FYX QC: FCH/UKS T1: FCH
PB091-P-DRV January 18, 2002 21:0
PEST CONTROL APPLICATIONS 767
0
30
25
20
15
10
5
OD (mm)
Effect of outer diameter
10
0
70 75 80 85 90 95 100 105 110 115 120
70 75 80 85 90 95 100 105 110 115 120
2
4
6
8
Integral (PdV) (Pa.m
^3
)Integral (PdV) (Pa.m
^3
)
Distributed damping
Prototype design
Working fluid only damping
Figure 9.
F
f
0
Power
Acoustic
νs φ.
Electronics Concept. Three electronics concepts were
considered, and two were experimentally evaluated:
r
a function generator to produce a sinusoidal (or other)
waveform and a power amplifier to generate a final
high-power output signal to be sent through a trans-
former to the piezo elements in themechanical module
r
a high-power oscillator
r
a switching power supply
The first approach was used in prototype testing and de-
velopment. It was not continued in the higher power, high
flow-rate evaluation unit because the readily available
Switched
voltage
source
3 - Pole
butterworth
low-pass
filter
Coil to
produce
tuned circuit
with piezo
Piezo
model
1.53 mH
L
1
L
T
8.49nF 8.49nF
C
1
C
2
R
T
R
P
C
P
100
21.2nF
1.91mH
Figure 10. Electronics concept.
power amplifiers are limited in power (so would have to
be ganged to drive the larger system) and the class A am-
plifier action used is relatively inefficient, making cooling
of the electronics an issue.
The high-power oscillator was not developed because
of concerns of achieving high power without instability
problems.
The switching power supply was used for designing
the evaluation unit. It is in line with current methods of
driving high-power motors using pulse-width modulation
(PWM). Digital circuitry is used to generate square wave-
forms. These may be duty-cycle modulated and are used
to switch power MOSFET transistors on and off rapidly
so that the average voltage presented to the equipment
as a result of the variable duty-cycle appears sinusoidal.
Such an approach is efficient because the transistors are
always completely on or completely off (except during short
switching transients), and they dissipate little power in ei-
ther of these states. In our case, the output frequencies
are too high for true PWM, but square waves can be gen-
erated at these frequencies and filtered to eliminate higher
harmonics.
Figure 10 shows an electronic filtering concept evalu-
ated by analysis. A high voltage supply that has positive
and negative polarity and a 33% duty cycle is switched on
and off. The fundamentalfrequency of thesource is 25kHz.
This is followed by a three-pole low-pass filter that has
a cutoff at 62.5 kHz. The output from this filter feeds a
tuned circuit that represents the piezo rings (21.2-nF ca-
pacitance and a 100-ohm resistor to simulate a system Q
of 3) in series with an inductance chosen to tune the cir-
cuit to the 25 kHz fundamental. This makes the driven
system of this tuned circuit appear resistive at the funda-
mental frequency and so matches the low-pass filter’s out-
put impedance expectation. Note that no transformer is
shown, though by adding a transformer between the filter
and the piezo, lower voltages would exist in the left-hand
P1: FCH/FYX P2: FCH/FYX QC: FCH/UKS T1: FCH
PB091-P-DRV January 18, 2002 21:0
768 PEST CONTROL APPLICATIONS
10
1
10
2
10
0
10
−2
10
1
10
2
10
1
10
2
Freq (kHz)
10
0
10
−1
Voltage across piezo (V)Power spectral density (arbitrary units)
10
−2
10
−3
Spectral content for 33% duty cycle +/− square wave PWM
Frequency response (voltage across piezo for 1 V PWM input)
PWM input voltage
Piezo voltage
Figure 11. Frequency response function of electronics concept.
side of the circuit which would probably ease component
choice.
Figure 11 shows the calculated frequencyresponsefunc-
tion. It also shows the spectral content of the voltage out of
the switched power supply and into the piezo. The output
from the switched power supply it is assumed, is both posi-
tive and negative in the 33% duty cycle and has switching
transients 25% as long asthe on-time, that is, 1.67 µs. Sum-
ming all power above the fundamental to 250 kHz gives a
total harmonic distortion figure of 71% for the switched
power supply output that has this waveform, but only 4%
for the voltage across the piezo.
A breadboard of this system was built and tested. It was
felt that the advantages of the switching amplifier concept
outweighed its disadvantages for a production application.
A commercial supplier (Instruments Inc. of San Diego CA)
was found.
Implementation Issues. The thin walled stainless steel
tube that contains fluid-borne microorganisms was de-
signed to be as thin as possible to maximum the pressure
transmitted through to the fluid. The thickness is limi-
ted by the pressure in the transmission medium. The thin
walled tube is fairly close to buckling under the pressure
of the transmission medium.
In the prototype system, there was no pressuresensor to
ensure that the pressure of the transmission medium was
maintained between 30–100 psi. The small temperature
change (1–2
◦
C) that results from the excitation of the
system causes the pressure to vary. The temperature
change is kept to this low level by pumping the working
fluid continuously past the transmission medium. During
biological evaluation of the prototype system, the pressure
did drift above 100 psi. After completing of prototype
testing, the system was dismantled, and it was discovered
that the tubing had buckled.
The evaluation unit which was built as a follow-on to
the prototype includes both a temperature and pressure
sensor as part of the design. This ensures that the system
will shut down before the critical pressure is exceeded. In
an early version of the evaluative design (which contained
16 piezo rings, rather than the original four), the stainless
steel tubing did buckle because the unsupported length of
the tubing had more thandoubled.Modifications ofthe tub-
ing boundary conditions weremadeto ensure that buckling
did not occur but at the same time maintained as thin a
profile as possible to maximize the energy transfer to the
microorganism-borne fluid.
Another significant issue that arose during early test-
ing of the evaluative system relates to the importance of
tolerancing the rings themselves. After short runs of the
16-ring stack system, failures in the rings occurred. They
were failing mechanically—breaking into two pieces. The
initiation of the crack seemed to be associated with a burn
mark on the ring. It was postulated that the set of rings be-
ing used was not sufficiently well toleranced for roundness.
The system was rebuilt using rings of improved tolerance
(proved by Sensor Technologies of Collingwood, Ontario).
There have been no ring failures since the system was
rebuilt.
The original electronic driveforthesystem was based on
square wave input switching. When this was implemented,
switching noise was feeding back to the input, causing
noise spikes that were outside the acceptable range of the
microprocessor. To eliminate this problem, the signal gen-
erator was rebuilt to use sine wave excitation.
Figure 12 shows a drawing of the cavitation portion
of the system. The elements of the figure are as listed in
Table 3.
Effectiveness of Cavitation in Destroying Microorganisms
The effectiveness of using a cavitation field to destroy mi-
croorganisms was measured for two types of fluid hosts
(water and diesel fuel) (9) and three types of microorgan-
isms:
r
Serratia marcescens
r
Pseudomonas aeruginosa
r
Saccharomyces cerevisiae (yeast)
The fitted results are shown in Fig. 13, plotted as a function
of exposure timeto the cavitation field. Regression analysis
was used to fit the data to the following equation:
log
Irradiated
Control
= (Slope ×Time) + const. (2)
These test results were for microorganisms exposed to
cavitation while the working medium was moving (be-
ing pumped) through the cavitation field. Earlier test re-
sults were performed while the medium was static during
P1: FCH/FYX P2: FCH/FYX QC: FCH/UKS T1: FCH
PB091-P-DRV January 18, 2002 21:0
PEST CONTROL APPLICATIONS 769
11
12
13
14
15
16
17
18
I
10
9
8
7
6
5
4
3
2
1
Figure 12. Cavitation unit—16 ring.
exposure to the cavitation field. The cavitation effect was
more pronounced on the moving population than on the
static population. It was hypothesized that the motion en-
sured improved distribution of the microorganisms in the
cavitation field.
There were two different strains of Pseudonomas aeru-
ginosa used in the study. Tests in water were done using
ATCC 10145. A strain of Pseudonomas aeruginosa was
isolated from a sample of marine diesel fuel. This strain
would not survive at elevated temperatures (37
◦
C) where
the ATCC 10145 thrived.
Table 3. Parts of Cavitation Unit
Drawing Label Part
1 Lower sealing flange
2 Hydraulic O-ring
3 Lower flange
4 Hydraulic O-ring
5 Body
6 Body assembly rods
7 Flow-through tubing
8 Supporting ring
9 Hydraulic O-ring
10 Hydraulic O-ring
11 Upper flange
12 Upper supporting ring
13 Hydraulic O-ring
14 PZT ring, 2.0 in OD
15 Middle PZT supporting ring
16 PZT Assembly rods
17 Self-locking nuts
18 Lower PZT supporting ring
10
0.001
0 5 10 15 20
0.01
0.1
1
Treated/control
Exposure time(s)
Flow through testing
Saccharomyces
(yeast)
Pseuds in water
Serratia in water
Pseud in diesel
Serratia in diesel
Pseud 'isolate'
in diesel
Figure 13. Biological test results.
The results werebased on a flow-through testing system
that involved recirculating the population to obtain the re-
quired exposure time. Figure 14 shows a schematic of the
experimental facility. The contaminated working fluid was
recirculated during testing. This eliminated the need for
disposal of large volumes of contaminated fluid. The re-
circulating effect underestimates the effectiveness of the
method because the population is being gradually reduced
for each pass through the cavitation field.
It had been postulated that the pumping action itself
might influence the microorganism population, but that
effect was studied and found insignificant on either the
Serratia marcescens or the Pseudomonas aeruginosa.
There did seem to be a small effect on the yeast results.
An attempt was made to predict the kill efficiency of a
single pass of the population through the cavitation field.
Kill efficiency e is the ratio of microorganisms per unit vol-
ume of fluid killed in one pass to microorganisms present
in an untreated unit volume of fluid.
6
UDM experimental facility
1
8
7
5
4
3
2
1 − Cavitator
2 − Tank for treated water
3 − Tank for contaminated water
4 − Control valves
5 − Pump
6 − Power supply
7 − Hydraulic cylinder
8 − Screw
Figure 14. Schematic of flow-through experimental facility.
P1: FCH/FYX P2: FCH/FYX QC: FCH/UKS T1: FCH
PB091-P-DRV January 18, 2002 21:0
770 PHOTOCHROMIC AND PHOTO-THERMO-REFRACTIVE GLASSES
NOTATION
C
o
= initial concentration (microorganism’s/litre)
C
n
= concentration after n passes through cavitation
field
e = kill efficiency
n = number of times sample passed through
cavitation field
V = volume of cavitation field
X = holding tank volume
C
n
C
o
=
X − e × V
X
n
(3)
When this equation is applied to the yeast test data ob-
tained, the resulting kill efficiency is 0.49. When it is ap-
plied to the test results for Pseudomonas aeruginosa in
diesel fuel, the resulting kill efficiency is 0.45. These re-
sults were based on an exposure time of 3.15 seconds in
the cavitation field.
BIBLIOGRAPHY
1. A.D. Ashton. Laboratory Evaluation of Ultrasonic Devices:
Weitech Electronics,
2. O.C. Zienkiewicx, The Finite Element Method. McGraw-Hill,
NY, 1977.
3. K. Ragulskis, R. Bansevicius, R. Barauskas, and G.
Kulvietis, Vibromotors for Precision Microrobots. Hemisphere,
NY, 1988.
4. Modern Piezoelectric Ceramics, Morgan Matroc Vernitron
Division, Bedford, OH, 1988.
5. J.R. Frederick, Ultrasonic Engineering. Wiley, NY, 1965.
6. S.S. Save, A.B. Pandit, and J.B. Joshi, Chem. Eng. J. 55 B67–
B72 (1994).
7. A.J. Chapman, Heat Transfer. Macmillan, NY, 1967.
8. G.L. Gooberman, Ultrasonics: Theory and Application. Hart P,
NY, 1969.
9. S. Draisey. Ultrasonic Destruction of Microorganisms in Ship-
board Fuels: Biology Report. Canadian National Defence Re-
port, DREA CR 98/426.
PHOTOCHROMIC AND
PHOTO-THERMO-REFRACTIVE GLASSES
L.B. GLEBOV
University of Central Florida
Orlando, FL
INTRODUCTION
Inorganic glasses are the main transparent material,
which people have long used for observation (windows
in buildings, windshields in cars, eyeglasses, prisms and
lenses in optical instruments), light delivery (light bulbs,
projectors, lasers, optical fibers), and fine arts (crockery,
bijouterie, jewelry). The ability of glasses to change colo-
ration after exposure to sunshine was well known since
the last century. A new era in glass application was started
in 1949 by S.D. Stookey’s publication (12) in which record-
ing a permanent photographic image in silicate glass was
described. This two-step process of exposure to UV radia-
tion and thermal developmentthatresulted in a crystalline
phase precipitation in the exposed areas was similar to
the classical photographic process. As a result of inten-
sive research during a long period of time, a great number
of different photosensitive glasses were developed, which
have found very wide application in different branches of
industry and personal use. When exposed to optical radia-
tion, these glasses (andglassceramics) change their optical
properties (absorption, refraction, or scattering) instantly
or after thermal development, permanently or transiently.
Among the great variety of photosensitive glasses, we em-
phasize only the two most widely used types.
The largest commercial application was obtained for
so-called “photochromic glasses,” which exhibit reversible
coloration after exposure to UV or visible light and can
vary their absorption depending on the illumination level.
Glasses that contained small concentrations of microcrys-
tals of silver and copper halides, proposed by Armistead
and Stookey in 1965 became the most widely used for
reversible coloration (13). A peculiarity of these materi-
als is that they are produced by glassmaking technology
whereas the photochromic processes occur in microcrystals
distributed in the glass matrix. Several hundred original
papers were dedicated to different aspects of heteroge-
neous photochromic glasses in those years. The vast biblio-
graphy and detailed descriptions of these heterogeneous
photochromic glasses were collected in books (3,4), and
therefore we will not include a list of original publications
in this article.
Another type of photosensitive glass, which is beginning
its application in optics and photonics right now, is “photo-
thermorefractive (PTR)” glass. If this glass is exposed to
UV radiation followed by heat treatment, it varies in re-
fractive index. Aphase hologram in thevolume of this glass
was recorded in 1990 by Glebov and coauthors (5). The fea-
ture of this process is that homogeneous glass is exposed
to light and a microcrystalline phase is produced in the
volume of the glass matrix by a thermodevelopment pro-
cess. No books have been written on this subject. The main
results concerning phase hologram recording in glasses
can be found in a few original papers (5–7) and a survey
(8). Similar processes of photoionization followed by ther-
moinduced crystallization were studied for single- and full-
color photography in polychromatic glasses, as described in
(1, 9–12). Thus, these references can also be used for
learning the basic physical phenomena that result from
irradiation and development of PTR glasses. Some basic
data concerning intrinsic absorption, electronic excitation,
and nonlinear photoionization in multicomponent glasses
can be found in (13,14).
PHYSICAL PRINCIPLES OF PHOTOSENSITIVITY
IN GLASSES
Photosensitivity is the variation in glass properties from
exposure to optical radiation. Photoinduced processes can
be caused by the absorption of light and consequent
P1: FCH/FYX P2: FCH/FYX QC: FCH/UKS T1: FCH
PB091-P-DRV January 18, 2002 21:0
PHOTOCHROMIC AND PHOTO-THERMO-REFRACTIVE GLASSES 771
10
3
10
2
10
1
10
0
10
−1
1234
Photon energy, eV
Wavelength, nm
4
56
1
2
Absorption, cm
−1
1000 500 400 300 200
3
Figure 1. Absorption spectra of 25Na
2
O–75SiO
2
glass. 1: intrin-
sic absorption; 2 and 3: extrinsic absorption of 0.1 wt.% of Fe
3+
and Fe
2+
, respectively; and 4: color center generation spectrum
(arbitrary units).
excitation of electrons fromground to upper levels bywhich
these electrons can be delivered to other places (we will
not consider heating and posterior melting or ablation).
Absorption spectra of solids may be conventionally divided
into three groups. Absorption due to electron transitions
in defect-free substances of stoichiometric composition is
called “intrinsic,”“basic,” or “fundamental” absorption. The
absorption in atoms or molecules that are present as small
additives is called “extrinsic,” or “dopant,” or “impurity” ab-
sorption. The absorption by defects in the host substance
created by chemical or physical effects is called “induced,”
or “additional,” or “defect” absorption.
The absorption spectra of widespread alkali silicate
glass, which is thebasis of themajority of technical glasses,
are presented in Fig. 1. Intrinsic absorption (curve 1) is in
the range of 210 nm (6 eV) and exhibits an exponential
dependence of the absorption coefficient on photon energy
(or wave number). This absorption is caused by basic struc-
tural units of silicate glass (Si–O–Na), which are called L
centers. An example of extrinsic absorption in 25Na
2
O–
75SiO
2
glass is shown by curves 2 and 3 for ferric (Fe
3+
)
and ferrous (Fe
2+
) ions, which determine the actual ab-
sorption of commercial silicate glasses in the near IR, visi-
ble, and near UV spectral regions. Induced absorption pro-
duced by UV and γ radiation (Fig. 2) is causedby ionization
in the glass matrix and further trapping of electrons and
holes at different glass matrix defects. The presence of dif-
ferent dopants and impurities results additional induced
absorption bands. Extrinsic absorption can be caused by
additional ions distributed in the glass matrix and also
by bigger units, for example, microcrystals. The absorp-
tion spectra of borosilicate glass doped with copper and
chlorine, which has undergone heat treatment, are shown
in Fig. 3. Instead of absorption of copper ions in the glass in
the far UV region, a narrow absorption peak near 380 nm
(3.25 eV) is seen in these spectra, which corresponds to
excitons in CuCl crystals precipitated in the glass matrix
as the result of heat treatment. Induced absorption can
0.6
0.4
Optical density
0.2
12345
2
6
300 K
77 K
1
1000 400 300 200
H
E
Wavelength, nm
Photon energy, eV
Figure 2. Induced absorption spectra of 25Na
2
O–75SiO
2
glass.
1: exposure to UV at 77 K; 2: γ irradiation at 300 K. Arrows show
the positions of the absorption bands of electron (E) and hole (H)
color centers.
0
50
100
400 350 250300
Wavelength, nm
3.2 3.6 4.0 4.4 4.8
Photon energy, eV
Absorption, cm
−1
1
2
3
Figure 3. Absorption spectra of borosilicate glass doped with cop-
per and chlorine after 2 hours of treatment at T(
◦
C): (12) 550, (13)
600, (3) 650.
also be produced by relatively big particles. Photoinduced
precipitation of microcrystals of such metals as gold, silver,
and copper causesadditionalabsorption, usually called col-
loidal coloration.
Glass exposure to radiation whose photon energy is
more than the intrinsic absorption edge (curve 1 in Fig. 1)
causes photoionization in the glass matrix followed by the
generation of both electron and hole color centers. The
dependence of the induced absorption on the photon en-
ergy (or wavelength) is called the color center generation
spectrum or the spectrum of photosensitivity (curve 4 in
Fig. 1). Photoionization in the glass matrix (generation of
both electron and hole centers) is impossible if the pho-
ton energy of the exciting radiation is less than a bandgap,
which is determined by the position of the intrinsic absorp-
tion (curve 1 in Fig. 1). In other words, the long wavelength
P1: FCH/FYX P2: FCH/FYX QC: FCH/UKS T1: FCH
PB091-P-DRV January 18, 2002 21:0
772 PHOTOCHROMIC AND PHOTO-THERMO-REFRACTIVE GLASSES
edge of the color center generation spectrum (curve 4 in
Fig. 1) coincides with the intrinsic absorption edge (curve 1
in Fig. 1).
The photosensitivity spectrum can be shifted to the long
wavelength side if the glass is doped with some ions in a
lower valence state, and the dopant’s excited level is placed
above the threshold of the charge carrier’s mobility. In this
case, a mobile electron can be trapped eitherby defect at an
intrinsic electron center formation or by another dopant,
that is, to recharge the activators. The depth of the dopant
ground level in Na
2
O–3SiO
2
glass is 5.2 eV for Fe
2+
, 5.0 eV
for Tb
3+
, and 3.6 eV for Ce
3+
. Comparison of these values
with curve3 in Fig. 1 shows that the ionization threshold of
Fe
2+
corresponds to the long wavelength edge of the absorp-
tion band whose maximum is at 6.5 eV (191 nm). Excita-
tion using smaller photon energy causes tunnel ionization
whose efficiency is about one to two orders of magnitude
less than that of over-barrier ionization. The thresholds
of tunnel ionization of dopants in Na
2
O–3SiO
2
glass are
3.5 eV for Fe
2+
, 3.1 eV for Tb
3+
, and 3.1 eV for Ce
3+
. Refer-
ring Fig. 1, one can see that the tunnel ionization of Fe
2+
is obtained at an excitation of the long wavelength bands
whose peaks are at 5.1 and 4.4 eV (243 and 282 nm) up to
3.5 eV (350 nm). Unlike intrinsic ionization that inevitably
produces electron and hole centers, the only hole center
generated from the excitation of dopant absorption bands
is the same (but oxidized) dopant ion. All newly created
centers are electron centers (either intrinsic or extrinsic).
The other way to shift photosensitivity to the long wave-
length side is to use nonlinear ionization produced by pow-
erful optical irradiation. In silicate glass exposed to pulsed
radiation whose photon energy is more than half of the
bandgap (hν>3eV,λ<400 nm) and whose irradiance is
more than 1 MW/cm
2
, both electron and hole color centers
appear as a result of two-photon ionization in the glass
matrix. The final concentration of color centers is deter-
mined by equilibrium between two-photon generation and
single-photon bleaching of color centers.
INDUCED COLORATION OF REVERSIBLE
PHOTOCHROMIC GLASSES
Generally, the term photochromism may be treated as any
variation of color induced by optical radiation, but usu-
ally people use a narrower definition, which excludes irre-
versible color changes. So, photochromism is a reversible
variation in color (i.e., of the absorption spectrum or spec-
trum of attenuation) of a material under optical radiation
that relaxes when exposure stops. Naturally, when experi-
mental conditions are changed, for example, a temperature
change, the magnitude of the photochromic effect can vary
(even to complete disappearance). Therefore, we shall call
a photochromic material one that, under specified operat-
ing conditions, becomes colored by optical radiation and
restores its transparency after radiation ceases.
Relaxation of induced absorption after illumination
ceases is usually caused by thermal fading of color cen-
ters, which are not stable at a given temperature. This
is the most important feature of photochromic materials
because reversibility of the photochromic effect means the
absence of any stable induced centers generated by illu-
mination. A great number of electron and hole color cen-
ters in silicate glasses produced by UV radiation (Fig. 2)
leads to fatigue because of the progressive accumulation of
stable color centers. This is the reason that these glasses
are not used as photochromic materials, although pho-
tochromism was discovered in cerium-doped, reduced sili-
cate glasses. Glasses doped with microcrystals of silver and
copper halides (Fig. 3) show complete reversibility of colo-
ration at room temperature and therefore have the widest
commercial application.
The main feature of photochromic glasses, variable op-
tical density both observed during exposure and upon its
cessation, has to be takenintoaccount to determine charac-
teristics such as integral and spectral sensitivity, darken-
ing degree and rate, thermal fading, and optical bleaching
rates. Let us define the main concepts required for pho-
tochromic material characterization. Light absorption (or,
more exactly, light attenuation or losses, that is the sum
of absorption and scattering) is characterized by the trans-
mittance, τ = I
tr
/I
0
(where I
tr
and I
0
are the intensities of
transmitted and incident light, respectively), or the opti-
cal density, D =−log
10
τ . The optical density of a sample
before irradiation (original absorption, clear glass) is D
0
(Fig. 4). The optical density of the sample at the moment
exposure ceases (induced absorption, dark glass) is D
exp
.
The optical density in t seconds of the thermal fading pro-
cess (induced absorption, partially relaxed glass) is D
t
. The
spectral dependences of τ
0
and D
0
are the transmission
or absorption spectra of clear glass. The spectral depen-
dences of τ
exp
and D
exp
are the transmission or absorption
spectra of dark glass. Glass has a gray color if the absorp-
tion (transmission) spectrum is flat in the visible region. A
brown color means that the absorption in the blue region
is greater than that in the red region.
The dependences of D
exp
and D
t
on the time of illumi-
nation or aging are the kinetics of coloration and relax-
ation, respectively (Fig. 4). D
exp
increases when the expo-
sure time increases and comes to the equilibrium level D
e
D
exp
D
t
D
0
t
0
t
exp
Time
Illumination Aging
Optical density
Figure 4. Kinetics of photochromic glass darkening under illu-
mination and fading in the aging process. D
0
, D
exp
, and D
t
are the
optical densities of clear, dark, and relaxed glass, respectively.
P1: FCH/FYX P2: FCH/FYX QC: FCH/UKS T1: FCH
PB091-P-DRV January 18, 2002 21:0
PHOTOCHROMIC AND PHOTO-THERMO-REFRACTIVE GLASSES 773
when the rate of color center generation is equal to the
rate of thermal fading. The criterion of relaxation charac-
terizes the degree of thermal fading in a certain time after
illumination ceases:
K
rel
=
D
exp
− D
t
D
exp
− D
0
(1)
The value of that time interval should be selected on the
basis of the practical applications of a photochromic glass.
Thus, for photochromic lenses used as sunglasses, a time
interval of 180 s is recommended. From Eq. (12), it is ob-
vious that, if a glass has faded completely in that time,
K
rel
= 1. Contrariwise, if the induced absorption has not
reduced at all in that time, K
rel
= 0. Now, there are pho-
tochromic glasses whose K
rel
vary in the entire range from
zero to about one. K
rel
for a particular glass can be changed
by temperature variation.
An important parameter is the spectral sensitivity of
a photochromic material, the dependence of the saturated
photoinduced optical density (D
e
) on the photon energy of
the exciting radiation. This dependence is called the color
center generation spectrum. The absorption edge of pho-
tochromic glass determines the position of the color cen-
ter generation spectrum because photosensitive crystals
absorb exactly in that region (compare curves 1 and 2 in
Fig. 5).The short wavelength edge of thecolor center gener-
ation spectrum is connected with the decrease of the thick-
ness of the layer containing color centers, that is due to the
increase of the glass absorption coefficient. The long wave-
length edge is caused by a decrease in the absorption and
in the efficiency of photosensitive center ionization. These
photosensitive centers are usually copper centers in silver
halide crystals or excitons in a crystalline phase of copper
chloride. Owing to that, the position of the maximum in
the color center formation spectrum does not coincide with
that of any maximum in the photochromic glass absorp-
tion spectrum. Moreover, its position is determined by the
spectral shape of the photochromic glass absorption edge,
1000
1.0
0.8
0.6
Optical density
0.4
0.2
0.0
12345
500
400
300
Photon energy, eV
Wavelength, nm
4
3
2
1
Figure 5. Spectra of glass doped with AgCl(Br). Absorption of
original glass (12) and color centers (3), color center generation
(13) and bleaching (4) efficiency. Sample thickness 5 mm.
is a function of the sample thickness, and drifts to the short
wavelength sideasthe thickness decreases. The absorption
spectrum of an exposed glass doped with AgCl microcrys-
tals is presented in Fig. 5, curve 3. This absorption repre-
sents a wide band in the visible spectral range. The spec-
tral shape of this band is usually ascribed to precipitation
of colloidal silver particles on the surface of halide micro-
crystals. Curve 4 in Fig. 5 shows that excitation of the ab-
sorption band of color centers destroys these centers and
causes optical bleaching. Thus, optical bleaching by visi-
ble light is a process additional to thermal fading, which
accelerates the relaxation of darkened silver halide photo-
chromic glass.
The photosensitivity of photochromic glasses doped
with CuCl can be shifted from the UV region to the long
wavelength side. Virgin photochromic glass is photosensi-
tive only to UV irradiation and cannot be darkened by vis-
ible light. Excitation of glasses doped with CuCl that are
exposed to UV radiation does not produce optical bleach-
ing, as shown in Fig. 5 (curve 4) for silver halide glasses.
On the contrary, initial additional absorption (induced by
UV radiation) can be intensified by additional exposure to
visible and even IR radiation having photon energy much
below the ionization threshold of copper centers. Note that
the power density of long wavelength irradiation must be
high enough to produce this intensification. It is shown in
Fig. 6 that the spectra of additional absorption produced
in this glass after irradiation at various wavelengths are
the same. Consequently, this long wavelength sensitivity
results from generating new color centers by exciting the
same color centers. Therefore this process is called “coop-
erative breeding of color centers.”
The mechanism of two-photon cooperative breeding is as
follows. Initial exposure to UV radiation causes ionization
0.4
0.3
0.2
0.1
Optical density
4005006008001000
321
3
2
1
1.5 2.0
Photon energy, eV
Wavelength, nm
2.5
Figure 6. Spectra of induced absorption in copper halide pho-
tochromic glass (thickness 5 mm) after exposure to radiation at
different wavelengths: (12) 440nm (2.78 eV), (13)633 nm (1.96 eV),
and (3) 1060 nm (1.17 eV).
P1: FCH/FYX P2: FCH/FYX QC: FCH/UKS T1: FCH
PB091-P-DRV January 18, 2002 21:0
774 PHOTOCHROMIC AND PHOTO-THERMO-REFRACTIVE GLASSES
Figure 7. Energy diagram of the first stage
of photochromic glass coloration at (a) short
wavelength coloration, (b) two-photon coopera-
tive breeding, and (c) three-photon cooperative
breeding.
Cu
0
Cu
0
Cu
0
Cu
0
Cu
0
Cu
0
Cu
2−
Cu
+
Cu
2−
Cu
2−
Cu
+
Cu
+
Cu
0
Cu
0
3.25 eV
(a)
hv hv hv
1.96 eV 1.17 eV
(b)(c)
ee e
Valence band
Conduction band
of a photosensitive center (Cu
+
) and generates electrons
and hole centers (Cu
2+
). Then released electrons produce
color centers by reducing copper (Cu
+
) or silver (Ag
+
) ions.
The initial concentration of color centers (Fig. 7a) is deter-
mined by the number of UV-ionized photosensitive centers.
This concentration can be rather small and even invisible
to the naked eye. Linear absorption of two photons of visi-
ble light by two color centers causes a transition of these
centers to excited states (Fig. 7b). Further, these centers
simultaneously transfer the accumulated energy to the
photosensitive centers (Cu
+
) and return to their ground
states. An excited photosensitive center releases an elec-
tron and converts to its ionized state in the same man-
ner as after linear excitation, as illustrated in Fig. 7a. The
released electron is trapped by an acceptor, converts to a
reduced state (Cu
0
), and this is a first stage in generat-
ing a new color center. Thus, the number of color centers
increases after each cycle. This means that induced ab-
sorption increases in the process of exciting previously in-
duced color centers without altering the spectrum of the
induced absorption. The efficiency of this nonlinear pro-
cess is proportional to the squared intensity of the exciting
long wavelength radiation.
The coloration caused by exposure to pulsed IR radia-
tion can be explained similarly to the three-photon cooper-
ative breeding of color centers (Fig. 7c). The latter process
obeys the cubical dependence of efficiency on the intensity
of the exciting radiation. There are several important fea-
tures of cooperative breeding of color centers. The first is a
very high level of additional absorption because photosen-
sitivity in this case is not connected with the sharp absorp-
tion edge of glass (Fig. 5) and a thick slab can be homoge-
neously colored. The second is the opportunity of localizing
colored spots inarbitrary places of the bulk glass. The spots
are produced by focusing the exciting beam because photo-
sensitivity is proportional to the squared or cubical inten-
sity of the exciting radiation and therefore, is concentrated
near the focal plane. The third is an opportunity to store
a latent image produced by UV radiation that can be re-
vealed by photodevelopment.
HETEROGENEOUS PHOTOCHROMIC GLASSES
Photochromic glasses co-doped with silver and copper
halides are heterogeneous materials. They represent
two-phase systems that consist of a vitreous host and dis-
persed photosensitive microcrystals. This is important be-
cause microcrystals show a reversible photochromic effect
without fatigue. However, in a two-phase system, light at-
tenuation iscaused by absorption of each phase and also by
scattering produced by the difference between the refrac-
tive indexes of the crystalline and vitreous components.
Therefore, the parameters of the crystalline phase should
be chosen to prevent strong scattering. The size of the par-
ticle of most photosensitive microcrystals, whose refractive
index is about 2, should be no more than 10–20 nm to keep
scattering below the level of acceptability for optical appli-
cations.
The main approach to producing dispersed microcrys-
tals in a vitreous host is crystalline phase growth as a
result of host glass heat treatment at temperatures from
500–700
◦
C, depending on host composition. These temper-
atures correspond toa viscosity range from 10
10
–10
13
poise.
To secure crystalline phase precipitation, special require-
ments are applied to the host glass. First, this glass should
be an oversaturated solution of the photosensitive phase
(silver and copper halides) that allows effective diffusion
of these components in the temperature range mentioned.
Second, the solubility of the photosensitive components
must drop quickly when cooling to allow the homogeneous
glass to melt at high temperature and the crystalline phase
to precipitate in the secondary heat treatment process. The
last is usually connected with phase separation (immisci-
bility) and altered coordination of different components in
the host glass.
The best glass, which satisfies the requirements men-
tioned before, is alkaline borosilicate glass. This glass ma-
trix is the basis for almost all commercial photochromic
glasses manufactured by a number of companies in differ-
ent countries. Halides (Cl, Br, I) of silver and copper are
photosensitive components, which are added to the batch.
P1: FCH/FYX P2: FCH/FYX QC: FCH/UKS T1: FCH
PB091-P-DRV January 18, 2002 21:0
PHOTOCHROMIC AND PHOTO-THERMO-REFRACTIVE GLASSES 775
Cations such as Mg, Ca, Ba, Zn, Cd, Al, and Pb, or anions
such as P and S are used by different companies as addi-
tions to modify technical and end use properties. These
compositional changes lead to variations in photosensi-
tivity, the criterion of relaxation, and induced absorption
spectra. Photochromic glasses can be divided into two large
groups: silver halide glasses that have small concentra-
tions of copper, which usually exhibit faster relaxation and
lower sensitivity and copper halide glasses that have small
concentration of silver, which exhibit slower relaxation and
higher sensitivity. In silver halide glasses, small additions
of copper are a sensitizer.
The traditional schedule for photosensitive phase cre-
ation, “bottom-to-top,” consists of four stages: melting,
rough annealing and cooling to room temperature, addi-
tional heat treatment (roasting), andfinal annealing. Final
annealing is necessary for stress relaxation because crys-
talline phase precipitation occurs at temperatures above
the glass transition temperature. The other method of sen-
sitization is “top-to-bottom,” which is used for mass pro-
duction because of heat energy saving. In the latter, the
glass casting cools down to roasting temperature but not
to room temperature. It requires the other schedule (time
and temperature) because the most effective growth of nu-
cleation centers occurs at temperatures below the roasting
temperature.
OPTICAL WAVEGUIDES IN PHOTOCHROMIC GLASSES
The largest commercial application of photochromic
glasses is for sunglasses. Tens of millions of photochromic
lenses are produced worldwide each year for this purpose.
However, the alkaline borosilicate origin of photochromic
glasses allows some other applications in modern optics
and photonics. It is well known that these glasses are suit-
able for ion exchange and, consequently, planar and chan-
nel waveguides can be created on this glass. Besides that,
the mildly sloping dependence of photochromic glass vis-
cosity on temperature allows creating of optical fibers. The
optical properties of photochromic waveguides compared
with bulk photochromic glasses are unusual because of
structural transformations in the ion-exchanged layers or
in the drawn fibers and the peculiarities of light propaga-
tion in waveguides. An important feature of ion-exchanged
glass is incompleteness of structural relaxation. The ex-
change of ions that have different radii creates stresses in
glass. These stresses produce strong differences between
the refractive indexes of waveguide modes that are or-
thogonally polarized (birefringence). Compression of sil-
ver halide photochromic glass after substituting Na
+
by
K
+
at temperatures below the glass transition tempera-
ture reaches 1 GPa and produces birefringence up to 20%
of the total refractive index variation, as shown in Fig. 8.
Exposure of waveguides in photochromic glasses to UV
radiation produces reversible coloration. This means that
ion-exchange treatment does not destroy the photosensi-
tive crystalline phase and this technology is available for
photosensitive waveguide fabrication. However, parame-
ters of coloration and relaxation of photochromic wave-
guides are different compared to bulk glass. For silver
1.502
1.498
1.494
Refractive index
15
0510
Distance from surface, mm
TE
TM
Figure 8. Refractive index profiles of photochromic glass after
Na
glass
–K
melt
ion exchange. TE or TM polarizations mean electric
or magnetic field oriented along the surface, respectively.
halide glasses, the criterion of relaxation in waveguides is
more than that in bulk glass. This means that relaxation
in waveguides occurs faster. For copper halide glasses, re-
laxation in the waveguide was not detected, which means
that the coloration of these waveguides is stable. There
is a difference in photosensitivity between different wave-
guide modes. Modes Whith low numbers propagate near
the surface and have lower sensitivity than modes that
have a largenumber and propagate indeep layers. This dif-
ference is caused by copper (which is a sensitizer) depletion
in the surface layer as result of copper exchange for potas-
sium or other ions. This phenomenon can be used for mode
selection.
The other feature of photochromic waveguides is ani-
sotropy of photosensitivity and induced coloration. This
phenomenon is connected with ion-exchange stresses.
Dichroism (the difference between induced absorption for
orthogonal polarizations) is proportional to birefringence
in a waveguide. It is important to note that photosensi-
tive microcrystals are plastic or melted at the tempera-
tures of ion exchange. Therefore, dichroism is determined
by stresses and also by orientation of liquid drops of the
photosensitive phase caused by ion-exchange stresses.
The discrete structure of light propagation in photo-
sensitive planar waveguides gives one more opportunity
for multiplexing by mode selection. If a mode in such a
waveguide (Mode #1 in Fig. 9) is excited by actinic radi-
ation, the waveguide becomes colored. The spatial profile
of induced absorption is determined by the spatial profile
of the exciting modes intensity. As a result, a sort of dis-
tributed absorbing mask will be formed in the waveguide
whose absorption profile is similar to that of the intensity
distribution of actinic radiation in the waveguide. Conse-
quently, losses for mode #1 increase after excitation of this
mode by actinic radiation. The attenuation of other modes
is determined by overlapping of their fields by the dis-
tributed mask, that is, by the field of the mode that induced
this absorption. Because field profiles for the modes that
have different numbers essentially differ from each other
P1: FCH/FYX P2: FCH/FYX QC: FCH/UKS T1: FCH
PB091-P-DRV January 18, 2002 21:0
776 PHOTOCHROMIC AND PHOTO-THERMO-REFRACTIVE GLASSES
Distance
from surface
Refractive index
Mode field profiles
Incident
beam
Transmitted
beam
Absorption
002
2
1 2 Mode #
Figure 9. Sketch of a waveguide mode selector. The darkened
profile corresponds to the exposed mode, which produces a similar
profile of photoinduced absorption and prevents propagation of
this mode.
(Fig. 9), the losses for different modes should be signifi-
cantly different. An example of a mode spectrum of a pla-
nar waveguide excited by actinic radiation in the TE
0
mode
is shown in Fig. 10. A mode selection of about 10 dB/cm
can be reached without special effort in planar waveguides
on commercial photochromic glasses. The problem of mask
bleaching can be solved by using probe radiation at longer
wavelengths, where bleaching is not effective, or using, as
described earlier, cooperating breeding of color centers for
writing by high-power radiation.
Optical fibers were drawn from photochromic glasses. It
was found that thermal treatment of these fibers produces
photochromic properties. Fiber plates were made from pho-
tochromic glass as a core and a transparent optical glass as
a cladding, or vice versa. High contrast was obtained in this
fiber element compared to bulk photochromic glass plate.
This feature of photochromic fiber plate is determined by
gradual leakage of actinic radiation fromtransparent glass
to photochromic glass. This effect increases the length
of the interaction of actinic radiation with photochromic
glass and, consequently, increases dramatically the in-
duced absorption and possible contrast of a photochromic
attenuator.
1
0
01020
Angle, min
30 40 50
Transmission, a.u.
TE
0
TE
1
TE
2
TE
3
Figure 10. Effect of exposure to powerful excitation of the funda-
mental mode (shown by arrow) on the dependence of photochromic
waveguide transmission on the angle of incidence onto the input
coupler prism (spectrum of waveguide modes). Solid lines before
exposure, dashed lines after exposure.
INDUCED REFRACTION THROUGH IRREVERSIBLE
PHOTOINDUCED CRYSTALLIZATION
It is clear that photochromic glasses can be used for record-
ing information. Actually some photos and holograms were
recorded inthese glasses but no great success was obtained
because of small contrast in photographyand small diffrac-
tion efficiency in holography. For highly efficient hologra-
phy, it is necessary to produce variation in the refractive
index but not in the absorption coefficient. The refractive
index in glasses, where color centers are induced by ra-
diation, can vary for very small values, less than 10
−6
.
This is not enough for efficient diffraction. Recent disco-
very of a strong photoinduced refractive index variation in
Ge-doped silica opened a new very promising approach for
efficient Bragg grating recording in optical fibers. Another
approach, which allows an increase of sensitivity of sev-
eral orders of magnitude compared to Ge-doped silica and
avoids interaction between writing and diffracted beams,
is based ona two-step process of exposure and development
in multicomponent silicate glasses doped with fluorine, sil-
ver, and cerium.
Phase volume holograms of high diffraction efficiency
were produced in lithium aluminum silicate and sodium
zinc aluminum silicate glasses doped with silver and ce-
rium by exposure to UV radiation followed by thermal
treatment. Diffraction was caused by a difference in refrac-
tive indexes in exposed (enriched by microcrystals) and un-
exposed (original glass) areas. This phenomenon is called
the “photo-thermorefractive” process. Glasses that possess
these properties are called “photo-thermorefractive” (PTR)
glasses. This two-step process (exposure and thermal de-
velopment that leads to crystallization) was used earlier
to record a translucent image in glass due to light scatter-
ing caused by a difference between the refractive indexes
of the precipitated crystalline phase and the glass matrix.
Later, colored images were recorded in similar glasses by
photothermal precipitation ofanumber of complex crystals
of different compositions, sizes, and shapes.
The sequence of processes, which occurs in these glas-
ses and produces coloration, follows (Fig. 11). The first step
is exposure of the glass to UV radiation, which ionizes a
cerium ion. The electrons released from cerium are then
trapped by a silver ion. As a result, silver is converted
from a positive ion to a neutral atom. This second stage
corresponds to latent image formation, and no significant
changes in optical properties of glass occur, except light
coloration in near UV and blue regions.
The next step in the process is obtained by thermal de-
velopment at elevated temperatures. The high diffusion
coefficient of silver atoms in silicate glasses leads to the
creation of tiny silver crystals at temperatures from 450–
500
◦
C. A number of silver clusters arise in exposed regions
of the glass after aging at these elevated temperatures.
This is the third stage of the process. Further, these sil-
ver particles serve as the nucleation centers for sodium
and fluorine ion precipitation. Cubic sodium fluoride crys-
tal growth occurs attemperatures from 500–550
◦
C because
the PTR glass composition is an oversaturated solution of
these components. This is the last step, which finishes the
photo-thermorefractive process. Further heat treatment
P1: FCH/FYX P2: FCH/FYX QC: FCH/UKS T1: FCH
PB091-P-DRV January 18, 2002 21:0
PHOTOCHROMIC AND PHOTO-THERMO-REFRACTIVE GLASSES 777
(3)
(2)
Ce
4+
Ce
3+
Ag
−
Ag
0
Ag
0
Ag
0
Ag
0
Ag
0
Ag
0
Ag
0
Ag
0
kT
kT
kT
kT
Na
+
Na
+
Na
+
Na
+
Na
+
F
−
F
−
F
−
F
−
Na
+
Na
+
F
−
F
−
Na
+
F
−
F
−
h
ν
e
e
kT
kT
kT
kT
kT
kT
Ag
0
n
Ag
0
n
(1)
(4)
Figure 11. Stages of the photo-thermorefractive process.
leads to the growth of elongated pyramidal complex Na,
Ag–F, Br crystals on the surface of cubic NaF crystals. This
mixture of crystals can produce an opal coloration in large
crystal sizes or a yellow coloration caused by colloidal sil-
ver precipitated on the interfaces of dielectric crystals. A
second exposure to UV followed by a second heat treat-
ment produces a different coloration because of metallic
silver reduction on the surfaces of the dielectric pyramids.
The final resulting coloration depends on the size and as-
pect ratio of these silver particles. These two last steps are
used for photography because strong scattering does not
allow using them in holography.
A refractive index decrease of about 5×10
−4
occurs in
the areas of glasses exposed to nitrogen laser radiation at
337 nm. The refractive index of NaF in the red spectral re-
gion is n
NaF
= 1.32 compared to the refractive index of PTR
glass n
PTR
= 1.49. The small value of the refractive index
change is due to the small volume fraction of the precipi-
tated crystalline phase, which produces no scattering in the
exposed volume. However, it is sufficient to result in highly
efficient Bragg grating recordingin samplesmorethan sev-
eral hundreds of microns thick. This photo-thermoinduced
refraction is stable up to 400
◦
C. The photosensitivity is
in the range of several tens of mJ/cm
2
at wavelengths in
the absorption band region of Ce
3+
, which has a maximum
near 300 nm and a long wavelength tall up to 400 nm. This
means that several commercial lasers such as N
2
, Ar, and
He–Cd, can be used for recording. Once developed, holo-
grams in PTR glass are not destroyed by further exposure
to visible or UV radiation.
PHOTO-THERMOREFRACTIVE GLASS
The composition (mol. %) of PTR glass which was used
for hologram recording is 15Na
2
O–5ZnO–4Al
2
O
3
–70SiO
2
–
5NaF–1KBr–0.01Ag
2
O–0.01CeO
2
. Absorption spectra of
PTR glasses are presented in Fig. 12. Figure 12a shows the
UV part of the absorption spectrum. One can see the wide
absorption band of Ce
3+
that has a maximum at 305 nm.
The short wavelength absorption in the region λ<270 nm
is due to several components, such as Ce
4+
,Ag
+
,Br
−
, and
Fe
3+
. The short wavelength edge, at which writing radia-
tion is attenuated by two times in the recording medium
(optical density about 0.3), is placed at 330 nm for a 1-cm
thick plate and at 265 nm for a 1-mmthick plate. The range
of photosensitivity of this glass is from 280–360 nm.
Absorption of PTR glass is less than 0.01 cm
−1
in the
visible and near IR regions, which is close to the limit of
measurements, and therefore it is not shown in Fig. 12.
One can see in Fig. 12b that detectable absorption occurs
at wavelengths higher than 2700 nm. Absorption in this
spectral region is usually ascribed to different vibrations of
hydroxyl groups in the glass network and reaches several
cm
−1
in regular silicate glasses. Hydroxyl absorption in
fluorine-containing PTR glass is lower compared to similar
fluorine-free silicate glass. This phenomenon is caused by
high volatilization of HF molecules, which can result from
the interaction of fluorine and hydrogen in the glass melt-
ing process. This decrease of IR absorption in PTR glass
results in an opportunity for PTR use in the middle IR re-
gion up to 4300 nm for 1-mm thick specimens.
Additional absorption of PTR glass under UV exposure
that is used in hologram recording in this glass is shown
in Fig. 12c, curve 1. Detectable photoinduced absorption is
seen only in the UV region. Even at the recording wave-
length, this absorption is less 0.1 cm
−1
and cannot impact
the recording process significantly. The small tail of the
induced absorption spectrum in the blue region can be dis-
tinguished by the naked eye as a slight yellow coloration
of the exposed area. Thermodevelopment causes colloidal
silver and sodium fluoride precipitation in the glassmatrix.
Fluoride crystals are colorless and can result in scattering
if the size of the crystals is too large (more than 100 nm).
A shoulder near 450 nm in the additional absorption spec-
trum after thermal treatment in Fig. 12c (curve 2) is as-
cribed to silver particles in glass matrix. One can see that
the visible additional absorption does not exceed 0.3 cm
−1
and 0.03 cm
−1
in the blue and red regions, respectively.
This means that losses in this region do not exceed a few
percent for a 1-mm thick plate. Additional absorption in
the whole IR region is not detectable and therefore is not
shown in Fig. 12c. Consequently, this glass can be used
successfully at all wavelengths important for lasers
and optical communication in the visible and near IR
regions.
P1: FCH/FYX P2: FCH/FYX QC: FCH/UKS T1: FCH
PB091-P-DRV January 18, 2002 21:0
778 PHOTOCHROMIC AND PHOTO-THERMO-REFRACTIVE GLASSES
5
4
3
2
1
0
250
300
He-Cd
Wavelength, nm
Absorption, cm
−1
350
(a)
Wavelength, nm
5
4
3
2
1
0
2500
3500
4500
3000 4000
Absorption, cm
−1
(b)
1000
900800700600500400300
0
0.2
0.4
0.6
0.8
1
1
2
Wavelength, nm
Induced absorption, cm
−1
(c)
Figure 12. Absorption spectra of PTR glass: (a) and (b) original
glass in the UV and IR spectral regions, (c) induced absorption
after exposure to 325 nm for 400 mJ/cm
2
(12) and consequent
thermal development for 1 hour at 520
◦
C (13). Arrow shows the
position of the wavelength of the writing He–Cd laser.
Optical microscopy of exposed and developed samples
used for induced absorption measurements has shown op-
tical inhomogeneities in the exposed region. The structure
of these inhomogeneities appears as a series of parallel,
continuous, aligned filaments whose widths are tens of mi-
crons oriented in the direction of light propagation in the
glass sample. These microscopic features are caused by
structures whose different refractive indexes arise in glass
processing (phase structures). It is proved that these phase
patterns are not an intrinsic feature of PTR glass but are
caused by various defects of the sample bulk and surfaces.
Some additional patterns were found in micrographs; they
are combinations of different rings and fringes. It was
found that they are recordings of the interference pat-
terns produced by matching propagating beams to beams
consequently reflected from the back and front surfaces of
different elements in the optical setup. Diffraction of the
exciting beam on different apertures produces systems of
straight or curved fringes that have variable periods de-
pendent on the shape and position of the aperture. It is
necessary to make special adjustments to eliminate these
interference and diffraction patterns in the plane of the
recording to avoid these parasitic structures. Therefore,
the homogeneity of the photosensitive medium (including
surface and volume defects) and the writing beam (includ-
ing interference and diffraction patterns of low visibility)
must be tested to avoid undesirable losses.
The pattern of probe radiation transmitted through ex-
posed area consists of the zero and first orders of diffrac-
tion but exhibit some rings. The diameters and positions
of these rings on the screen depend on the incident angle
of the probe beam and on the feature of the writing pat-
tern. The origin of these ringsfollows. Each medium causes
scattering of propagating light. Therefore, even for single
beams propagating in a photosensitive medium, one can
observe an interference pattern produced by matching the
original and scattered beams. In this case, the probe beam
used for hologram reading should be scattered twice. The
first time is regular scattering by the medium. The sec-
ond time is scattering produced by a hologram of scattered
light recorded together with the main hologram. This holo-
gram can be completely reconstructed only by the reading
beam of the same wavelength and direction as the writ-
ing beam. When the wavelengths or the directions of the
writing and reading beams are different, the whole holo-
gram of scattered light cannot be read out because its
wavefronts are not planar. At each angle of incidence, the
reading beam can read only that part of the hologram, for
which Bragg conditions are satisfied. Because the angular
diagram of scattering has cylindrical symmetry, this part
should be a ring. All phase defects mentioned (filaments,
fringes, and rings) appear in all materials but they are vis-
ible well in PTR glass because of the high homogeneity and
transparency of this material.
BRAGG GRATINGS IN PTR GLASS
The dependence of the absolute diffraction efficiency of
Bragg gratings recorded in PTR glasses in the thermal
treatment period is shown in Fig. 13. The specimen ex-
posed for 400 mJ/cm
2
has undergone consecutive thermal
treatments for 10–15 minutes each at 520
◦
C and in inter-
vals between, was cooled down to room temperature for
diffractive efficiency measurements. The absolute diffrac-
tion efficiency is
η
A
=
I
1
(1 −ρ)
2
I
L
, (2)
P1: FCH/FYX P2: FCH/FYX QC: FCH/UKS T1: FCH
PB091-P-DRV January 18, 2002 21:0
PHOTOCHROMIC AND PHOTO-THERMO-REFRACTIVE GLASSES 779
0.6
0.4
0.2
0
0 100 200 300 400 500
0.8
1
Thermodevelopment time, min
Diffraction efficiency
Figure 13. Effect of the period of thermal treatment on the abso-
lute diffraction efficiency of a Bragg grating in PTR glass. Expo-
sure 400 mJ/cm
2
at 325 nm, spatial frequency 600 mm
−1
. Devel-
opment at 520
◦
C. Specimen thickness 1.42 mm.
where I
L
and I
1
are the intensities of the incident and
diffracted beams, respectively. The reflection coefficient (ρ)
is calculated by the Fresnel formula ρ = (n − 1/n + 1)
2
.
The dependence of diffraction efficiency versus develop-
ment time has an inflection point at the beginning of the
process and is saturated at the 85% level after long heat
treatment. Note that this multiple heat treatment is not
the same as a regular development for one or several hours
because this procedure includes multiple heating and cool-
ing. However, the curve in Fig. 13 shows a tendency for the
diffraction efficiency to approach a high value after some
exposure at elevated temperature.
The growth of diffraction efficiency in increasing peri-
ods of thermal development is obviously caused by refrac-
tive index changes that result from crystalline phase preci-
pitation. Figure 14 shows the dependence of the refractive
index on the thermal treatment period. This photo-
thermoinduced refractive index was calculated from
0.0002
0.0001
0
0 100 200 300 400 500
Induced refractive index
Thermodevelopment time, min
Figure 14. Effect of the period of thermal treatment on the in-
duced refractive index. Exposure 400 mJ/cm
2
at 325 nm, spatial
frequency 600 mm
−1
. Development at 520
◦
C. Specimen thickness
1.42 mm.
Kogelnik’s equation:
δn =
λ cos arcsin
√
η
R
πd
, (3)
where λ is the wavelength of the reading beam, is
the Bragg angle, and d is the thickness of the specimen.
The linear dependence of induced refractive index on the
thermal treatment period is present in Fig. 14. The func-
tion δn(t) shows no inflection point compared to DE(t)
(Fig. 13). The linear dependence of δn(t) up to the value of
0.00015 allows writing high efficiency holograms in glass
plates more than several hundreds of microns thick. The
optical quality of inorganic glass allows using plates up
to several centimeters thick. The saturation of the diffrac-
tion efficiency in Fig. 13 corresponds to the refractive index
saturation at about 0.00017 in Fig. 14. No oscillations of
diffraction efficiency were recorded in this experiment in
long development periods up to 13 hours. This means that
no significant result exceeding π for the induced phase was
obtained and, consequently, no additional refractive index
growth occurred.
The effect of the spatial frequency of the interference
pattern on the diffraction efficiency of the grating in PTR
glasses is shown in Fig. 15. This was measured in a
thin sample of 1.65 mm in a transmittance configura-
tion when writing (325 nm) and reading (633 nm) beams
were directed from the same side of the glass plate. This
configuration allows spatial frequency variations below
2500 mm
−1
. Exposure or development of gratings was
not optimized for different spatial frequencies. No signif-
icant dependence of diffraction efficiency on special fre-
quency can be observed in the region from 300–2500 mm
−1
in Fig. 15. The absence of a drop in the frequency re-
sponse at low frequencies is a feature of the PTR process,
which requires transport of species in the glass matrix to
build single crystals (tens of nanometers) and does not
require transport of species between exposed and unex-
posed areas, as is necessary in photorefractive crystals. The
0
25002000150010005000
0.2
0.4
0.6
0.8
1
Diffraction efficiency
Spatial frequency, mm
−1
Figure 15. Dependence of the absolute diffraction efficiency on
the spatial frequency of the grating. Exposure 600 mJ/cm
2
at
325 nm, development 90 min. at 520
◦
C. Specimen thickness
1.65 mm.
P1: FCH/FYX P2: FCH/FYX QC: FCH/UKS T1: FCH
PB091-P-DRV January 18, 2002 21:0
780 PIEZOELECTRICITY IN POLYMERS
0.4
0.6
0.8
1
0.2
0
Diffraction efficiency
200015001000
Exposure, mJ/cm
2
5000
Figure 16. Maximum absolute diffraction efficiencies of Bragg
gratings in PTR glasses for different exposures to the radiation of
aHe–Cd laser at 325 nm.
absence of a drop at high spatial frequencies means that
no fringe smearing occurs in the developed interferogram
and, consequently, no detectable diffusion of componentsat
distances comparable with the half-period of the gratings
studied (up to 200 nm) occurs in PTR glass during ther-
mal processing. These data show that diffusion of glass
components in the development process cannot affect the
saturation in Fig. 14, which was observed for gratings that
have a spatial period of 1600 nm. The lack of drop in the
amplitude–frequency response at low frequencies (Fig. 15)
is an advantage of PTR glasses compared to photorefrac-
tive crystals;this results in a distinctopportunity to design
holographic optical elements that have very small diffrac-
tion angles.
An interesting consequence of the low level of induced
losses (Fig. 12c, curve 2) is the rather low sensitivity
of PTR-grating diffraction efficiency on exposure because
underexposure can be compensated for by overdevelop-
ment, and vice versa. Figure 16 illustrates this feature of
PTR glass. In this figure, the best diffraction efficiencies
for specimens of different thickness from different melts,
which had undergone different development procedures,
are plotted versus exposure to the radiation of a He–Cd
laser. Ahighabsolutediffraction efficiency of 80% and more
is observed in Fig. 16 for exposures that ranged between
50 mJ/cm
2
and 5 J/cm
2
.
SUMMARY
Photochromic glasses that have completely reversible col-
oration are made of borosilicate glasses doped with micro-
crystals of copper and silver halides. These glasses are
sensitive to near UV radiation. Photosensitivity can be ex-
tended to visible and near IR regions by cooperative breed-
ing of color centers. Induced coloration is a wide band
that covers the whole visible region. Photocontrolled wave-
guides can be fabricated in photochromic glasses. These
waveguides can serve as attenuators and mode selec-
tors. Photo-thermorefractive glasses that have irreversible
photoinduced refraction are aluminosilicate glasses doped
with silver, cerium, and fluorine. These glasses are sensi-
tive to near UV radiation. Their photosensitivity is com-
parable with the best organic and inorganic materials, it
allows wide variations of exposure because of image am-
plification in the thermal development process, and it has
high diffraction efficiency and high transparency from the
UV to the IR region.
BIBLIOGRAPHY
1. S.D. Stookey, Ind. Eng. Chem. 41: 856–861 (1949).
2. US Pat. 3, 208, 860, 1965, W.H. Armistead and S.D.
Stookey.
3. R.J. Araujo and N.F. Borrelli, in Optical Properties of Glass,
D.R. Uhlmann and N.J. Kreidl, eds., Westerville, OH, 1991:
125.
4. A.V. Dotsenko, L.B. Glebov, and V.A. Tsekhomsky, Physics and
Chemistry of Photochromic Glasses. CRC, Boca Raton, FL,
1997.
5. L.B. Glebov, N.V. Nikonorov, E.I. Panysheva, G.T. Petrovskii,
V.V. Savvin, I.V. Tunianova, and V.A. Tsekhomskii, Sov. Phys.
Dokl. 35: 878 (1990).
6. L.B. Glebov, N.V. Nikonorov, E.I. Panysheva, G.T. Petrovskii,
V.V. Savvin, I.V. Tunimanova, and V.A. Tsekhomskii, Opt.
Spectrosc. 73: 237 (1992).
7. O.M. Efimov, L.B. Glebov, L.N. Glebova, K.C. Richardson, and
V.I. Smirnov, Appl. Opt. in press.
8. L.B. Glebov. Glass Sci. Technol. (Glastechnische Berichte), in
press.
9. S.D. Stookey, G.H. Beall, and J.E. Pierson, J. Appl. Phys. 49:
5114–5123 (1978).
10. N.F. Borrelli, J.B. Chodak, D.A. Nolan,and T.P. Seward, J. Opt.
Soc. Am. 69: 1514–1519 (1979).
11. A.V. Dotsenko, A.M. Efremov, V.K. Zakharov, E.I. Panysheva,
and I.V. Tunimanova, Fiz. I Khim. Stekla 11: 592–595 (1985)
(in Russian).
12. E.I. Panysheva, I.V. Tunimanova,andV.A.Tsekhomskii, Glass
Phys. Chem. 17: 543–549 (1991).
13. V.I. Arbuzov, Glass Phys. Chem. 22: 477–489 (1996).
14. L.B. Glebov, O.M. Efimov, A.M. Mekryukov, and Yu.A.
Matveev, J. Opt. Technol. 62: 780–785 (1995).
PIEZOELECTRICITY IN POLYMERS
A
LEKSANDRA VINOGRADOV
Montana State University
Bozeman, MT
INTRODUCTION
The diverse group of “smart” piezoelectric materials is
distinguished by their ability to react actively to chang-
ing stimuli as a result of converting mechanical to elec-
trical energy and vice versa. Synthetic piezoelectric poly-
mers, an integral part of the “smart” materials group,
exhibit a type of behavior that is often compared with
biological reactions involving transformations of the
sensed information into the desired response. Due to such
P1: FCH/FYX P2: FCH/FYX QC: FCH/UKS T1: FCH
PB091-P-DRV January 18, 2002 21:0
PIEZOELECTRICITY IN POLYMERS 781
special qualities, piezoelectric polymers have been increas-
ingly used in a rapidly expanding range of applications.
At present, these materials continue to offer unprece-
dented design opportunities, leading to the belief that the
industry is on the verge of major technological break-
throughs.
PIEZOELECTRICITY: AN OVERVIEW
Piezoelectricity is a material property that is observed as
an electric charge or voltage produced by applied mechani-
cal forces or, conversely, as mechanical deformation that is
caused by an applied electric field. These piezoelectric ef-
fects have been defined, respectively, as “direct” and “con-
verse.” The latter classification provides a convenient basis
for reference purposes, although it is clear that both phe-
nomena have the same physical origin.
Rapid progress in piezoelectric investigations was made
at the beginning of the twentieth century after Pierre and
Jacques Curie discovered the direct piezoelectric effect in
tourmaline crystals in 1880. Subsequently, piezoelectric ef-
fects were observed and studied in other crystals, such as
quartz, zincblende and Rochelle salt, providing enhanced
understanding of the piezoelectric phenomenon and lead-
ing to new discoveries of piezoelectric effects in a variety
of materials. In the 1940s, research efforts were partic-
ularly focused on the piezoelectric response of ferroelec-
tric polycrystalline ceramics, including lead zirconate ti-
tanate (PZT), lithium niobate, and barium titanate. For
several decades, and, increasingly, toward the mid-1960s,
piezoelectricity was investigated as a common property of
biopolymers, including natural biological materials that
form the structures of plants, animals, and humans. Since
1969, when the strong piezoelectric effect in polyvinylidene
fluoride (PVDF) was first discovered by Kawai, attention
has been attracted to the piezoelectric properties of syn-
thetic polymers. At present, the traditional group of smart
materials involving piezoelectric crystals, ceramics, and
polymers is expanding as a new generation of laminated
composites that have embedded piezoelectric elements has
recently emerged. The history of scientific developments in
the dynamic and growing field of smart materials has been
reviewed in (1–3).
In phenomenological terms, piezoelectricity is described
as coupling between a quasi-static electric field and dy-
namic mechanical motion. Typically, the direct and con-
verse piezoelectric effects have been treated as reversible.
Respectively, the constitutive equations of linear piezoelec-
tricity are based on the principle of energy conservation.
The piezoelectric constitutive law can be presented in sev-
eral alternative forms. One of the formulations is given by
[ε] = [C][σ] + [d]
T
[E],
(1)
[D] = [d][σ] + [e][E],
where [σ] and [ε] denote, respectively, stress and strain
tensors that satisfy the conditionofsymmetry,that is, σ
ij
=
σ
ji
, and ε
kl
= ε
lk
(i = j, k = l); [D] and [E] denote,
respectively, the electric flux density and the electric field;
[C] is the elastic compliance matrix whose components sat-
isfy the condition c
ijkl
= c
ijlk
= c
jikl
= c
kli j
;[d] is the matrix
of piezoelectric coefficients d
ijk
= d
ikj
;[d]
T
is the transpose
of [d]; and [e] represents the dielectric permittivity ma-
trix whose components e
ij
= e
ji
(i = j, k = l), i, j,k,l = 1,2,3.
Other forms of the linear piezoelectric constitutive equa-
tions are given in (4).
In the general case of fully populated matrices [C], [d],
and [e], the electromechanical properties of an anisotropic
piezoelectric continuum are defined by 21 independent
elastic constants, 18 piezoelectric coefficients, and 6 dielec-
tric constants. However, the actual number of parameters
required to characterize the properties of various piezo-
electric materials is less than the total of 45. The structure
and content of the matrices [C], [d], and [e] depend on the
type of material microstructure. The anisotropic properties
of piezoelectric crystals and, respectively, the composition
of the matrices [C], [d], and [e] are determined by the
type of symmetry in the crystal lattice. Because only those
crystals that possess no center of symmetry on the atomic
scale tend to exhibit piezoelectric effects, only 20 out of 32
crystallographic classes of crystals are piezoelectric. Spe-
cific characteristics of various groups of piezoelectric crys-
tals and ceramics, their classification, and properties have
been considered in (1,4,5). The materialproperties of piezo-
electric polymers are discussed in detail in the following
sections.
It is important to note that the theory of linear piezo-
electricity is based on the assumptions of infinitesimal de-
formations, linear stress–strain relations, and stationary
electric fields with respect to an inertial reference frame.
Attempts have been made to develop more general nonlin-
ear piezoelectric material models thattakeinto account the
effects of higher order electromechanical couplings, such as
electrostriction, nonlinear strain-displacement relations,
and the material response to large driving voltages. Re-
search efforts in this regard have been reviewed (4,6). A
systematic account of anelastic properties of piezoelectric
polymers has been given in (7).
SYNTHETIC PIEZOELECTRIC POLYMERS
The diverse group of piezoelectric materials includes
a variety of synthetic polymers such as polypropylene,
polystyrene, and poly(methyl methacrylate); semicrys-
talline polyamides such as nylon-11; and amorphous poly-
mers such as vinyl acetate. However, piezoelectric effects
in these materials are relatively weak, often unstable,
and are considered of limited practical significance. Strong
piezoelectricity has been observed only in the synthetic
polymer poly(vinylidene fluoride) (PVDF or PVF
2
) and
PVDF copolymers.
Poly(vinylidene fluoride) is a semicrystalline polymer
whose typical crystallinity is approximately 50%. The
amorphous phase of the polymer has the properties of a
supercooled liquid. The glass transition temperature of
the polymer is about −50
◦
C. The molecular structure of
poly(vinylidene fluoride) consists of the repeated monomer
unit –CF
2
–CH
2
–. The atoms are covalently bonded, form-
ing long molecular chains. Because the hydrogen atomsare
P1: FCH/FYX P2: FCH/FYX QC: FCH/UKS T1: FCH
PB091-P-DRV January 18, 2002 21:0
782 PIEZOELECTRICITY IN POLYMERS
positively charged and the fluoride atoms are negatively
charged with respect to the carbon atoms, PVDF is in-
herently polar. However, the net polar moment of the
material in its original state is zero due to the random
orientation of the individual crystallites.
Permanent dipole polarization of PVDF is obtained
through a technological process that involves stretch-
ing and polarizing extruded thin sheets of the polymer.
Stretching aligns molecular chains in the stretch direc-
tion. An applied electric field of up to 100 kV/mm at an
elevated, typically, 103
◦
C temperature causes permanent
polarization that is maintained after the material cools to
room temperature. Sessler (8)provides an overview ofpoly-
mer polarization methods. In general, it has been observed
that polarization in PVDF depends on a number of factors,
including polarizing temperature, polarizing time, polar-
izing process, electrode conditions, and the morphology of
the material.
Typically, PVDF is produced in thin films whose thick-
nesses range from 9 to 800 µm (10
−6
m). A thin layer of
nickel, silver, or copper is deposited on both film surfaces
to provide electrical conductivity when an electric field is
applied, or to allow measuring the charge induced by me-
chanical deformation.
ELECTROMECHANICAL PROPERTIES OF PVDF
Since the discovery of piezoelectric effects in PVDF (9), the
properties of this material have been studied by many in-
vestigators. Research accomplishments in this subject area
have been reviewed in (8,10,11).
Typically, the piezoelectric properties of PVDF are de-
termined within the framework of linear piezoelectric the-
ory. An expanded form of the constitutive law defined by
Eqs. (1) is formulated for piezoelectric polymers as
ε
11
ε
22
ε
33
ε
23
ε
31
ε
12
=
c
11
c
12
c
13
000
c
12
c
22
c
23
000
c
13
c
23
c
33
000
000c
44
00
0000c
55
0
00000c
66
σ
11
σ
22
σ
33
σ
23
σ
31
σ
12
+
00d
31
00d
32
00d
33
0 d
24
0
d
15
00
000
E
1
E
2
E
3
(2)
D
1
D
2
D
3
=
0000d
15
0
000d
24
00
d
31
d
32
d
33
000
σ
11
σ
22
σ
33
σ
23
σ
31
σ
12
+
e
11
00
0 e
22
0
00e
33
E
1
E
2
E
3
.
0.8
0.4
0
16
12
8
4
0 500 1000 1500 2000
Polarization time (s)
Piezoelectric coefficient d
31
(pC/N)
2500 3000 3500 4000
T
p
= 50°C
PF
2
V 50 µm
E
p
= 20 MV/m
T
p
= 90°C
PF
2
V 50 µm
E
p
= 100 MV/m
Figure 1. Dependence of the coefficient d
31
of PVDF on polariza-
tion time t
p
(12).
The latter equations are formulated in an orthogonal
coordinate system 1-2-3, so that axes 1 and 2 are consid-
ered in the plane of a PVDF film, whereas axis 3 is normal
to the film surface. Axes 1 and 2 are, respectively, paral-
lel and normal to the orientation of the polymer’s aligned
molecular chains.
According to Eqs. (2), coupling of the electromechani-
cal material properties of PVDF is characterized by five
piezoelectric coefficients contained in the matrix [d]. The
most important coefficients that determine the magni-
tude of piezoelectric effects are the coefficients d
3 j
,(j =
1,2,3). Sometimes, the hydrostatic coefficient, d
h
= d
31
+
d
32
+ d
33
that determines the electric charge generated by
hydrostatic pressure is used to represent the degree of
piezoelectric effects in a material.
The values of the piezoelectric coefficients of PVDF de-
pend on the polarization conditions in terms of the polari-
zation time t
p
, polarization temperature T
p
, and polariz-
ing field strength E
p
(12). In particular, the dependence of
the coefficient d
31
on t
p
, T
p
, and E
p
for a PVDF thin film
stretched at a 4:1 ratio, is illustrated in Figs. 1–3.
20
15
10
5
0
20 40 60 80
Polarization temperature (°C)
Piezoelectric coefficient d
31
(pC/N)
100 120
PVDP 50 µm
100
60
30
E
p
(MV/m)
Figure 2. Dependence of coefficient d
31
of PVDF on polarization
temperature T
p
(12).
P1: FCH/FYX P2: FCH/FYX QC: FCH/UKS T1: FCH
PB091-P-DRV January 18, 2002 21:0
PIEZOELECTRICITY IN POLYMERS 783
16
12
8
4
0204060
Polarizing field strength (MV/m)
Piezoelectric coefficient d
31
(pC/N)
80 100 120
PF
2
V 50 µm
110
90
70
50
25
T
p
(°C)
Figure 3. Dependence of coefficient d
31
of PVDF on polarizing
field strength E
p
(12).
A number of experimental techniques have been de-
veloped to determine the values of the piezoelectric co-
efficients of PVDF. In particular, the response of 20-µm
thick PVDF films has been studied under the conditions
of superimposed static and sinusoidal loads (13). The elec-
tric charge resulting from the mechanical loading has been
measured for various values of the static load and at vari-
ous temperatures; the amplitude (0.15 N) and frequency
(15 Hz) of the dynamic load remained unchanged. It has
been determined that the piezoelectric coefficient d
31
of
PVDF strongly depends on temperature, particularly, in
the range from −40 to −50
◦
C, close to the glass transition
temperature T
g
. A similar dependence of coefficient d
31
on
temperature has been observed in (14).
The electromechanical response of PVDF as a function
of temperature hasbeenstudied in (15) using thepiezoelec-
tric resonance method. By applying an alternating stress
in the material directions 1,2, and 3 and using polarization
measurements along axis 3, it has been determined that
d
31
, d
32
> 0, and d
33
< 0. In addition, it has been observed
that the piezoelectric coefficients of PVDF tend to increase
with temperature, as illustrated in Fig. 4.
32
24
16
8
3.6
2.8
2
1.2
−20 0 20
Temperature (C)
40 60
d
31
,d
33
(pC/N)
d
32
(pC/N)
−d
33
d
31
d
32
Figure 4. Piezoelectric coefficients d
31
, d
32
, and d
33
of PVDF as
functions of temperature (15).
22
20
16
14
12
10
4
2
−20
020
Temperature (C)
Coupling factor (%)
40 60
K
33
K
31
K
32
Figure 5. Electromechanical coupling factors k
31
, k
32
, and k
33
of
PVDF as functions of temperature (15).
The piezoelectric properties of PVDF have been also
characterized in terms of electromechanical coupling
factors k
31
, k
32
, and k
33
. These coefficients represent the
ratios between the dissipated and input energies in the re-
spective material directions. It has been determined (15)
that the electromechanical coupling factor k
31
of PVDF
tends to increase with temperature, whereas k
32
and k
33
remain temperature insensitive. These results are illus-
trated in Fig. 5.
The shear piezoelectric properties of uniaxially oriented
PVDF films have been studied in (16). It has been observed
that polarization of PVDF samples is linearly proportional
to applied shear stresses. It has been determined that the
values of the piezoelectric coefficients d
15
and d
24
range
from –13 pCN
−1
to –27 pCN
−1
and from −23 pCN
−1
to
–38 pCN
−1
, respectively.
The mechanical properties of PVDF have been defined
by the constitutive equations oflinear elasticity inthe form
of a generalized Hooke’s law. For orthotropic materials, the
coefficients of the compliance matrix [C] in Eqs. (2) can be
represented such that
c
11
= 1/Y
1
, c
22
= 1/Y
2
, c
33
= 1/Y
3
, c
44
= 1/2G
23
,
c
55
= 1/2G
31
, c
66
= 1/2G
12
c
12
=−ν
12
/Y
1
=−ν
21
/Y
2
, c
13
=−ν
13
/Y
1
=−ν
31
/Y
3
, and
c
23
=−ν
23
/Y
2
= ν
32
/Y
3
(3)
where Y
1
, Y
2
, and Y
3
are the elastic moduli in directions 1,
2, and 3, respectively; G
12
,G
31
, and G
23
denote the shear
moduli; and ν
12
,ν
23
, and ν
31
are Poisson ratios whose first
index indicates the direction of contraction or expansion
and the second indicates the direction of force action. Note
that due to the symmetry of the compliance matrix [C],
the mechanical properties of PVDF thin films are charac-
terized by nine independent elastic constants.
The elastic response of PVDF has been studied in
(14,15,17–21). It has been observed that the experimental
values of the elastic moduli Y
1
and Y
2
have been consis-
tently very close. This result has been often interpreted
P1: FCH/FYX P2: FCH/FYX QC: FCH/UKS T1: FCH
PB091-P-DRV January 18, 2002 21:0
784 PIEZOELECTRICITY IN POLYMERS
Figure 6. Stress–strain response of PVDF (direc-
tion 1) (20).
Sample 1
Sample 2
Sample 3
4×10
8
3×10
8
2×10
8
1×10
8
0
0 0.05 0.10
Strain (m/m)
Stress (Pa)
0.15 0.20
as evidence that the mechanical properties of PVDF are
isotropic. However, it has been demonstrated in (18–20)
that PVDF thin films exhibit significantly different re-
sponses, depending on the orientation of the aligned molec-
ular chains. In the latter studies, 28-µm PVDF samples
were tested under displacement controlled experimental
conditions at a strain rate of 1.27 cm/min. The respective
stress–strain diagrams for both in-plane material direc-
tions of PVDF are given in Figs. 6 and 7.
It is clear that the mechanical properties of PVDF
thin films strongly depend on the orientation of the poly-
mer’s molecular chains aligned in the stretch direction.
The diagram in Fig. 6 demonstrates that the stress–strain
response of the material in the direction of the aligned
molecular chains (direction 1) is characterized by a con-
tinuous increase of stresses that culminates in sudden fail-
ure. This type of response is typical for brittle materials. In
Figure 7. Stress–strain response of PVDF (direc-
tion 2) (20).
Sample 1
Sample 2
Sample 3
4×10
7
3×10
7
2×10
7
1×10
7
0
0
0.05 0.10 0.15 0.20
Strain (m/m)
Stress (Pa)
0.25 0.30 0.35
0.40
5×10
7
contrast, the stress–strain diagram in Fig. 7 for the mate-
rial direction normal to the alignment of molecular chains
(direction 2) is characteristic of ductile material behavior
that involves an increase in stresses up to a certain maxi-
mum value and a following sharp decrease of load-carrying
capacity.
Besides the observed differences in the stress–strain
behavior, the ultimate stresses (σ
u
)
i
and ultimate strains
(ε
u
)
i
(i = 1,2) in the respective in-plane material direc-
tions of PVDF have considerably different values: (σ
u
)
1
=
3.5 ×10
8
Pa, and (σ
u
)
2
= 5 ×10
7
Pa.
The Poisson ratio for uniaxially stretched PVDF films
has been measured experimentally in (21). Material sam-
ples were subjected to uniaxial tension in the direction of
the aligned molecular chains. The values of the Poisson
ratios ν
31
and ν
21
were obtained by measuring the respec-
tive deformations in the thickness and width directions of
P1: FCH/FYX P2: FCH/FYX QC: FCH/UKS T1: FCH
PB091-P-DRV January 18, 2002 21:0
PIEZOELECTRICITY IN POLYMERS 785
30
20
−20 0 20
Temperature (C)
Elastic comp. (10
−11
M
2
/N)
40
S
11
S
22
10
Figure 8. Elastic compliances of PVDF as functions of tempera-
ture (15).
the samples. It has been determined that ν
21
∼ 0.1 and
ν
31
∼ 0.8. It is important to note that the value of ν
31
ex-
ceeds 0.5, the theoretical maximum possible value of the
Poisson ratio for isotropic elastic materials. This result in-
dicates that PVDF thin films are highly anisotropic.
Experimental studies (14,15,22–24) indicate that the
elastic properties of PVDF are temperature-dependent.
In particular, according to the results reported in (15),
the elastic compliances of PVDF increase with tempera-
ture. The yield stress and yield strain of PVDF are also
temperature-dependent (22). These results are illustrated
in Figs. 8, 9, and 10.
Due to the fact that the electromechanical response
of PVDF depends on a number of factors, including
polarization conditions, stress/strain rates, temperature,
and hydrostatic pressure, the reported data for the values
of the piezoelectric and elastic constants of the polymer
appear to involve certain inconsistencies. Nevertheless, it
is possible to identify the typical values of the electrome-
chanical characteristics of PVDF such as summarized in
Table 1.
100
80
60
40
20
0
260 280 300 320 340 360
Environmental temperature K
True yield stress MPa
380 400 420 440
PVdF
273 K=0°C
Figure 9. Temperature dependence of the true yield stress of
PVDF (22).
0.5
0.4
0.3
0.2
0.1
0
260 280 300 320 340 360
Environmental temperature K
True yield strain
380 400 420 440
PVdF
273 K = 0°C
Figure 10. Temperature dependence of the true yield strain of
PVDF (22).
NONLINEAR AND TIME-DEPENDENT EFFECTS
The constitutive law of linear piezoelectricity in the form
of Eqs. (1) tends to neglect energy dissipation, time-
dependent effects, and various nonlinearities in the elec-
tromechanical response of piezoelectric materials. How-
ever, there is consistent experimental evidence that these
assumptions have certain limitations. It has been observed
that, in general, all piezoelectric materials exhibit non-
linear effects, as well as dielectric and mechanical energy
losses, although to different degrees. Thus, energylosses in
piezoelectric crystals and ceramics are negligible (26,27),
whereas in piezoelectric polymers such effects are of prac-
tical significance (28).
One study demonstrates strong nonlinear dependence
of the transverse piezoelectric response of PVDF on the ap-
plied stress (29). It has been observed that the piezoelectric
coefficient d
32
of 22-µm uniaxially oriented PVDF films be-
comes negative under large stresses. This effect appeared
reversible upon unloading but tended to repeat itself in
subsequent loading–unloading cycles.
Under cyclic conditions, piezoelectric polymers exhibit
energy losses observed from hysteresis loops formed by the
electric displacement D as a function of electric field E (10,
30–34). Furukawa et al. (30) subjected 20-µm thick PVDF
films to high sinusoidal electric fields whose amplitudes
ranged from 40 to 120 MV/m in the frequency range of
10
−4
–10
−2
Hz at temperatures between –100 and 100
◦
C.
These experiments demonstrated a strong dependence of
D on temperature and on the amplitude and frequency of
the electric field. At sufficiently high electric fields, D–E
hysteresis loops have been observed, even in the tempera-
ture range below the glass transition temperature of the
polymer. The D–E response of PVDF samples at different
temperatures is illustrated in Fig. 11.
D–E hysteresis loops similar to those shown in Fig. 11
have been obtained for PVDF copolymers, vinylidene
fluoride-trifluoroethylene (VDF-TrFE), and vinylidene
fluoride-tetrafluoroethylene (VDF-TFE) (35–37). Simi-
larly, the piezoelectric coefficients of PVDF and its copoly-
mers have demonstrated hysteresis under variable electric
fields (38–41).