Extractive Metallurgy of Copper 4th ed. W. Davenport et. al. (2002) Episode 11 potx
Bạn đang xem bản rút gọn của tài liệu. Xem và tải ngay bản đầy đủ của tài liệu tại đây (802.05 KB, 40 trang )
Melting
and
Casting
3
77
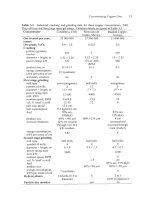
The Hazelett twin-band caster is shown in Fig.
15.3
in its role as an anode-
casting machine. Molten copper is fed from a pour pot into the space between
two sloped moving steel bands. The bands are held apart by moving alloyed
copper dam blocks on each side, creating a mold cavity ranging between 5-15
cm in width and 5-10 cm in thickness. Both separations are adjustable, allowing
variable product size. Solidification times are similar to those
of
the Southwire
and Properzi machines (Strand
et
al.,
1994).
The three types of moving-band casting devices have several features in
common. All require lubrication of the bands and mold wheel or dam blocks,
using silicone oil or acetylene soot (Adams and Sinha, 1990). Leftover soot is
removed from the bands after each revolution, then reapplied. This ensures an
even lubricant thickness and a constant heat transfer rate.
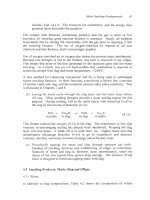
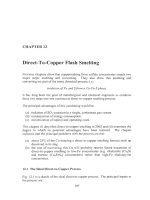
Fig.
22.4.
System
for
controlling molten copper
level
in
Southwire continuous casting
machine
(Adams
and
Sinha,
1990).
Reprinted courtesy
TMS.
378
Extractive Metallurgy
of
Copper
Table
22.5.
Operating details
of
Hazelett and Southwire continuous casting machines,
2001,
Casting plant
Nexans Phelps Dodge
Norddeutsche Palabora
Canada Refinerv Affinerie Minim
Casting machine
Bar size, em
x
cm
Casting rate
of
this bar,
tonneslhour
Molten copper level
control in caster
Casting temp.,
OC
Bar temperature
leaving caster, OC
Target
0
in
copper, ppm
measurement
technique
control system
Wheel and band details
wheel diameter, m
rotation speed, rpm
rim materials
rim life, tonnes of cast
copper
band material
band life
lubrication
Hazelett
twin band
7x13
48
electromagnetic
pool level
measurement
1
I25
-950
250
Electro-nite cell
in launder;
Tempolab in
holding furnace;
Leco on rod
manual
Twin band details
caster length, m 3.7
band material low carbon steel
life
24 hours
lubrication oil
dam block material Si bronze
dam block life
100
000
tonnes
cast copper
Hazelett
twin band
7
x
13.2
63
electromagn-
etic pool level
measurement
1
I30
1015
250
Leco on rod
compressed
air injection
into molten
cu
3.7
titanium steel
1300
tonnes
cu
Union Carbide
Lb-300x oil
Cu with 1.7-
2% Ni
&
0.5-
0.9% Si
-300 hours
Southwire
wheel
&
band
5.8
x
11.7
45
X-ray
11
10-1
125
900
160-250
Leco
protective gas,
larger
or
smaller quan-
tity
3.05
1.33
Cu-Cr-Zr
100
000
cold rolled
steel
72 hours
Lubro 30 FM
Southwire
wheel &band
2.15
x
15
21.5
infrared scan-
ner
1100-1
130
890-930
180-250
Leco on rod
holding fur-
nace CO and
launder burner
co
2.44
1.8
Cu-Cr-Zr
45
000
steel
low split C
1000-1800
t
Cu per band
Thermia
B
(Shell)
Melting
and
Casting
379
The casters all use similar input metal temperatures, 11 10-1 130°C, Table 22.5.
All require smooth, low-turbulence metal feed into the mold cavity, to reduce
defects in the solidified cast bar. Lastly, all require steady metal levels in the
pour pot and mold.
Control of mold metal level is done automatically, Fig. 22.4. Metal level in the
mold cavity is measured electromagnetically (Hazelett)
or
with a television
camera (Southwire). It is controlled with a stainless-steel metering pin in the
pour pot.
Metal level in the pour pot is determined using a conductivity probe or load cell.
It is controlled by changing the tilt
of
the holding furnace which feeds
it
(Nogami
et
ul.,
1993; Shook and Shelton, 1999).
The temperature of the solidified copper departing the machine is controlled to
940- 101 5°C by varying casting machine cooling-water flow rate.
Common practice for copper cast in the Hazelett, Properzi and Southwire ma-
chines is direct feeding of the solidified bar into a rolling machine to give con-
tinuous production of copper rod. Southwire Continuous Rod and Hazelett
Contirod are prominent (Buch
et al.,
1992; Hugens and DeBord, 1995; Zaheer,
1995). Both systems produce up to
60
tonnes of 8-14 mm rod per hour, Table
22.5.
22.3.3
Oxygen
free
copper casting
The low oxygen and hydrogen content of oxygen free copper minimizes porosity
when this metal is cast. As a result, the rolling step which is used to
turn
tough
pitch copper bar into rod is not necessary. This has led to the development of
processes for direct casting
of
OFC copper rod. These include both horizontal
and vertical casting machines (Joseph, 1999).
Horizontal rod-casting machines use a graphite crucible and a submerged casting
die. They generally operate as multi-strand machines. Their capacities are
limited to about
0.6
tonnes per hour.
They cannot produce very small diameter
rod.
Upward vertical casting machines use a vacuum to draw metal into water-
cooled graphite-lined dies partially submerged in the molten copper. As it
freezes, the rod is mechanically drawn upward and coiled (Eklin, 1999;
Rautomead, 2000). It is about the same size as rolled rod.
22.3.4
Strip casting
The development of strip casting for copper and copper alloys parallels
380
Extractive
Metallurgy
of
Copper
developments in the steel industry, in that continuous processes are favored. The
newer the technology, the less rolling is required. One approach taken by small-
volume producers is to roll strip from the bar produced by a Hazelett caster
(Roller
et
al.,
1999). This can be combined with continuous tube rolling/welding
to make optimum use
of
the casting machine for a mix of products.
However, direct strip casting which avoids rolling is the goal. Current horizontal
casters can produce 'thick strip' (15-20 mm), which requires some rolling (Roller
and Reichelt, 1994). Development efforts are being made
to
develop 'thin-strip'
(5-12 mm) casting to avoid rolling completely.
22.4
Summary
The last step in copper extraction is melting and casting of electrorefined and
electrowon cathodes. The main products of this melting and casting are:
(a) continuous rectangular bar for rolling to rod and drawing to wire
(b) round billets ('logs') for extrusion and drawing to tube
(c)
flat strip for rolling to sheet and forming into welded tube.
The copper in these products is almost always 'tough pitch' copper, Le. cathode
copper into which -250 ppm oxygen has been dissolved during meltinghasting.
This dissolved oxygen:
(a) ensures a low level of hydrogen in the copper and thereby avoids steam
porosity during casting and welding
(b) ties up impurities as innocuous grain boundary oxide precipitates in the
cast copper.
The remainder
of
unalloyed copper production is in the form of oxygen free high
conductivity copper with
5
to
10
ppm dissolved oxygen. This copper is
expensive to produce
so
it is only used
for
the most demanding high conductivity
applications. It accounts for less than 2% of copper production.
These pure copper products account for about 70% of copper use.
remainder is used in the form
of
copper alloy, mainly brass and bronze.
The
The principal melting tool for cathodes is the Asarco shaft furnace.
thermally efficient and provides good oxygen-in-copper control.
copper is mainly cast:
It is
Its molten
(a) as rectangular bar in continuous wheel-and-band and twin-band casters
(b) as round billets ('logs') in horizontal and vertical direct chill casters.
Melting and Casting
381
The bar casters are especially efficient because their hot bar can be fed directly
into continuous rod-rolling machines.
The quality of cathode copper is tested severely by its performance during
casting, rolling and drawing to fine wire.
Copper for this use must have high
electrical conductivity, good drawability
and
good annealability. These
properties are all favored by maximum cathode purity.
Suggested Reading
Adams,
R.
and Sinha,
U.
(1990) Improving the quality
of
continuous copper rod.
Journal
of
Metals,
42(5),
3
1
34.
Hugens,
J.R.
and DeBord, M. (1995) Asarco shall melting and casting technologies '95. In
Copper 95-Cobre 95 Proceedings of the Third International Conference,
Vol.
IV
Pyrometallurgy
of
Copper,
ed. Chen, W.J., Diaz,
C.,
Luraschi, A. and Mackey, P.J., The
Metallurgical Society
of
CIM, Montreal, Canada,
133
146.
Joseph, G. (1999)
Copper:
Its
Trade, Manufacture,
Use
and Environmental Status,
ed.
Kundig,
K.J.A.,
ASM International, Materials Park, OH, 141 154; 193 217.
Schwarze, M. (1994) Furnace systems for continuous copper rod production.
Wire Industry,
61
(731), 741 743; 748.
References
Adams,
R.
and Sinha,
U.
(1990) Improving the quality of continuous copper rod.
Journal
of
Metals,
42
(5),
3
1
34.
American Society
for
Testing and Materials (1997) Standard specification
for
tough pitch
fire-refined copper
-
refinery shapes (B216-97). In
Annual
Book
of
Standards, Section
2,
Nonferrous Metal Products,
ASTM, Philadelphia, PA.
American Society for Testing and Materials (1998) Standard specification for copper rod
drawing stock for electrical purposes (B49-98). In
Annual
Book
of Standards, Section 2,
Nonferrous Metal Products,
ASTM, Philadelphia, PA.
American Society
for
Testing and Materials (2000) Standard specification
for
electrolytic
cathode copper (B115-00). In
Annual
Book
of
Standards, Section
2,
Nonferrous Metal
Products,
ASTM, Philadelphia, PA.
Back,
E.,
Paschen, P., Wallner,
J.
and Wobking,
H.
(1993) Decrease of hydrogen and
oxygen contents in phosphorus-free high conductivity copper prior to continuous casting.
BIIMs
138,22
26.
Bebber,
H.
and Phillips,
G.
(1998) Induction furnace technology for horizontal casting.
Metallurgia.
65,349 35
1.
382
Extractive Metallurgy
of
Copper
Buch, E., Siebel,
K.
and Berendes,
H.
(1992) Operational experience of newly developed
mini copper rod casting and rolling plants, CONTIROD system.
Wire,
42,
110
114.
Chia, E.H. and Patel, G.R. (1992) Copper rod and cathode quality as affected by hydrogen
and organic additives.
Wire
J.
Int.,
25
(1
I),
67 75.
Copper Development Association (2001) CDA’s annual data
’00.
www.copper.org
Dion,
J.L.,
Sastri,
V.S.
and Sahoo, M. (1995) Critical studies on determination of oxygen in
copper anodes.
Trans. Am. Foundtyman’s SOC.,
103,47 53.
Edelstein, D.E. (2000) Copper.
In
1999
Minerals Yearbook,
United States Geological
Survey,
Eklin,
L.
(1999) UF’CAST-near net shape casting of copper wire rod. In
1999
Con$
Proc. Wire Assoc. Inter.,
Wire Association International, Guilford, CT, 274 277.
Feyaerts, K., Huybrechts,
P.,
Schamp,
J.,
van Humbeeck,
J.
and Verlinden,
B.
(1996) The
effects of impurities on the recrystallization behavior of tough pitch hot rolled copper rod.
Wire
J.
Int.,
29
(1
I),
68 76.
Hugens,
J.R.
(1994) An apparatus
for
monitoring dissolved hydrogen in liquid copper. In
EPD Congress
1994,
ed. Warren, G.W., TMS, Warrendale, PA, 657 667.
Hugens, J.R. and DeBord,
M.
(1995) Asarco shaft melting and casting technologies
’95.
In
Copper 95-Cobre
95
Proceedings
of
the Third International Conference,
Vol.
IV
Pyrometallurgy
of
Copper,
ed. Chen, W.J., Diaz, C., Luraschi, A. and Mackey, P.J., The
Metallurgical Society of CIM, Montreal, Canada, 133 146.
Joseph, G. (1999)
Copper: Its Trade, Manufacture, Use and Environmental Status,
ed.
Kundig, K.J.A., ASM International, Materials Park,
OH,
141 154; 193 217.
Koshiba,
Y.,
Masui,
T.
and Iida,
N.
(2000) Mitsubishi Materials’ high performance oxygen
free copper and high performance alloys. In
Second
Int.
Con$ Processing Mater. Prop.,
ed.
Mishra, B. and Yamauchi,
C.,
TMS, Warrendale, PA,
101
104.
McCullough, T., Parglu, R. and Ebeling, C. (1996) Oxy-fuel copper melting for increased
productivity and process cnhancement. In
Gas Interactions in Nonferrous Metals
Processing,
ed. Saha, D., TMS, Warrendale, PA, 22
1
227.
Nogami, K., Hori, K. and Oshima, E. (1993) Continuous casting of Onahama oxygen-free
copper and alloys. In
First
Int.
Con$ Processing Mater. Prop.,
ed. Henein,
H.
and Oki, T.,
TMS, Warrendale, PA, 389 392.
Nussbaum, A.I. (1973) Fully and semi-continuous casting of copper and copper-base alloy
billets and slabs.
In
Continuous
Casting.
ed. Olen,
K.R.,
TMS, Warrendale, Pennsylvania,
73 91.
Owen, M. (1990) High-quality copper billet.
Tube
International,
9
(38), 273 277.
Melting and Casting
383
Rantanen, M. (1995) Cast and roll-new copper tube manufacturing technology from
Outokumpu. In
Copper 95-Cobre 95 Proceedings of the Third International Conference,
Vol.
I
Plenary Lectures, Economics, Applications and Fabrication of Copper,
ed.
Diaz,
C.,
Bokovay,
G.,
Lagos,
G.,
Larrivide,
H.
and Sahoo, M., The Metallurgical Society of CIM,
Montreal, Canada, 449 453.
Rautomead, Ltd.
(2000)
Copper rod and wire
~
an integrated approach towards optimum
quality.
Metallurgia,
61
(9), 24
25.
Rollel,
E.,
Kalkenings,
P.
and
Hausler,
K.11.
(1999)
Continuous
narrow strip production line
for welded copper tubes.
Tube International,
18,28 3
1.
Roller,
E.
and Reichelt, W. (1994) Strip casting of copper and copper alloys. In
Proc.
METEC Congress 94,
Vol.
1,
Verein Deutscher Eisenhiittenleute, Diisseldorf, Germany, 480
486.
Schwarze,
M.
(1994) Furnace systems for continuous copper rod production.
Wire Industry,
61
(73
I),
741 743; 748.
Shook, A.A. and Shelton, C.A. (1999) Improved rod plant level control with WAC. In
Copper 99-Cobre 99 Proceedings
of
the Fourth International Conference,
Vol.
I
Plenary
Lectures, Movement of Copper and Industry Outlook, Copper Applications and Fabrication,
ed. Eltringham, G.A., Piret,
N.L.
and Sahoo, M., TMS, Warrendale, PA, 293 302.
Strand,
C.I.,
Breitling, D. and DeBord, M. (1994) Quality control system
for
the
manufacture of copper
rod.
In
1994
Conf Proc. Wire Assoc. Inter.,
Wire Association
International, Guilford,
CT,
147
15
I.
Taylor,
J.
(1
992) Continuous casting of hollow copper billets.
TPQ,
3
(3), 42 47.
Vaidyanath, L.
R.
(1992) Producing copper
and
copper
alloy
tubes.
Tube Internatiorzal.
11
(48),
165
166.
Zaheer, T. (1995) Reduction of impurities in copper.
Wire Industry,
62
(742), 55
1
553
CHAPTER
23
Costs
of
Copper Production
This chapter:
(a) describes the investment and production costs of producing copper metal
from ore
(b) discusses
how
these costs are affected
by
such factors as ore grade,
process choice and inflation
(c) indicates where cost savings might be made in the future.
The discussion centers
on
mine, concentrator, smelter and refinery costs. Costs
of producing copper by IeacWsolvent
extractiodelectrowinning
and
from
scrap
are also discussed.
The cost data have been obtained from published information and personal
contacts in the copper industry. They have been obtained during
2001
and
2002
and are expressed in
2002
US.
dollars. The data are directly applicable to plants
in the
USA.
They are thought to be similar to costs in other parts of the world.
Investment and operating costs are significantly affected by inflation.
Fortunately,
U.S.
dollar inflation was low during the
1990’s
and early
2000’s, so
the cost
of
producing copper rose slowly.
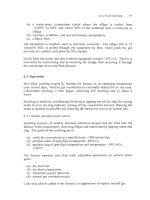
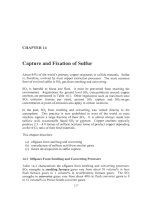
This is confirmed by the
1982-2001
inflationary index for mining and milling
equipment, Fig.
23.1.
The basic equation for using this index
is:
(23.1)
Cost
(year
A)
-
Index
(year
A)
Cost
(yearB)
Index
(yearB)
-
(for identical equipment). Fig.
23.1
and Eqn.
23.1
show
that
1990’s
mining and
milling equipment costs rose less than
2%
per year.
385
386
Extractive Metallurgy
of
Copper
1100
1000
900
800
700
r
I
1982 1986 1990 1994 1998 2002
Year
Fig.
23.1.
Engineering,
2001).
Mining and milling equipment
cost
index from 1982
to
2001
(Chemical
Accuracy
of
the
cost
data
The investment and operating costs in this chapter are at the ‘study estimate’
level, which is equivalent to an accuracy of *30% (Bauman, 1964). Data with
this accuracy can be used to examine the economic feasibility
of
a project before
spending significant funds for piloting, market studies,
land surveys and
acquisition (Perry and Chilton, 1973).
23.1
Overall Investment Costs: Mine through Refinery
Table 23.1
lists ‘study estimate’ investment costs for a mine/concentrator/
smelterhefinery complex designcd to produce electrorefined cathodes from
0.75%
Cu ore. These costs are
for
a ‘green field’ (new) operation starting on a
virgin site with construction beginning January 1,2002.
The investment costs are expressed in terms
of
investment cost per annual tonne
of product copper. This is defined by the equation:
(23.2).
investment cost per annual
plant capacity,
tonnes of copper per year
plant cost
=
tonne of copper
This equation shows, for example, that the investment in an electrorefinery
Costs
of
Copper Production
387
which:
(a) costs
$500
per annual tonne of copper
(b) produces 200
000
tonnes of copper per year
will be:
$500
per annual
tonne of copper
200
000
tonnes
of copper per year
investment cost
=
or:
$100
x
lo6
Table 23.1 indicates that the fixed capital investment for a complex which
produces electrorefined copper from
0.75% Cu
ore is in the range of
$8500
per
annual tonne
of
copper.
To
this must be added working capital
to
cover the
initial operating expenses of the complex (about 10%
of
fixed capital
investment, Peters and Timmerhaus,
1968).
It means that a new mine/mill/
smelterhefinery complex which is to produce 200
000
tonnes of copper per year
will cost 41900
x
lo6.
23.1.1
Variation
in
investment
costs
Mine investment costs vary considerably between mining operations. This is
due to differences in ore grades, mine sizes, mining method, topography and
ground condition.
Underground mine development costs considerably more than open pit mine
development, per annual tonne of mined
ore.
This, and the high cost
of
operating underground explain why underground orebodies must contain higher
%
Cu
ore than open pit orebodies.
Table
23.1.
Copper extraction
investment
costs. Fixed investment costs for a copper
extraction complex, starting with
0.75%
Cu
ore. The costs are at the ‘study estimate’
level
of
accuracy. Cost effects of underground mining and ore grade are discussed
in
Section 23.1.1.
Facility
Fixed
investment cost
CWS.
Der
annual tonne
of
Cul
~ ~
Mine (open pit)
Concentrator
Smelter (Outokumpu flash furnace smelting/
converting), including sulfuric acid plant
Electrolytic refinery (excluding precious
metals refinery)
3000
2500
2500
500
Total
8500
388
Extractive Metallurgy
of
Copper
Ore grade has a direct effect on mine investment costs,
$
per annual tonne of
product copper. Consider (for example) two identical orebodies, one containing
0.5%
Cu
ore and the other 1% Cu ore.
Achievement of an identical annual
production of
Cu
requires that the
0.5%
Cu ore be mined at twice the rate of the
1
%
Cu
ore. This, in turn, requires:
(a) about twice as much plant and equipment (e.g. trucks)
(b) about twice as much investment.
The same is true for the concentrator
-
it will have to treat
0.5%
Cu ore twice as
fast as 1% Cu ore
-
to achieve the same annual production of Cu. This will
require about twice the amount of concentrator equipment and about twice the
investment.
Smelter investment costs, per annual tonne of copper production, are influenced
by
concentrate
grade rather than by ore grade. The higher the
%
Cu
in the
concentrate, the smaller the smelter (and smelter investment) for a given annual
production of copper. High Cu grade concentrates also minimize smelter
operating
costs (e.g. materials handling costs, fuel consumption costs, gas
handling costs) per tonne of copper.
Refinery investment costs are not much affected by
mine/concentrator/smelter
characteristics. This is because copper refineries treat 99.5%
Cu
anodes,
irrespective
of
the preceding processes.
23.1.2
Economic
sizes
ofplants
Mines can be economic at any size, depending upon the
Cu
grade
of
their ore.
Thus, copper mines are operating at production rates between 10
000
tonnes of
ore per day (a high Cu grade operation) to 100
000
tonnes per day (a large open-
pit low Cu grade operation,
EMJ,
1998).
Concentrators vary similarly. A new large concentrator unit typically consists
of
a semi-autogenous grinding mill, two ball mills and a flotation circuit. It
is
capable
of
treating
30
000
to
50
000
tonnes of ore per day (Dufresne,
2000;
EMJ,
1998). Larger concentrators consist of multiples of this basic
concentrating unit.
Smelters are almost always large because their minimum economic output is that
of
a single, fully used high intensity smelting furnace (e.g. flash furnace). These
furnaces typically smelt 1000 to
3000
tonnes of concentrate per day.
Copper refineries are usually sized to match the anode output of an adjacent
smelter. The advantage of one-smeltedone-refinery combination at the same site
is shared site facilities, particularly for anode casting and anode scrap re-melting.
Costs
ofCopper Production
389
A
few refineries treat the anodes from several smelters.
23.2
Overall Direct Operating
Costs:
Mine Through Refinery
Direct operating (‘cash’) costs (excluding depreciation, capital repayment and
income taxes) for
mining/concentrating/smelting/electrorefining
are given in
Table
23.2.
The table shows that the direct operating costs for the major steps
are, in descending order, concentration and smelting (about equal); open pit
mining; electrorefining; and sales and distribution. Overall direct operating costs
for extraction are
-$I
per kg of copper.
23.2.
I
Variations in direct operating
costs
The operating costs which vary most are those for mining and concentrating.
The amounts of ore which must be handled by these operations, per tonne of
Cu,
vary directly with
%
Cu
in ore
-
and this significantly affects opcrating costs.
Also, underground mining costs can be twice those
of
open pit mining
-
they
must be offset by high
%
Cu
underground ore.
Table
23.2.
Copper extraction
operating
costs. Direct operating costs for producing
electrorefined copper cathodes from
a
0.75%
Cu
ore
(assuming
90%
Cu
recovery).
Maintenance is included. The costs are
at
the ‘study estimate’ level.
Factors affecting
these costs are discussed in Section 23.2.1.
Activity Direct operating cost
(%U.S.
per
kg
of
Cu)
Open pit mining,
0.75%
Cu
ore
@
$1.6/tonne of
ore
0.25
Beneficiation from 0.75%
Cu
ore to 30%
Cu
concentrate at shipping point, including tailings
disposal
@
$2.5/tonne of
ore
Smelting
@
$80/tonnt:
of
30%
cu
concentrate
including sulfuric acid production
Electrolytic refining, excluding precious metals
recovery
0.35
0.3
0.1
Sales and distribution
0.05
Local
management and overhead
0.05
Total direct ooerating cost
1.10
23.3
Total Production
Costs,
Selling Prices, Profitability
The total cost of producing copper from ore is made up
of
390
Extractive Metallurgy
of
Copper
(a) direct operating costs (Section 23.2)
(b) finance (indirect) costs, i.e. interest and capital recovery.
A reasonable estimate for (b) is 12% of the total capital investment per year.
Based on a fixed capital investment of
$8500
(+
10%
working capital) per
annual tonne
of
copper, this is equivalent to:
or
$1 100 per tonne of copper*
$1.1
per
kg
of
copper.
Thus the direct ($1.1) plus indirect ($1.1) operating costs
of
producing
electrorefined copper in a new operation are
of
the order of $2.2 per kg.
For
a
new operation to be profitable, the selling price of copper must exceed these
costs.
Mines and plants which have been in operation
for
many years may have repaid
much
of
their original capital investment. In this case, direct operating costs
(plus refurbishing) are the main cost component. This type of operation will be
profitable at selling prices of -$1.5 per kg of copper.
In summary, the price-profit situation is:
(a) At copper selling prices above $2.2 per kg, copper extraction is profitable
and expansion
of
the industry is encouraged. Underground orebodics
containing about 1.5
%
Cu
are viable as are open-pit orebodies containing
about
0.75%
Cu.
At selling prices below about -$1.5 per kg, some mines and plants are
unprofitable. Some operations begin to shut down.
(b)
These costs and prices all refer to January 1, 2002. They will increase at about
the same rate as the cost index in Fig. 23.1.
The 2001 selling price of copper was about $1.60 per kg
so
that direct operating
costs were met in most cases. However, the most costly copper operations were
unprofitable at this price and several closed, especially in North America.
*Finance charges
-
finance charges, $/year
Per tonne
of
copper
-
copper production, tonneslyear
-
12%
per year/IOO%x total capital investment,
$
copper production, tonnedyear
-
=
0.12
x
(capital investment per annual tonne
of
copper)
Costs
of
Copper Production
39
1
23.3.1
Byproduct credits
Many Cu orebodies contain Ag and Au (EMJ,
1998).
These metals follow Cu
during concentration, smelting and refining. They are recovered during
electrorefining (with some additional treatment) and sold. Other orebodies
contain MoSz which is recovered in the concentrator and sold. The credits (sales
minus extra costs for recovery) for these byproducts should be included in
project evaluations.
23.4
Concentrating Costs
The investment costs of constructing a
Cu
concentrator are
of
the order
of
$20
per annual tonne of ore (Dufresne, 2000). This means that a
10
x
lo6
tonnes of
ore per year concentrator will cost
-$200
x
lo6.
Table 23.3 breaks concentrator investment costs into major cost components,
expressed as a percentage of total investment cost. The largest cost item is the
grinding mill/classifier circuit. The grinding
mills
are expensive. They also
require extensive foundations and controls.
Table
23.3.
Concentrator
investment
costs. Investment costs for a copper concentrator
by section, expressed as a percentage of the total investment cost. Control equipment
costs are included in each section.
Section Percent
of
total
investment cost
10
Ore handling, storage, conveying equipment
Semi-autogenous grinding mill, ball mills and size
classifiers
50
Flotation cells and associated equipment
10
Dewatering equipment, tailings dam, concentrate
30
loading facilities
Total
100
Concentrator direct
operating
costs (Table 23.4) are
of
the order
of
$2.5/tonne of
ore, which
is
equivalent to about $0.4kg of Cu (assuming 0.75% Cu ore and
90%
Cu
recovery). Grinding is by far the largest operating cost, followed by
flotation. Electricity and operating supplies are the largest cost components,
Table 23.5.
Grinding and flotation costs vary markedly for different ores. Grinding costs are
392
Extractive Metallurgy
of
Copper
Table
23.4.
Concentrator
operating costs
by
activity.
Direct operating costs
of
producing
30%
Cu concentrate from 0.75% Cu
ore.
Ore
cost is not included.
Activity Cost per tonne
of
ore
6U.S.)
Crushing, conveying, storage
0.4
Semi-autogenous grinding, ball mill grinding, size
classification
1.3
Flotation
0.4
0.2
concentrate
0.15
0.05
Dewatering, filtering, drying, storage and loading
of
Tailings disposal, effluent control, water recycle
human resources, laboratory, management, property
Local overhead (accounting, clerical, environmental,
taxes, safety)
Total
2.5
Table
23.5.
Concentrator
operating costs
by
cost component.
Expenditures on energy,
manpower, supplies and overhead are shown.
Ore
cost
is
not included.
Component Percent
of
concentrating cost
Electrical energy
crushing and grinding 25
flotation and tailings disposal
3
other (including hydrocarbon fuel) 2
30
Operating labor
5
Maintenance labor 5
Maintenance and operating supplies, including freight
30
and handling
Reagents and grinding balls
reagents and lime
grinding media
10
15
25
Local overhead (accounting, clerical, environmental,
5
taxes, safety)
Total
100
human resources, laboratory, management, propcrty
high for hard primary ores and low
for
secondary (altered)
ores.
Flotation costs
are
low
for simple
Cu
sulfide ores. They increase with increasing ore
complexity.
Costs
of
Copper Production
393
23.5
Smelting
Costs
The investment cost
of
a new Outokumpu flash furnaceiflash converter smelter
is
42500
per annual tonne
of
copper. A smelter designed to produce
200
000
tonnes
of
new anode copper per year will cost, therefore, about
$500
x
IO6.
Table
23.6
breaks this investment cost into its major components. About
75%
of
the investment goes into concentrate
handling/smelting/converting/anode
casting
and about
25%
into gas handling/sulfuric acid manufacture.
Table
23.6.
Smelter
investment
costs.
Investment costs of
a
flash
furnace/flash converter
smelter
by
section, expressed
as
a
percentage
of
total
fixed
investment
cost.
The
costs
include installation and housing
of
the units.
Item Percent
of
smelter cost
Concentrate handling and drying, including delivery of
dry
concentrate to smelting furnace
Oxygen plant
10
Flash furnace
20
10
Flash converter, including matte granulation and
crushing
15
Cu-from-slag recovery equipment (electric furnace
or
Anode furnaces and anode casting equipment
10
10
25
flotation) including barren slag disposal
Gas handling system including waste heat boilers,
electrostatic precipitators and sulfuric acid plant
Total
100
23.5.
I
Investment costs
for
alternative smelting methods
In
2002,
there are six major intensive smelting processes available for installing
in new smelters or for modernizing old smelters. They are:
Ausmelt Isasmelt
Mitsubishi Noranda
Outokurnpu flash Teniente.
Each has been installed during the late
1990's
and early
2000's.
Each appears to
be competitive for new and replacement smelting units.
23.5.2 Smelter operating
costs
Table
23.7
shows the direct costs
of
operating an autothermal, oxygen-enriched
394
Extractive Metallurgy
of
Copper
Table
23.7.
Smelter
operating
costs
by
activily.
Direct operating costs for producing
anodes from
30%
Cu concentrate in a flash smelting/flash converting smelter, including
maintenance. Concentrate cost
is
not included.
Activity Cost,
%U.S.
per tonne
of
concentrate
Concentrate reception, storage and delivery to dryer
Flash furnace smelting including concentrate drying, gas
handling and delivery of
70%
Cu
crushed matte granules to
flash converting
Flash converting including delivery of molten copper to
anode furnaces
Cu recovery from smelting
slag
Anode-making including desulfurization and deoxidation
of
molten copper, anode casting and loading for transport to
electrorefinery
Sulfuric acid plant including acid storage and loading of rail
cars and trucks. Costs
of
treating ‘acid plant blowdown’
and credit for sulfuric acid are included
Local overhead (accounting, clerical, environmental, human
resources, laboratory, management, property taxes, safety)
Total
5
20
20
15
5
10
5
80
Table
23.8.
Smelter
operating
costs
by
cost component.
Expenditures on manpower,
utilities and supplies in a flash smelting/flash converting smelter, by percentage.
Concentrate cost is not included.
Component
Percent
of
smelting cost
Oxygen
Operating manpower, including supervision
Maintenance manpower, including supervision
Electricity (excluding electricity used
for
making oxygen)
Hydrocarbon
fuel
Flux and refractories
Other maintenance supplies
Local overhead (accounting, clerical, environmental, human
resources, laboratory, management, property taxes, safety)
Total
10
20
10
10
5
5
35
5
100
Costs
of
Copper Production
395
Outokumpu flash smelting/flash converting smelter. The total is about
$80
per
tonne of concentrate. For a
30%
Cu concentrate this is equivalent to about $0.3
per kg
of
new copper anodes.
Table 23.8 breaks down these direct operating costs into labor, fuel, oxygen and
supplies. Labor and maintenance supplies are shown to be the largest items.
The
1980
edition
of
this book suggested that smelter investment and operating
costs
could be minimized by maximizing the use
of
industrial oxygen in
smelting.
Oxygen enrichment of smelting furnace blasts continued to increase during the
1990’s
to
the
point
where
most
smelting
furnaces
now operate with little
hydrocarbon fuel. This has minimized fuel costs. It has also minimized offgas
quantities (per tonne of copper produced) and gas handling/acid making
investment and operating costs.
23.6
Electrorefining Costs
The investment cost of a new electrorefinery using stainless steel cathode
technology is
-$SO0
per annual tonne of electrorefined cathodes. This means
that a refinery producing 200
000
tonnes per year of cathodes will cost of the
order
of
$100
x
1
06.
Table
23.9.
Electrorefinery
investment
costs. Investment costs
of
components in an
electrolytic copper refinery expressed as a percentage of the total fixed investment cost.
Component Percent
of
total
fixed
investment cost
10
55
Anode reception, weighing, straightening, lug milling, sampling
Production electrorefining equipment including stainless steel
equipment
blanks, polymer concrete cells, transformers, rectifiers, electrical
distribution system
Electrolyte circulation and purification equipment including filters,
heaters, pumps, storage tanks, reagent addition equipment,
electrowinning cells
15
Cathode handling equipment including stripping, washing,
weighing, sampling and bundling equipment
5
Anode (and purchased) scrap melting and anode casting equipment
1s
-
including Asarco
shaft
furnace, holding furnace, pouring
equipment and Hazelett anode caster
Total
100
396
Extractive Metallurgy
of
Copper
Table
23.10.
Electrorefinery
operaling
costs by activity. Direct operating costs
including maintenance,
for
producing electrorefined cathode ‘plates’ from anodes in a
stainless steel blank electrorefinery. Anode cost is not included.
Activity Cost,
W.S.
per
kg
of
cathode Cu
0.010
0.050
Anode reception, weighing, straightening, lug milling, delivery
to tankhouse*
Production electrorefining, including cell cleaning, electrolyte
purification and reagent addition, delivery of cathodes to washing
and delivery of ‘slimes’ to Cdprecious metal recovery plant
0.010
control and delivery to loading docks
0.010
anode casting and anode delivery to tankhouse
Cu recovery from slimes
0.005
Local overhead (accounting, clerical, environmental, human
0.005
resources, laboratory, management, property taxes, safety)
Total
0.090
Cathode handling including stripping, washing, weighing, quality
Anode scrap washing and melting, purchased scrap melting,
*
In
some
cases
this
is
a
smelter activity
Table
23.1
1.
Expenditures on
manpower, electricity and supplies (excluding anodes and scrap), by percentagc. Anode
cost is not included.
Electrorefinery
operaring
costs by cost component.
Component Percentage
of
Operating manpower, including supervision
30
Electricity
30
Maintenance materials
20
Reagents and fossil fuel
5
Local overhead (accounting, clerical, environmental, human
5
resources, laboratory, management, property taxes, safety)
Total
100
electrorefining cost
Maintenance manpower, including supervision
10
The
relative investment
costs
of
various sections
of
a
refinery are shown in Table
23.9.
The
production electrorefining section (including stainless steel blanks) is
by
far
the largest investment cost component
of
the refinery.
The direct costs
of
producing electrorefined cathodes in
an
electrolytic refinery
are
-$O.
1
per kg
of
cathode copper, Table
23.10.
The main components
of
that
cost
are
manpower, electricity and maintenance, Table 23.11.
Costs
of
Copper Production
397
23.7
Production of Copper from Scrap
Chapter 20 showed that copper scrap varies in grade from
99.5+%
Cu
(manufacturing wastes) to
5%
Cu (recycled mixed-metal scrap). The high-grade
manufacturing wastes require only reclamation, melting, casting and marketing
which costs of the order
of
$O.lOkg
of
copper. Low-grade scrap, on the other
hand, requires reclamation, sorting, smelting, refining and marketing, which
costs about
$0.5
per kg of copper, Table 23.2. Intermediate grade scrap
treatment lies between these
two
extremes.
For
scrap recovery to be profitable, the difference between refined copper sales
price and scrap purchase price must exceed these treatment charges.
If
it doesn’t,
scrap is held off the market.
23.8 Leach/Solvent
ExtractionlElectrowinning
Costs
The investment and operating costs
of
heap leachholvent extractiodelectro-
winning plants are listed in Tables 23.12 and 23.13. The costs are shown to be
considerably lower than those
for
conventional
concentration/smelting/refining
complexes. This accounts
for
the rapid adoption
of
leaching in the 1990’s,
especially in Chile.
Table
23.12.
Heap leachlsolvent
extractiodelectrowinning
investment
costs. Fixed
investment costs for
a
heap leachlsolvent
extractiodelectrowinning
plant.
The
plant
produces copper cathode plates ready
for
shipment from 0.75% Cu ‘oxide’ ore. Stainless
steel cathodes and polymer concrete cells are used. Mine investment cost
is
not included.
Component
%US.
per annual
tonne of copper
Heap leach system including leach pad, crusher, agglomerating
1600
drum, on-off heap building
and
removal equipment, piping,
pumps, solution collection ponds etc.
Solvent extraction plant including mixer-settlers, pumps,
piping, storage tanks and initial extractant and diluent
400
Electrowinning plant including
electrical
equipment, polymer
concrete cells, rolled Pb-Sn-Ca anodes, stainless steel cathodes,
cranes, cathode stripping, washing and handling equipment
Utilities and infrastructure
500
Engineering services, contingency, escalation etc.
300
Total (Dufresne,
2000) 3500
700
398
Extractive Metallurgy
of
Copper
Table
23.13.
Direct
operating
costs
of
a heap IeacWsolvent
extractiodelectrowinning
system. The plant produces copper cathode plates ready
for
shipment from
0.75%
Cu
‘oxide’ ore. Stainless steel cathodes and polymer concrete cells are used. Ore cost is not
included.
Item
$/ke of
copper
Heap leach operation including crushing, acid curing,
0.10
agglomeration, on-off heap constructionhemoval, solution
delivery and collection
Sulfuric acid
0.05
Solvent extraction plant operation, including maintenance
0.03
Reagent make-up: extractant, diluent, guar and
CoS04.7H20
0.04
0.15
to loadout platform
Local overhead (accounting, clerical, environmental, human
0.03
resources, laboratory, management, property taxes, safety)
Total
0.40
Electrowinning tankhouse operation, delivering cathode plates
Unfortunately, chalcopyrite ore (the world’s largest source of copper) cannot be
processed by heap IeacWsolvent
extraction/electrowinning,
Chapter 17. Chalco-
pyrite ores must be treated by conventional concentratiodsmelting/
refininghefining, irrespective
of
cost.
The small investment requirement
of
IeacWsolvent
extractiodelectrowinning
plants is due
to
the small equipment and infrastructure requirements of these
processes. Specifically, leaching
and
solvent extraction require much less
equipment than concentrating, smelting, converting and anode making.
An interesting aspect of pyrometallurgical and hydrometallurgical copper
extraction is sulfuric acid production and use. Hydrometallurgical copper
extraction requires sulfuric acid (Chapter 17)
-
pyrometallurgical copper
processing produces
it
(Chapter 14).
Companies with both processes benefit significantly from this synergistic effect,
especially if the operations are close together.
23.9
Profitability
The key to a profitable mine-to-market copper operation is, of course, a large,
high Cu-grade orebody. Such an orebody maximizes copper production per
tonne
of
ore
mined,
moved and
processed.
Optimal use of an orebody requires that each part of the orebody be processed by
Costs
of
Copper Production 399
its most efficient method, e.g. leaching or concentratingismelting. Separation of
the orebody into milling ore, leaching ore, leaching ‘waste’ and unleachable
waste
is
crucial for profitable utilization of the resource.
Mechanization, automation and computer control optimize resource utilization
and profitability throughout the mine-to-market sequence. In-pit crushing and
conveyor ore transport, computer controlled semi-autogenous milliball mill
grinding and flotation; oxygen-enriched continuous smeltingiconverting; and
mechanized stainless steel cathode/polymer concrete cell electrorefining and
electrowinning have all contributed to lower costs, enhanced resource utilization
and improved profitability.
23.10
Summary
The total direct plus indirect cost of producing electrorefined copper from ore by
conventional
mininglconcentratiordsrneltingirefining
is in the range of
$1.5
to
$2.2
per kg of copper.
The total direct plus indirect cost of producing electrowon copper cathodes from
‘oxide’ and chalcocite ores (including mining) is in the range
of
$0.7
to
$1.5
per
kg of copper.
Copper extraction is distinctly profitable when the selling price
of
copper
is
42.5
per kg. It is unprofitable for some operations when the selling price falls
below $1.5 per kg. At the former price, the industry tends to expand. At the
latter, it begins to contract.
References
Bauman, H.C. (1964) Fundamentals
of
Cost Engineering in the Chemical Industiy.
Reinhold Book Corporation, New York, NY, Chapter 1.
Chemical Engineering (2001) (McGraw-Hill Publishing Company, New York, NY),
data
ohtaincd from
July
issues, 1983-2001.
Dufresne,
M.
W.
(2000) The Collahuasi copper project, Chile.
CIMBuNetin,
93,25 30.
EMJ
(1998) Bajo de
la
Alumbrera, Argentina’s first mining mega-project.
E&M.I,
199(5),
pp. 46WW-54WW.
Perry,
R.H. and Chilton, C.H. (1973) Chemical Engineer’s Handbook, Fifth Edition,
McGraw-Hill Book Company, New York,
NY,
25-12
to
25-47.
Peters,
M.S.
and Timmerhaus,
K.D.
(1968) Plant Design and Economics
for
Chemical
Engineers, Second Edition, McGraw-Hill Book Company, New
York,
NY.
Appendix
A
Stoichiometric Data for Copper Extraction
Compound
MW,
kg/kg
mol
%
Metal
%O
or
S
CuFeS2
CuSFeSl
CUO
cuzo
CuSi03:2H20
cus
cuzs
cuso4
CuS0a:CuO
101.96
16.04
30.07
28.01
44.01
100.09
56.08
151.99
221.12
344.67
213.57
183.51
501.82
79.55
143.09
175.66
95.61
159.15
159.60
239.15
354.72
52.9
74.9
79.9
42.9
27.3
56.0% CaO
71.5
68.4
57.5
55.3
59.5
34.6 Cu
30.4
Fe
63.3 Cu
11.1
Fe
79.9
88.8
36.2
66.5
79.9
39.8
53.1
53.7
47.1
25.1
20.1
57.1
72.7
44.0% COz
28.5
31.6
5.4
c
0.9 H
36.2
0
7.0 C
0.6 H
37.1
0
16.6 C1
1.4H
22.5
0
35.0
25.6
20.1
11.2
2.3
H
27.3
0
34.2
SiOz
33.5
20.1
40.1
0
20.1
s
33.5
0
13.4
S
1.1
H
36.1
0
9.0
S
40
1