Teach Yourself Facebook for Businessin 10 Minutes phần 10 pps
Bạn đang xem bản rút gọn của tài liệu. Xem và tải ngay bản đầy đủ của tài liệu tại đây (10.94 MB, 26 trang )
ptg
196
LESSON 14: Tracking the Performance o f Yo u r Facebook Presence
Facebook Insights is the core tool for tracking your results on Facebook.
This kind of software is known as analytics software because it helps you
analyze your results. For comparison, Google has a similar (but more com-
prehensive) tool called, somewhat predictably, Google Analytics.
Getting analytics software for free—and having the data entered for you
automatically, as part of a service—is revolutionary in marketing. People
have paid many thousands of dollars for quite simple analyses in the past.
You ca n do muc h be tt er, fo r f ree , wi th Fac ebo ok I ns igh ts .
This lesson concentrates on helping you understand and use Facebook
Insights. However, you should identify metrics and related information that
are important to you, but not tracked by Facebook Insights, and track those
as well. For instance, you may want to keep a record of comments made
by people about your advertising, or tie Facebook analytics to actual sales.
For any of this, you’ll need to figure out what you want to record and then
track those additional results outside of Facebook Insights.
Understanding Why Facebook
Data Is So Accurate
The demographic data you get on Facebook is the best you’re likely to get
in any marketing you do—far better than on any other online source. That
makes Facebook’s Insights statistics capability a very powerful tool.
Here’s what’s different about Facebook, for marketing information purposes:
.
Users are logged in as themselves. This is huge. Facebook is
rare in being a very large online site that you can’t usefully visit
without being logged in.
.
Facebook users enter demographic data. Facebook asks users
to enter a small amount of highly personal demographic data.
And because people interact with friends and family in Facebook,
they’re very highly motivated to be honest.
ptg
197
Understanding Why Facebook Data Is So Accurate
.
Facebook tracks pageviews precisely. Facebook Pages are fairly
simple—not a lot of Web 2.0 wizardry going on, as with the
Instant Search on Google that’s constantly changing the results as
you type. So pageviews are easy to count and to map to specific
users and their demographic data.
All this may seem simple enough, but the result is a real treasure trove of
highly accurate information—accurate within a couple of percentage
points, anyway, which in marketing is high precision indeed.
For comparison, Google AdWords gives you a lot of information about
how many people clicked an ad. But Google can’t tell you anything very
useful about the people who clicked, except a pretty good estimate as to
where they were when they clicked. Nothing about their age or gender, for
instance—which is the basic demographic information that marketers live
and die on. (Well, okay, marketers like income data too, when they can
get it.)
If you’re an experienced marketer, you may be a bit amazed by what
Facebook can provide. If you’re new to marketing, trust me—you’re about
to get very lucky in terms of getting accurate and useful data for your
advertising work.
Now it’s all too easy to read too much into good data. A famous saying in
science as well as statistics is, “Correlation is not causation.” That is, if
there’s a huge thunderstorm today and the home team wins its football
games tomorrow, it doesn’t mean that pregame thunderstorms help the
home team.
A lot of marketing is about finding these kinds of correlations and then
testing to see if they seem reliable. If you advertise heavily on Friday and
get a lot of business on Saturday, did one cause the other? What if the
surge of business comes on Sunday—or Tuesday?
Keep an open mind. Treat every occasion on which you advertise, do pub-
licity, or even (shudder) have bad news about your business hit the press,
as a fresh opportunity to learn. Keep an open mind and a closed wallet, not
the other way around.
ptg
198
LESSON 14: Tracking the Performance o f Yo u r Facebook Presence
Touring the Page Over view in
Insights
Facebook Insights provides key information about your Facebook Page in
a single place—the Page Overview. For more in-depth information,
Insights provides detailed Users and Interactions pages.
Use the Page Overview regularly for a quick update on your Facebook
activity. I recommend that you check it daily—at about the same time each
day—and note both the results and any related factors, such as your having
a sale or promotion, running or stopping a Facebook Ad, school being in
or out of session, vacation periods, even the weather. (For a retail opera-
tion, for instance, really bad weather might see visits to your Facebook
Page go up and check-ins to your Places Page go down.)
There are two main reasons for checking Insights daily rather than, say
once a week:
.
When you see a change in daily activity, you can record what
might have contributed to it while it’s fresh in your mind.
.
You have a ch anc e t o im pl eme nt a ny r es pon se s, c han ge s, o r n ew
ideas in real time and see the results quickly. You can even men-
tion changes in your stats in a status update.
By using Insights in this way, you’ll improve not only your Facebook pres-
ence, but potentially your whole business.
TIP: Export Data from the Page Overview
The Page Overview is where you export data from, as described in
the final section of this lesson.
The best way to get a sense of what Insights can do for you is to take a
look at how it actually works. This section takes you on a tour of the Page
Overview, explaining the information displayed and showing you how to
use the interactive features of Insights. The next two sections describe how
to get the most out of the Users and Interactions pages and the additional
information they provide.
ptg
199
Touring the Page Over v i ew in Insights
CAUTION: You Nee d 3 0 Fan s t o H ave I n s i g h t s
Insights won’t have any content until your page has at least 30
fans. If you don’t have Insights for your page yet, use the steps
and screenshots in this lesson as an example.
This section provides a tour. In the following sections, I go into more
detail about some of the important parts of it—but first, follow these steps
to see the Insights stats for your Facebook page:
1. Open your Facebook Home page. Click the Ads and Pages link
or See All if that link is not visible.
2. Underneath the name of your Facebook Page, click the link View
Insights.
The Page Overview page of Insights appears.
TIP: Talking to Other Facebook Page Holders
Consider asking around for friends and colleagues who have
Facebook Pages and will talk to you about their experience with it
and using Insights in particular. Sharing “insights” and experiences
is a great way to learn.
3. To export data to a spreadsheet or other program, click the
Export button. In the dialog that appears, choose Excel (XLS) or
Comma-Separated (CSV). Enter the Start Time (which means
the beginning date) and the End Time (which is the finishing
date). Click the Download button.
A CSV file can be easily imported into a word processing docu-
ment or a wide variety of other programs, whereas an Excel doc-
ument is usable by Microsoft Excel and a smaller number of
other programs.
4. Use the date range drop-down to set the date range to a period
that’s interesting to you. Click the drop-down menu and then
choose the beginning and ending date. Click Download.
ptg
200
LESSON 14: Tracking the Performance o f Yo u r Facebook Presence
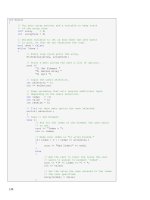
Figure 14.1 shows a year’s worth of stats for Transition San
Francisco.
NOTE: Transition Towns
Transi tion San Franci s co i s pa r t of the inter na t iona l Tran sitio n
Towns movement for loca l sus t aina b ilit y. For m ore infor ma t ion
about Transition Towns, visit www.transition.org.
The Page Overview includes summary charts for users and inter-
actions. It’s good for a quick overview. Then when you’re ready
for more detail, the same information—and much more—is avail-
able on the detail pages, which are creatively named Users and
Interactions.
NOTE: It’s All About Trends
If you work with any kind of marketing statistics for a period of
time, you’ll observe that you end up focusing mostly on trends and
possible explanations for them. The absolute numbers often seem
less important than trying to figure out what’s changing over time
FIGURE 14.1 Insights provides a view of the sustainability group.
ptg
201
Touring the Page Over v i ew in Insights
and why. Giving small amounts of attention to changes in your
stats on a regular basis is likely to yield big rewards.
5. Inspect the chart, Active Users.
The Active Users chart shows the number of people who inter-
acted with your Facebook Page. While this is valuable informa-
tion, you will also want to use other information in Insights to
figure out how extensive a typical visit is.
An immense amount of detail about your users appears in the
form of a series of graphs. You can get a sense of the functional-
ity of all the graphs by looking at and interacting with the first
chart, Active Users, as shown previously in Figure 14.1.
You re all y hav e to thi nk car ef ull y t o ma ke s ens e of th e st at ist ic s.
For instance, if you look at the daily view for a week within a
given month, the number of monthly active users will steadily
increase—not because your page is getting more popular, but
because throughout the month, some people are coming to your
page for the first time that month. You need to do month-to-
month comparisons to get a sense of overall usage trends for the
long term.
NOTE: New Likes and Lifetime Likes
Every time someone Likes your page, that’s a New Like—and, for
the moment, a Lifetime Like. But when someone “Unlikes” your
page or closes his Facebook account, he’s subtracted from Lifetime
Likes. “Lifetime Likes” really means something like “all the Likes
you currently have.” If you use the drop-down menus to choose a
time period that includes the entire history of your page, your New
Likes will be all the Likes you’ve ever gotten; your Lifetime Likes
will be either the same number, or something a bit less. Any differ-
ence represents people who dropped out. Don’t sweat it; having
some Unlikes and/or closed accounts is normal.
6. Try clicking to set and clear checkboxes and watch as the display
updates. Use the Week and Month buttons and the pull-down for
changing the date range, as well as the checkboxes, to view the
appropriate stats for time periods you’re interested in.
ptg
202
LESSON 14: Tracking the Performance o f Yo u r Facebook Presence
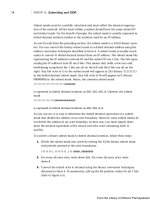
Display the stats in ways that make intuitive sense to you and
that allow your analytical capabilities to kick in. For instance,
Figure 14.2 shows daily statistics for a 2-week period, with the
first day a Monday. This focus makes it easy to see trends within
a week and how they vary or stay the same across a longer
period.
TIP: Getting Help
Developer’s documentation for Insights is available on all Insights
pages. Click the Documentation link on the left-hand side of the
page to access it. The documentation is a bit on the technical side,
but useful.
7. Scroll down and look at the Interactions area, which features the
Page Content Feedback graph (as shown in Figure 14.2). Note
the Post Views and Post Feedback areas.
FIGURE 14.2 Looking at a period of a specific number of weeks, for exam-
ple, allows you to see patterns.
ptg
203
Drilling Down on Insights about Users
Post Views is the number of people who looked at your status
updates. Post Feedback is the number of people who gave feed-
back via either a Like or a comment. In most cases, views will be
far higher than instances of feedback.
8. Use the Week and Month buttons and the pull-down for changing
the date range to view the number of interactions for various
periods. Click the Daily Likes and Daily Comments checkboxes
to show or hide Likes and comments information.
Interactions are a measure of engagement, and engagement is a
kind of Holy Grail for marketers. For more about this, see the
section about the Interactions page within Facebook near the end
of this lesson.
9. To see the Users page, click the Users link in the left-hand rail. To
see the Interactions page, click the Interactions link just beneath
it. To go to your Facebook Page, click the link, Go to Page.
The Users and Interactions pages each begin with the same charts
shown here in Figures 14.1 and 14.2. Each page also has addi-
tional interactive graphs that give more detail, as well as
Demographics (on the Users page only) and Activity (for both).
The next two sections describe what’s available on the Users and
Interactions pages.
Take some time and experiment with this page and with the Users and
Interactions pages as well. The Page Overview page is a great way to get a
quick update on whether various things you try, or events in the real world,
correlate to increases or decreases in your Facebook traffic. You can also
compare Facebook activity to sales, right down to the level of day-to-day
correlations to find out more about what’s working to bring in business.
The supporting pages add depth and detail.
Drilling Down on Insights about
Users
The Users page in Insights includes interactive graphs with different trend-
lines that you can show or hide, as on the Page Overview page, plus charts
ptg
204
LESSON 14: Tracking the Performance o f Yo u r Facebook Presence
that show breakdowns of demographic or message data. Taken together,
they give you a good idea of what’s happening on your Facebook Page and
should inspire ways to improve it.
The Users page begins with the Active Users graph, which is also on the
Overview page (shown previously in Figure 14.2).
The other graphs and charts in the Users page of Facebook Insights are
described in this section.
Daily Active Users Breakdown
The Daily Active Users Breakdown graph is a breakdown of what your
users actually do while they’re actively using your Page. An example for
Transition San Francisco is shown in Figure 14.3.
The user activities that Facebook tracks are
.
Unique Page Views. This is how many different pages the user
saw. (The page information is broken down by tabs further down
on the page.)
Chart with Post Viewers included
Chart with Post Viewers trendline turned off
FIGURE 14.3 The Daily Active Users Breakdown looks much different with
and without the Post Viewers trendline included.
ptg
205
Drilling Down on Insights about Users
.
Post Viewers. People who saw one of your posts or status
updates. This number is much higher because your status updates
go into the News Feed of people who Like your page; people
don’t have to visit your page to see your posts (though you
should frequently invite them to do so). To see the other numbers
in more detail, clear the checkbox for Post Viewers so the other
lines come into greater relief.
.
Liked a Post. The number of users who Liked one of your posts.
This is the easiest interaction, so you want to write at least some
posts that get a lot of Likes. (This could be a really appealing
offer, or personal news such as someone in your business having
a new arrival in their family.)
.
Commented on a Post. This is more work for users, so it’s
worth studying posts that get comments to see what’s attractive
about them—and to do that more in other posts.
.
Daily Wall Posts. This should logically be in front of the other
post-related categories. It shows the number of Wall posts per
day—it’s pretty hard for your users to interact with your posts if
you don’t create any!
New Likes
The New Likes chart “does what it says on the tin”—it shows your new
Likes and Unlikes. Look for spikes in both. Spikes in Likes may relate to
an ad, promotion, or other activity. Spikes in Unlikes are rare, but they
could be a form of silent protest if you fall off in your Facebook activity or
post something very unpopular.
The Like Sources area shows where people are Liking your page from.
“Page” means the Like button at the top of your Facebook Page. The Like
Box describes a little area in the upper right of some pages on Facebook
that shows the Likes of your Facebook friends. People often seem to Like
things in the Like Box to show a kind of solidarity with their friends—and
may be quick to Unlike them if the updates seem annoying.
ptg
206
LESSON 14: Tracking the Performance o f Yo u r Facebook Presence
Users can Unlike your page at any time. They simply click on the little X
next to a status update from you and choose Unlike this page from the
drop-down menu that appears. Don’t worry about a few Unlikes, but your
new Likes should strongly outnumber your new Unlikes in any given
period.
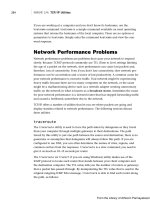
Demographics
The Demographics area, shown in Figure 14.4, is a detailed and potentially
very valuable breakdown of whom your users are and where they’re com-
ing from. The chart shows the number of men and women in five different
age ranges, 18–24 to start, then decade-long groups after that. The groups
are split between men and women.
Marketers kill—well, OK, they spend thousands and thousands of dol-
lars—for this kind of information, and what they get is often a mix of facts
FIGURE 14.4 Get your detailed demographic data while it’s hot!
ptg
207
Drilling Down on Insights about Users
and estimates. But here Facebook is giving you a very detailed, quite accu-
rate breakdown for free. Do factor in that Facebook users skew female
(55:45 in the United States) and younger (heaviest users are mostly under
30). With that in mind, this breakdown may well be fascinating to you.
Note that these percentages don’t represent your actual customers or other
interested parties, but the ones who are active on Facebook. Because
Facebook skews young and female, evaluate how your group compares.
For instance, on the Transition page (shown in Figure 14.4), visitors are
slightly more male than female and slightly more middle-aged (35 and up)
than young (34 and under). This indicates that the real-world group is per-
haps even more male and older than the active Facebook users shown in
the chart.
Facebook also shows top countries, top cities, and language origins of the
page’s users. In the example shown in Figure 14.4, it’s interesting that
nearly 10% of the visitors are from other countries, and fewer than half of
those shown in the Cities list are actually from San Francisco. There are a
few people whose language is not shown as American English. Don’t get
too caught up in small numbers like these, though; there are often inaccu-
racies, and they’re not very important, even if true, compared to the big
picture.
TIP: Keep Your Eyes on the Prize
Don’t get caught up in statistical oddities like the occasional visitor
to your page who hails from Tibet. There’s some wrong information
in Facebook, and odd things really do happen as well. Focus on the
bigger picture, like which user groups are largest and how best to
meet their needs (and win their business).
Activity—Page Views and Media
Consumption
In the Activity area, you see Page Views; Tab Views (a breakdown of
where people go when they visit your page); external traffic referrers; and
media consumption for photos, videos, and audio files.
ptg
208
LESSON 14: Tracking the Performance o f Yo u r Facebook Presence
FIGURE 14.5 Facebook draws you a picture of where your visitors go on
your page.
The Activity area is shown in Figure 14.5. The major sections are
.
Page Views. This chart has two trendlines—total page views and
unique page views. If the same user visits your page four times,
that counts as four total page views but just one unique page
view. (“Unique page view” really means “unique users who
viewed your page.”)
.
Tab Views. This chart breaks down where visitors to your page
go. As with other data, ignore the small numbers—these can be
accidents or the result of someone clicking every tab once. Look
at the big numbers; where’s most of the traffic? Then think about
increasing depth—drawing people to those popular pages, as well
as breadth—putting things on the other pages to draw people in.
.
External Referrers. Facebook has a much weaker grasp of this
than it does of activity within Facebook; you might need to find
ptg
209
Drilling Down on Interactions
other sources for this information, or even ask people how they
got to your page.
.
Media Consumption. This chart is great for seeing the results
when you put effort into providing videos, audio clips, and pho-
tos to your Facebook presence.
Drilling Down on Interactions
The Interactions page within Insights is like the Users page, but it delves
into detail about what users do, not just whether they visit your pages.
As mentioned earlier in this lesson, interactions are related to engage-
ment—people identifying personally with you and your business. When
people engage with your business online, they’re more likely to think of
you when they want to buy whatever it is you sell. They’re also likely to
spend more, tell their friends about you, and so on.
Interactions are hard to get. Usually, many people will look at a piece of
information for every one who comments on it. However, it’s worth the
effort to track comments because they’re so closely tied to engagement.
The Interactions page begins with the Page Content Feedback graph,
which is also on the Overview page. It’s described in a previous section
and shown in Figure 14.6.
Page Posts
The Page Posts table shows your top posts from most recent to oldest
within the time frame you’ve chosen. Transition San Francisco’s top ten
posts for the past year are shown in Figure 14.6.
Insights shows you:
.
Message. Insights shows the first words of the message—and
links to the entire message. You can see exactly what people got
excited about.
.
Posted. Insights shows the date and time posted. Note that the
header has a little triangle on it. Click the header to reverse the
sorting order.
ptg
210
LESSON 14: Tracking the Performance o f Yo u r Facebook Presence
FIGURE 14.6 Insights shows your top posts in the period you specify.
.
Impressions. The number of users who saw the post. These
numbers can be pretty impressive for the top posts.
.
Feedback. This is the percentage of people who Liked or com-
mented on the post. Your mileage may vary.
Page Activity
The Page Activity chart shows how your content is reused by others. The
trendlines are:
.
Mentions. This refers to visitors mentioning your post in their
own status updates.
.
Discussion Posts. Posting to a discussion on your page.
.
Reviews. Writing a review if the opportunity is offered.
ptg
211
Summary
.
Wall Posts. Mentioning your post on their own post to a friend’s
Wall.
.
Photos or Videos. Uploading photos or videos to your Page.
For many fan pages, this area will be quite skimpy. However, it’s worth
making an effort to build up your numbers here, as these measurements all
reflect a high degree of engagement with your content.
The previous example of Transition San Francisco’s page activity (shown
in Figure 14.6) reflects a few Mentions and, the last bump on the graph, a
Wall Post of our content.
Summary
In this lesson, you learned why tracking your Facebook presence is impor-
tant and how Facebook can provide you with such accurate demographic
information. You also learned how to use the Page Overview in Insights,
and how to use the detail pages for Users and Interactions.
This book has taken you on a long journey, from a quick introduction to
Facebook all the way to measuring the impact of your Facebook presence
on your actual and potential customers. It’s amazing how deep those
friendly looking Facebook pages can be, in terms of their impact on you
and your business. I hope you’ve enjoyed the journey, and that it con-
tributes to helping you achieve your hopes and dreams.
ptg
This page intentionally left blank
ptg
A
accuracy of Facebook data, 196-198
Active Users chart, in Facebook
Insights, 201
Activity area, in Facebook Insights,
207-208
Ads. See Facebook Ads
advertising. See also Facebook Ads;
Facebook Deals; promotion
spam, avoiding sending, 191
terminology, 170-173
tracking. See also Facebook
Insights
accuracy of Facebook
data, 196-198
importance of, 195-196
wastage, avoiding, 158-160
AdWords. See Google AdWords
age targeting, in Facebook Ads, 166
Amazon.com, 81
Facebook presence of, 22-23
fan page contents, 19-22
number of fans, 13
analytics. See Facebook Insights
apps
adding to fan pages, 103-104
finding, 43-51
installing, 50-51
availability of business names,
checking, 88-90
B
BATCS (Business and Technical
Communications Services), 56-57
bidding, in advertising, 180
Blisstree, 185
budgeting for Facebook Ads,
155-157
Business and Technical
Communications Services
(BATCS), 56-57
business Facebook pages, creating
personal pages as, 27-28.
See also fan pages
Index
ptg
business names, 85-91
checking availability, 88-90
selecting, 87-91
vanity URLs, 86
business-friendly, personal Facebook
pages as, 25-27
C
call to action, in Facebook Ads,
160-161
changing
mobile settings, 105-108
privacy settings, 34-39
vanity URLs, 107
Charity Deals, 150
checking in to Facebook Places,
41, 62-66
claiming Places pages, 128-130,
134-136
click-through ratio (CTR),
defined, 172
comments, removing, 82
community, growing. See promotion
configuring fan pages. See setting up
fan pages
connections targeting, in Facebook
Ads, 168
connectors, 157
contact information
entering on fan page, 100-102
on profile, 34
sharing, 95-96
copying websites, versus linking in
Facebook, 74
CPC (cost per click), defined, 171
CPM (cost per thousand),
defined, 172
creative, defined, 171
cross-promotions, 192-193
CTR (click-through ratio),
defined, 172
D
Daily Active Users Breakdown
graph, in Facebook Insights,
204-205
daily budget, defined, 172
Deals. See Facebook Deals
demographics
for advertising, 158-160
defined, 171
in Facebook Insights, 206-207
designing Facebook Ads, 161-163
discussion boards
planning fan pages, 81-83
starting discussions on, 122-123
domain names. See business names
Domain Superstar, 88
E
editing
Facebook Deals, 150-151
Places pages, 133-134
profile, 31-34
education level targeting, in
Facebook Ads, 166
eHow.com, 44
email addresses for Facebook
signup, 29
214
business names
ptg
email messages, updating fan pages
with, 106-107
employees, restricting personal
Facebook postings, 27
events, planning fan pages, 81-83
Events tab, adding to fan pages,
123-124
exporting Facebook Insights
data, 199
External Referrers chart, in
Facebook Insights, 208
F
accuracy of data, 196-198
business reasons for joining,
12-16
fan pages. See fan pages
friends map, 10
Google versus, 2-3, 12
marketing strategy with, 53-55,
66-68
overview, 1-2
personal pages. See personal
Facebook pages
popularity of, 9-12
press mentions from, 16
promotions within, 189-191
signing up, 28-29
Facebook Ads. See also advertising
budgeting for, 155-157
call to action in, 160-161
creating, 173-181
defined, 1
designing, 161-163
explained, 61-62
Google AdWords versus,
169-170
targeting, 162-168
major targeting types,
165-167
minor targeting types,
167-168
user location, determining,
164-165
testing, 167
Facebook Deals
ability to offer, 145-146
advantages of, 141-145
creating, 150-153
defined, 1
explained, 59-60
suggestions for, 146-149
types of, 150
Facebook Groups
caution using, 26
changes to, 19
Facebook Insights, 161, 196
Interactions page, 209-211
Page Activity chart, 211
Page Posts table, 209-210
Page Overview page, 198-203
Users page, 203-208
Activity area, 207-208
Daily Active Users
Breakdown graph,
204-205
Demographics area,
206-207
New Likes chart, 205-206
Facebook Markup Language
(FBML), 76-78
How can we make this index more useful? Email us at
215
Facebook Markup Language (FBML)
ptg
Facebook Places. See also Places
pages
checking in, 41, 62-66
defined, 1
purpose of, 125-128
fan pages
Amazon.com Facebook
presence, 22-23
apps, finding, 43-51
business names, 85-91
checking availability,
88-90
selecting, 87-91
vanity URLs, 86
creating, 91-97
defined, 1
discussions, starting, 122-123
elements of, 71-73
explained, 19-22, 56-57
Info tab, updating, 118
liking, limits on, 31
merging with Places pages,
137-139
photos, tagging, 119-121
planning, 73-83
events/reviews/discussion
boards, 81-83
FBML (Facebook Markup
Language), 76-78
photos, 77-78
videos, 78-80
website tabs, adapting,
74-75
sending invitations to visit,
111-112
separating from Places
pages, 57
setting up
adding apps, 103-104
adding profile picture,
102-104
changing mobile settings,
105-108
entering basic information,
100-102
status updates on, 113-118
link updates, 116-117
photos, 115-116
text status updates,
113-115
video updates, 117-118
tabs, adding, 123-124
FBML (Facebook Markup
Language), 76-78
finding
apps, 43-51
friends, 30-31
Friend Deals, 150
friends, finding, 30-31
friends map, 10
G-H
gender targeting, in Facebook
Ads, 166
Gladwell, Malcolm, 157
GoDaddy, 89
Google, Facebook versus, 2-3, 12
Google AdWords
defined, 2
Facebook Ads versus, 169-170
Google Places, defined, 2
Groups. See Facebook Groups
growing community. See promotion
216
Facebook Places
ptg
I
I Can Has Cheezburger?
website, 78
Individual Deals, 150
Info tab, updating, 118
Insights. See Facebook Insights
installing apps, 50-51
Interactions page, in Facebook
Insights, 209-211
Page Activity chart, 211
Page Posts table, 209-210
invitations to fan pages, sending,
111-112
iPad, 105-107
iPhone Facebook App, 107
J
joining Facebook, business reasons
for, 12-16
K
keyword searches, for search engine
marketing, 163
L
language targeting, in Facebook
Ads, 168
Lifetime Likes, in Facebook
Insights, 201
Likes
in Facebook Insights, 201
importance of, 112
measuring, 185
likes and interests targeting, in
Facebook Ads, 168
liking fan pages, limits on, 31
linking to websites, versus copying
in Facebook, 74
links
on fan pages, 116-117
posting, 41
Links tab, adding to fan
pages, 123-124
location of user
determining, 164-165
targeting, 166
logos, adding to fan pages, 102-104
Loyalty Deals, 150
M
Mad Men (television program), 173
marketing strategy with Facebook,
53-55, 66-68
Mashable.com, 11, 44
maximum bid, defined, 172
measuring promotion efforts,
185-186
Media Consumption chart, in
Facebook Insights, 209
merging Places pages and fan pages,
137-139
mobile settings, changing, 105-108
Most Recent, defined, 18
How can we make this index more useful? Email us at
217
Most Recent, defined
ptg
multiple locations, Places pages
for, 129-130, 139
multiple URLs, 89
N
names. See business names
network effect, 184
NetworkedBlogs app, 49
New Likes, in Facebook Insights,
201, 205-206
News Feed, defined, 17-18
Notes tab, adding to fan
pages, 123-124
O
online promotions, 189-191
P
Page Activity chart, in Facebook
Insights, 211
Page Overview page, in Facebook
Insights, 198-203
Page Posts table, in Facebook
Insights, 209-210
Page Views chart, in Facebook
Insights, 208
Palin, Sarah, 1
Pearson Technology Group Canada
fan page, 76
Pep Boys fan page, 56-55, 77-78
discussion boards on, 81-82
photos on, 78-79
videos on, 80
permissions, installing apps, 51
personal Facebook pages
apps
finding, 43-51
installing, 50-51
as business-friendly, 25-27
creating as business-only
pages, 27-28
explained, 16-19
privacy settings, changing,
34-39
profile, editing, 31-34
status updates, sharing, 39-42
photos
on fan pages, 115-116
planning fan pages, 77-78
posting, 40-41
profile pictures, adding to fan
pages, 102-104
tagging, 119-121
Places pages. See also Facebook
Places
adding new, 130-133
claiming, 128-130, 134-136
editing, 133-134
explained, 58-59
Facebook Deals on, 59-60
merging with fan pages,
137-139
for multiple locations,
129-130, 139
separating from fan pages, 57
virtual businesses and, 128
planning fan pages, 73-83
events/reviews/discussion
boards, 81-83
FBML (Facebook Markup
Language), 76-78
218
multiple locations, Places pages for
ptg
photos, 77-78
videos, 78-80
website tabs, adapting, 74-75
popularity of Facebook, 9-12
posting
links, 41
photos, 40-41
videos, 41
press mentions from Facebook, 16
privacy settings, changing, 34-39
profile
editing, 31-34
privacy settings, changing,
34-39
profile pictures, adding to fan pages,
102-104
profit, revenue versus, 156
promotion. See also advertising
cross-promotions, 192-193
importance of, 183-184
measuring, 185-186
online promotions, 189-191
real-world promotions, 186-189
Q
QR codes, 187
R
real-world promotions, 186-189
relationship status targeting, in
Facebook Ads, 166
removing comments, 82
restricting employees’ personal
Facebook postings, 27
revenue, profit versus, 156
reviews, planning fan pages, 81-83
S
search engine marketing, 163
searching, 30-31, 43-51
security
permissions, installing apps, 51
sharing contact information,
95-96
selecting business names, 87-91
sending
invitations to fan pages,
111-112
spam, avoiding, 191
setting up fan pages
adding apps, 103-104
adding profile picture, 102-104
changing mobile settings,
105-108
entering basic information,
100-102
sharing
contact information, 95-96
on fan pages, 113-118
status updates, 39-42
signing up
for Facebook, 28-29
for fan pages, 91-97
SMS, updating fan pages with, 108
social graph, 128, 148
The Social Network (film), 1
spam, avoiding sending, 191
starting discussions, 122-123
How can we make this index more useful? Email us at
219
starting discussions
ptg
status updates
on fan pages, 113-118
link updates, 116-117
photos, 115-116
text status updates,
113-115
video updates, 117-118
sharing, 39-42
storyboards for fan pages, 73
T
Tab Views chart, in Facebook
Insights, 208
tabs
adapting from website, 74-75
adding to fan pages, 123-124
in Amazon.com Facebook
page, 22
avoiding too many, 22
tagging photos, 119-121
targeting Facebook Ads, 162-168.
See also advertising
major targeting types, 165-167
minor targeting types, 167-168
user location, determining,
164-165
testing Facebook Ads, 167
text messaging, updating fan pages
with, 108
text status updates, on fan pages,
113-115
The Tipping Point (Gladwell), 157
Top News, defined, 18
TouchGraph, 148
tracking advertising. See also
Facebook Insights
accuracy of Facebook data,
196-198
importance of, 195-196
Transition Towns, 200
“25 Rules for Choosing a Domain
Name,” 88
U
updates, 17-18. See also status
updates
updating Info tab, 118
URLs. See business names
user location
determining, 164-165
targeting, 166
Users page, in Facebook Insights,
203-208
Activity area, 207-208
Daily Active Users Breakdown
graph, 204-205
Demographics area, 206-207
New Likes chart, 205-206
V
vanity URLs
changing, 107
defined, 85
reasons for using, 86
videos
on fan pages, 117-118
planning fan pages, 78-80
posting, 41
220
status updates